15. Maps: Showing Maharashtra on a Map
15.7 Map Tips and Changes Over Time
Start with a problem
Shraddha notices the map looked different last quarter: a visual name changed and one bubble moved after a data refresh.
Explain simply
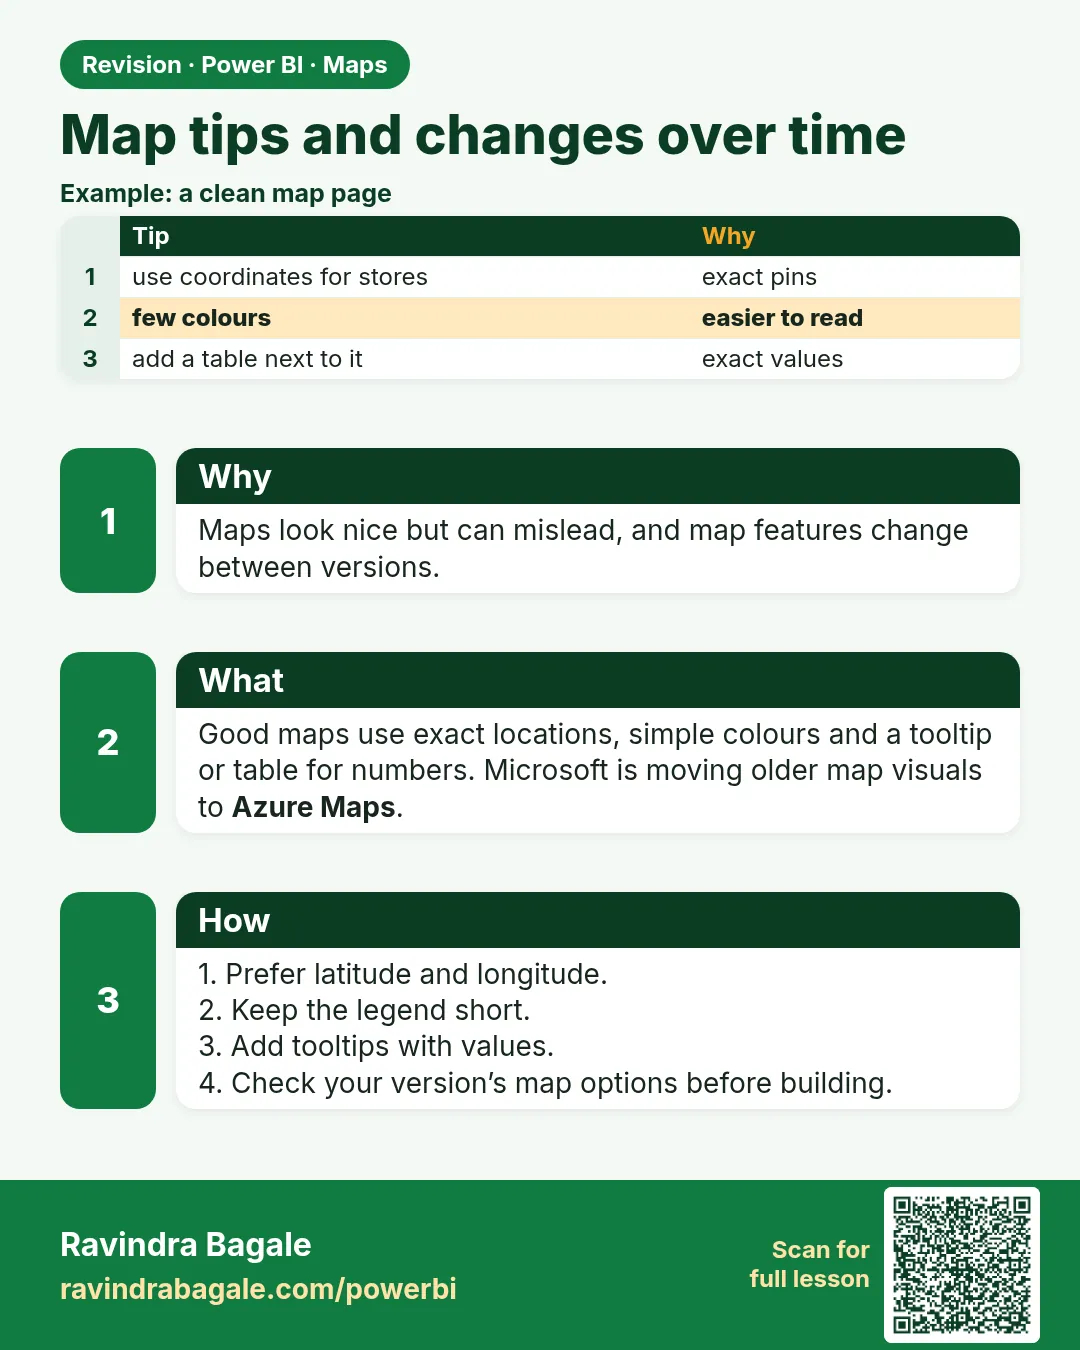
Map visuals change across Desktop versions (new visuals appear, older ones are retired), and geocoding results can change. Good practice: prefer coordinates, label clearly, and re-check after updates.
Show the data
| Check | Why |
|---|---|
| Use Latitude/Longitude where possible | Stable positions |
| Add data labels or a table | Exact values readable |
| Re-test after Desktop update | Visual names and options change |
About this data: This table uses columns: Check, Why. This table uses columns: Store, Expected tooltip. This table uses columns: Wrong result, Reason, Correction. Values shown are the lesson examples already on this page (not a new dataset).
Fictional sample data. Practice file: visuals_orders_apr_may_2026.csv, dark_stores_maharashtra.csv (source: src/practice/).
Demonstrate
- After each Desktop update, open the map page.
- Hover two known stores (Kothrud, Rajarampuri) and confirm the tooltip values (₹650, ₹450).
- Check Format options still match your standard (bubble size, colours).
- Note any changed visual name in the report change log.
Show the result
Your result should look like this (fictional sample):
| Store | Expected tooltip |
|---|---|
| Kothrud | ₹650 |
| Rajarampuri | ₹450 |
Explain what happened
Testing two known points catches both geocoding drift and visual changes quickly.
Explore further
- If a visual is being retired, plan the migration (e.g., to Azure Maps) before the deadline in Microsoft's notice.
Detailed reference for this lesson:
- Microsoft is transitioning the older Map and Filled map (Bing Maps) to the Azure Maps visual. Newer Desktop versions may offer to upgrade existing maps automatically. Learn Azure Maps for new reports.
- Too many points slow maps down and may be sampled. Aggregate to store level, not order level.
- Maps need an internet connection. When presenting offline, export a static image as a backup.
Practice task
Build a bubble map of all dark stores in the six cities with latitude/longitude, bubble size = Total Orders, colour = red/amber/green based on Avg Delivery Time, and tooltips showing Store Name and Cancellation Rate. Then create the same view as a bar chart and discuss which one the operations head (Rani) would prefer.
Ravindra Bagale's Tip
Remember one thing: map behaviour changes over time (visuals get replaced or deprecated), and some students build reports on a visual that later shows a warning. Check Microsoft's current guidance for map visuals before a big project, and keep latitude/longitude columns so you can switch visuals easily. This matters for both exams and interviews.
Ravindra Bagale's Tip – मराठी
एक गोष्ट लक्षात ठेवा: maps चं वागणं काळानुसार बदलतं (visuals बदलले जातात किंवा deprecated होतात), आणि काही students अशा visual वर reports बनवतात जो नंतर warning दाखवतो. मोठ्या project आधी map visuals बद्दल Microsoft चं सध्याचं guidance चेक करा, आणि latitude/longitude columns ठेवा म्हणजे visuals सहज बदलता येतील. हे exam आणि interview दोन्हीसाठी important आहे.
Ravindra Bagale's Tip – हिंदी
एक बात याद रखो: maps का व्यवहार समय के साथ बदलता है (visuals बदले जाते हैं या deprecated होते हैं), और कुछ students ऐसे visual पर reports बनाते हैं जो बाद में warning दिखाता है. बड़े project से पहले map visuals पर Microsoft की मौजूदा guidance check करो, और latitude/longitude columns रखो ताकि visuals आसानी से बदल सको. यह exam और interview दोनों के लिए ज़रूरी है.
Fix common mistakes
| Wrong result | Reason | Correction |
|---|---|---|
| Bubble moved after refresh | Text geocoding changed | Use coordinates |
| Format options missing after update | Visual changed | Re-apply formatting; update the theme |
| Map too busy | Too many layers or bubbles | Filter to the question's scope |
Practise independently
Practice task
Write a two-line change-log entry for a map check.
Hints
- Date in IST, what you checked, result.
Solution
06-Oct-2026 IST – Map page checked after Desktop update. Kothrud ₹650 and Rajarampuri ₹450 tooltips correct; no layout change.
Think like a professional
Small, regular checks keep a report trustworthy. A change log also helps in audits and handovers.
Thodkyaat sangaycha tar (quick recap)
Set the data category, give the full location like "City, Maharashtra, India", and when in doubt use latitude and longitude. Use a map only when the location really matters. Now let us move on to drill down.
Data category set करा, "City, Maharashtra, India" असं पूर्ण location द्या, आणि शंका असेल तर latitude-longitude वापरा. Map फक्त location महत्त्वाचं असेल तेव्हाच वापरा. आता पुढे जाऊया drill down कडे.
Data category set कीजिए, "City, Maharashtra, India" जैसा पूरा location दीजिए, और शक हो तो latitude-longitude इस्तेमाल कीजिए. Map सिर्फ़ तभी इस्तेमाल कीजिए जब location सच में मायने रखता हो. अब आगे बढ़ते हैं drill down की ओर.
 Revision card