15. Maps: Showing Maharashtra on a Map
15.5 Worked Example: Maharashtra Dark Store Bubble Map
Start with a problem
Rani asks for a one-page Maharashtra view: where each dark store is, how much it sells, and which store is slow.
Explain simply
Combine the store map with a measure for size and a colour rule for speed, then add a table beside it so exact values are readable.
Show the data
| Store | Total Sales (₹) | Avg delivery mins |
|---|---|---|
| Kothrud | 650 | 12.0 |
| College Road | 500 | 10.0 |
| Rajarampuri | 450 | 7.0 |
| Gangapur | 300 | 14.0 |
| Baner | 200 | 12.0 |
About this data: This table uses columns: Store, Total Sales (₹), Avg delivery mins. This table uses columns: Store, Colour. This table uses columns: Wrong result, Reason, Correction. Values shown are the lesson examples already on this page (not a new dataset).
Fictional sample data. Practice file: visuals_orders_apr_may_2026.csv, dark_stores_maharashtra.csv (source: src/practice/).
Demonstrate
- Use the store map from 15.4 (Latitude/Longitude, Bubble size
Total Sales). - Format › Bubbles › Colors › fx › Format style Rules › based on
Avg Delivery Mins: > 12 red, ≤ 12 green. - Add a Table beside the map: Store, Total Sales, Avg Delivery Mins, sorted by Avg mins descending.
- Title: Gangapur is the slowest store this period.
Show the result
Your result should look like this (fictional sample):
| Store | Colour |
|---|---|
| Gangapur (14.0) | Red |
| Kothrud, Baner (12.0) | Green (rule is > 12) |
| College Road (10.0) | Green |
| Rajarampuri (7.0) | Green |
Explain what happened
Conditional formatting evaluates Avg Delivery Mins per bubble. Only Gangapur is above 12, so only it turns red.
Explore further
- Use a rule threshold that the business agrees (here 12 minutes is an example).
Detailed reference for this lesson:
Steps in Power BI
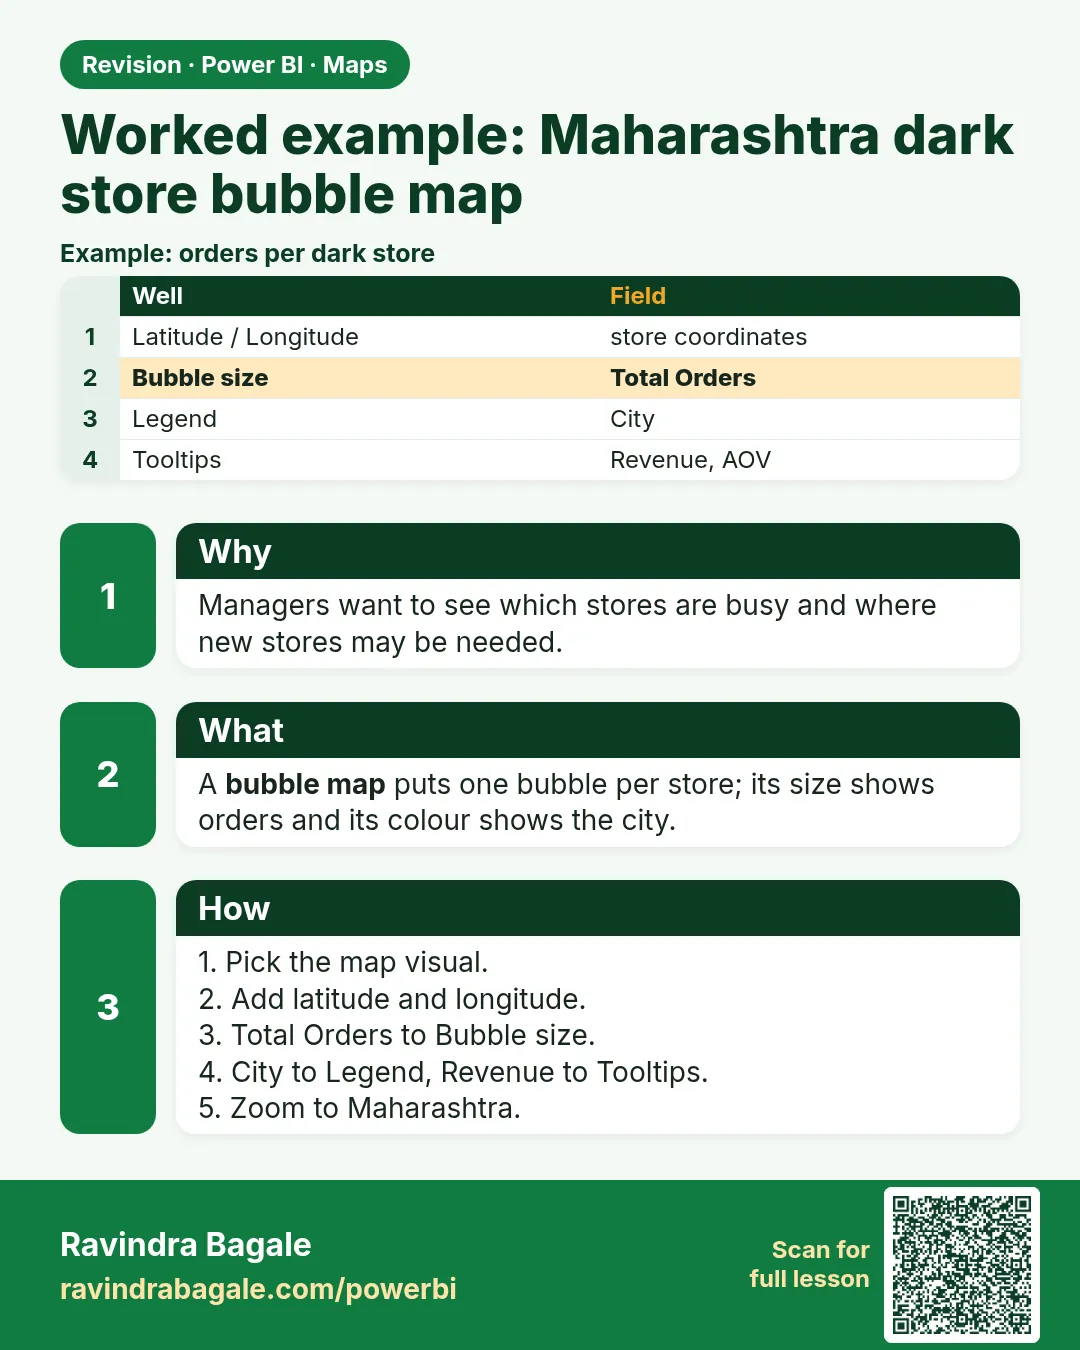
- Click an empty canvas area › Visualizations › Map (or Azure map).
- Latitude =
DarkStore[Latitude], Longitude =DarkStore[Longitude](set to Don't summarize or Average; they must not be summed!). Alternatively, Location =DarkStore[Map Location]. - Bubble size (Size) =
[Total Orders]; Legend =DarkStore[City]orOrders[Platform]; Tooltips = Avg Delivery Time (mins), Cancellation Rate, Store Name. - Format visual › Visual › Map settings › Style (Road, Aerial, Dark, Light, Grayscale) › Auto zoom On. Turn on the zoom buttons if available.
- Bubbles › Size slider to avoid overlapping Pune stores; Colors › fx for conditional colour (red when Avg Delivery Time > 15 mins, Module 20.6).
- Category labels › On (shows the store names; turn off if crowded).
- Add a slicer for Platform and a card for the selected city's orders. Use Edit interactions so the map filters the cards.
Filled map with colour saturation: Location = District (data category County or Place), then Format › Visual › Fill colors › fx › Format style Gradient › based on Total Orders (light yellow, then dark green). With colour saturation, darker areas have more orders.
Heat map for customer density
Look: in the Azure map, add a Heat map layer with customer latitude/longitude (for example drop locations around Baner, Wakad and Hinjewadi). Use it to decide where the next Pune dark store should open. Use approximate or anonymised locations to protect customer privacy.
Ravindra Bagale's Tip
A common mistake is using bubble size for a measure with a huge range, so one Pune store hides all the others. Adjust the bubble size range in the format settings, or use colour for the measure and a fixed size. Always add a tooltip with the store name and key numbers. Never forget this.
Ravindra Bagale's Tip – मराठी
एक common चूक म्हणजे खूप मोठी range असलेल्या measure साठी bubble size वापरणं, त्यामुळे Pune चा एकच store बाकी सगळ्यांना झाकतो. Format settings मध्ये bubble size range बदला, किंवा measure साठी रंग वापरा आणि size fixed ठेवा. नेहमी store name आणि मुख्य numbers असलेला tooltip जोडा. हे अजिबात विसरू नका.
Ravindra Bagale's Tip – हिंदी
एक common गलती है बहुत बड़ी range वाले measure के लिए bubble size इस्तेमाल करना, जिससे Pune का एक store बाकी सबको ढक लेता है. Format settings में bubble size range बदलो, या measure के लिए रंग इस्तेमाल करो और size fixed रखो. हमेशा store name और मुख्य numbers वाला tooltip जोड़ो. यह बिल्कुल मत भूलना.
Fix common mistakes
| Wrong result | Reason | Correction |
|---|---|---|
| Kothrud red at exactly 12.0 | Rule written as ≥ 12 | Agree whether the boundary is inclusive |
| Title wrong after a filter | Static title | Use a dynamic title measure (Module 20.2) |
| Map and table disagree | Different measures | Use the same measures in both |
Practise independently
Practice task
Change the rule threshold to 11. Which stores turn red?
Hints
- Compare each Avg with 11.
Solution
Gangapur (14.0), Kothrud (12.0) and Baner (12.0).
Think like a professional
A map page should end with an action: send one extra rider to Gangapur at peak. Thresholds should come from the operations team, not the analyst.
 Revision card