15. Maps: Showing Maharashtra on a Map
15.4 Latitude and Longitude for Dark Stores
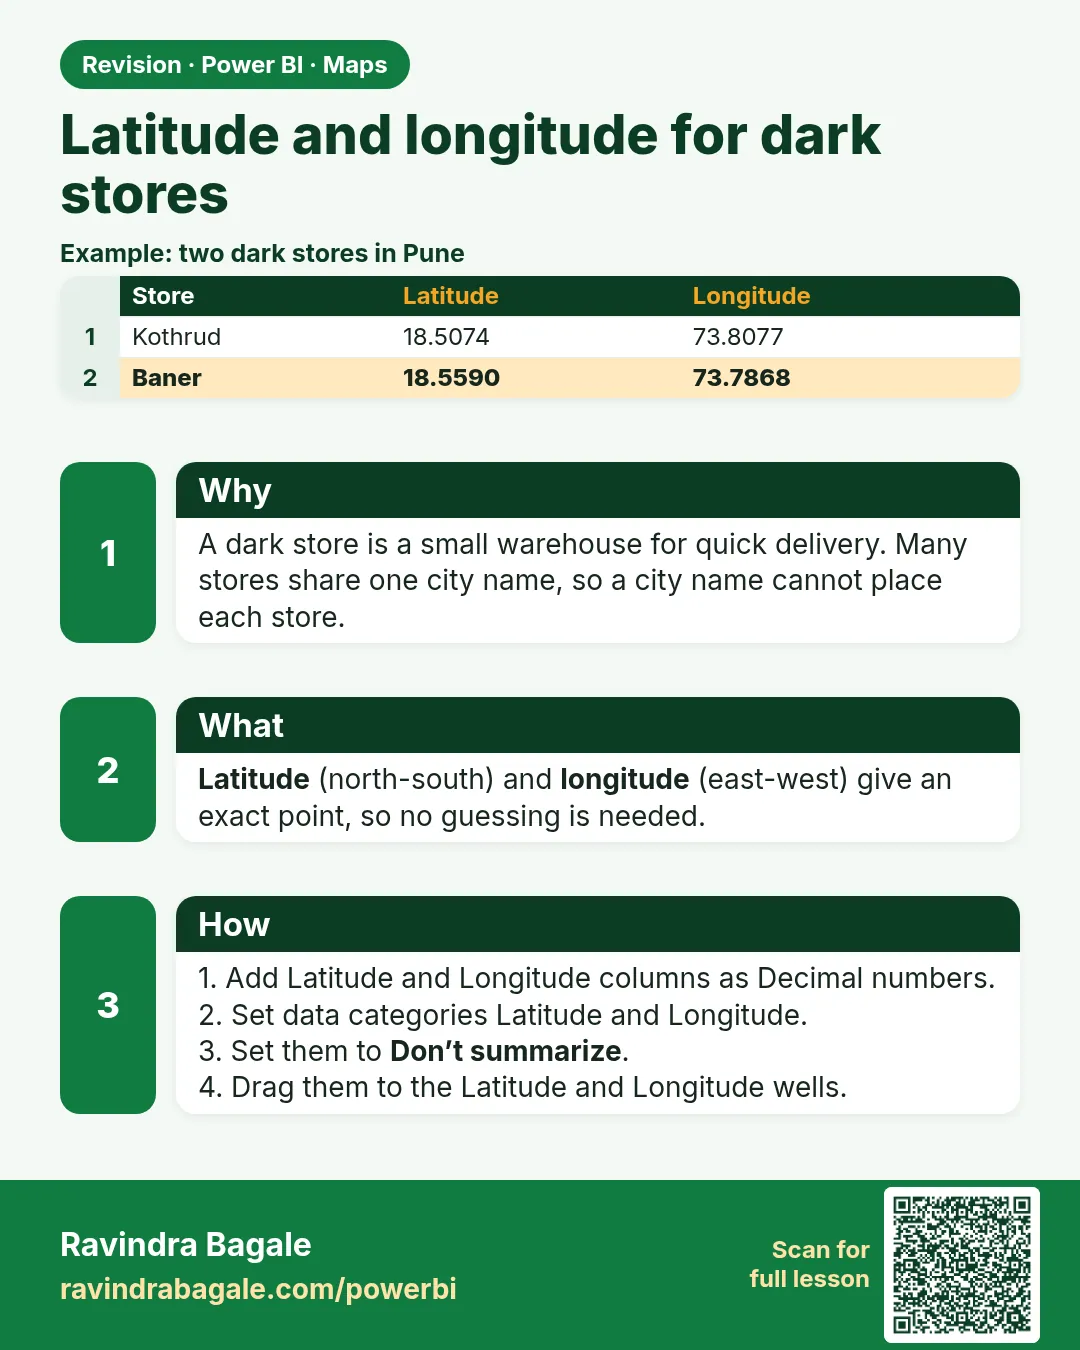
In short: Two Pune dark stores, Kothrud and Baner, both appear as one Pune bubble.
Start with a problem
Two Pune dark stores, Kothrud and Baner, both appear as one Pune bubble. Ravindra needs a bubble for each store.
Explain simply
Latitude (north–south position) and Longitude (east–west position) give an exact point, so no geocoding is needed. Set their data categories so the map uses them.
Show the data
| Store | City | Latitude | Longitude | Total Sales (₹) |
|---|---|---|---|---|
| Kothrud | Pune | 18.5074 | 73.8077 | 650 |
| Baner | Pune | 18.5590 | 73.7868 | 200 |
| Gangapur | Nashik | 20.0110 | 73.7650 | 300 |
| College Road | Nashik | 20.0059 | 73.7629 | 500 |
| Rajarampuri | Kolhapur | 16.6950 | 74.2430 | 450 |
About this data: This table uses columns: Store, City, Latitude, Longitude, Total Sales (₹). This table uses columns: Store, City, Map result. This table uses columns: Store, Latitude, Longitude, Map result. Values shown are the lesson examples already on this page (not a new dataset).
Fictional sample data. Practice file: visuals_orders_apr_may_2026.csv, dark_stores_maharashtra.csv (source: src/practice/).
Demonstrate
- Load
dark_stores_maharashtra.csvand relateStores[Store]toOrders[Store](one-to-many). - Set Data category:
Latitude→ Latitude,Longitude→ Longitude; Summarization Don't summarize. - Insert Map: Latitude
Latitude, LongitudeLongitude, Bubble sizeTotal Sales, TooltipsStore. - Zoom into Pune to see two separate bubbles.
Show the result
Your result should look like this (fictional sample):
| Store | City | Latitude | Longitude | Total Sales (₹) |
|---|---|---|---|---|
| Kothrud | Pune | 18.5074 | 73.8077 | 650 |
| Baner | Pune | 18.5590 | 73.7868 | 200 |
| Gangapur | Nashik | 20.0110 | 73.7650 | 300 |
| College Road | Nashik | 20.0059 | 73.7629 | 500 |
| Rajarampuri | Kolhapur | 16.6950 | 74.2430 | 450 |
Explain what happened
Each store has its own coordinates, so each becomes its own point. The bubble size is Total Sales filtered to that store through the relationship.
Explore further
- Coordinates in this file are approximate area points for teaching, not exact store addresses.
Detailed reference for this lesson:
Latitude and longitude on a Power BI map with example — in 30 seconds
What: Latitude and longitude are exact map points. With them, Power BI does not have to guess where a place is.
Why: Some place names exist in more than one state. Power BI may put the dot in the wrong state.
Tiny example: A store with only "Aurangabad" can land in Bihar. With latitude 19.876 and longitude 75.343 it sits in Sambhaji Nagar.
Latitude and longitude on a Power BI map with example — 30 सेकंदात
काय: Latitude आणि longitude म्हणजे map वरचे अचूक बिंदू. ते असले की Power BI ला जागेचा अंदाज लावावा लागत नाही.
का: काही जागांची नावं एकापेक्षा जास्त राज्यांत असतात. Power BI dot चुकीच्या राज्यात टाकू शकतो.
छोटं उदाहरण: फक्त "Aurangabad" असलेला store Bihar मध्ये पडू शकतो. Latitude 19.876 आणि longitude 75.343 असले की तो Sambhaji Nagar मध्ये बसतो.
Latitude and longitude on a Power BI map with example — 30 सेकंड में
क्या: Latitude और longitude map के सटीक बिंदु हैं. ये हों तो Power BI को जगह का अंदाज़ा नहीं लगाना पड़ता.
क्यों: कुछ जगहों के नाम एक से ज़्यादा राज्यों में होते हैं. Power BI dot ग़लत राज्य में डाल सकता है.
छोटा उदाहरण: सिर्फ़ "Aurangabad" वाला store Bihar में जा सकता है. Latitude 19.876 और longitude 75.343 हों तो वह Sambhaji Nagar में बैठता है.
First look at the data (before, then after):
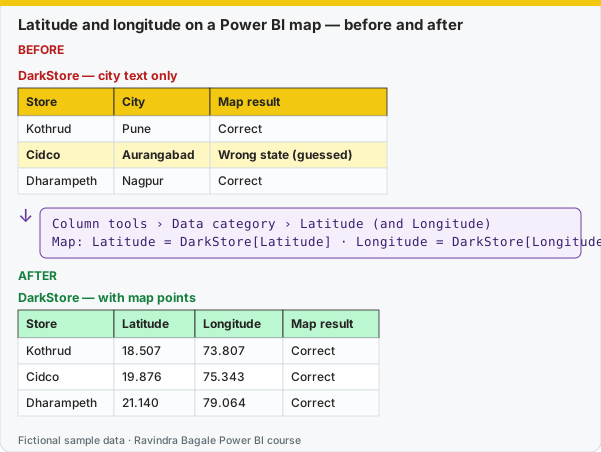
Same before / after tables as text
Before — DarkStore — city text only
| Store | City | Map result |
|---|---|---|
| Kothrud | Pune | Correct |
| Cidco | Aurangabad | Wrong state (guessed) |
| Dharampeth | Nagpur | Correct |
Formula / click path
Column tools › Data category › Latitude (and Longitude)
Map: Latitude = DarkStore[Latitude] · Longitude = DarkStore[Longitude]
After — DarkStore — with map points
| Store | Latitude | Longitude | Map result |
|---|---|---|---|
| Kothrud | 18.507 | 73.807 | Correct |
| Cidco | 19.876 | 75.343 | Correct |
| Dharampeth | 21.140 | 79.064 | Correct |
Do it step by step:
- Add Latitude and Longitude columns to DarkStore as decimal numbers.
- Select DarkStore[Latitude]. In Column tools, set Data category = Latitude.
- Select Longitude. Set Data category = Longitude. Set both to Don't summarize.
- Add a Map visual. Drag Latitude and Longitude to their wells.
- Drag [Total Orders] to Bubble size.
- Check that every dot is inside Maharashtra.
एक-एक step करून बघा:
- DarkStore मध्ये Latitude आणि Longitude columns decimal numbers म्हणून जोडा.
- DarkStore[Latitude] निवडा. Column tools मध्ये Data category = Latitude set करा.
- Longitude निवडा. Data category = Longitude set करा. दोन्ही Don't summarize वर ठेवा.
- एक Map visual टाका. Latitude आणि Longitude त्यांच्या wells मध्ये ओढा.
- [Total Orders] ओढून Bubble size वर टाका.
- प्रत्येक dot Maharashtra च्या आत आहे ना ते तपासा.
एक-एक step करके देखिए:
- DarkStore में Latitude और Longitude columns decimal numbers के रूप में जोड़िए.
- DarkStore[Latitude] चुनिए. Column tools में Data category = Latitude set कीजिए.
- Longitude चुनिए. Data category = Longitude set कीजिए. दोनों को Don't summarize पर रखिए.
- एक Map visual लगाइए. Latitude और Longitude उनके wells में खींचिए.
- [Total Orders] को खींचकर Bubble size पर डालिए.
- हर dot Maharashtra के अंदर है या नहीं, जाँचिए.
The most accurate way is to store coordinates for each dark store. Get them from the store master data or a maps application (right-click the location). Always keep decimal degrees with enough precision (4–6 decimals).
| Store ID | Store Name | Area | City | Latitude | Longitude |
|---|---|---|---|---|---|
| BLK-PUN-KOT-01 | Blinkit Kothrud Hub | Kothrud | Pune | 18.507 | 73.807 |
| BLK-PUN-HIN-01 | Blinkit Hinjewadi Hub | Hinjewadi | Pune | 18.591 | 73.738 |
| BLK-NGP-DHP-01 | Blinkit Dharampeth Hub | Dharampeth | Nagpur | 21.139 | 79.063 |
| BLK-NSK-CRD-01 | Blinkit College Road Hub | College Road | Nashik | 20.007 | 73.763 |
| BLK-KOP-RJP-01 | Blinkit Rajarampuri Hub | Rajarampuri | Kolhapur | 16.699 | 74.237 |
| BLK-MUM-ADH-01 | Blinkit Andheri East Hub | Andheri East | Mumbai | 19.114 | 72.870 |
| BLK-SAM-CID-01 | Blinkit CIDCO Hub | CIDCO | Sambhaji Nagar | 19.877 | 75.365 |
(Approximate, rounded coordinates of the areas, for practice only. The stores are fictional.)
Latitude vs longitude
Maharashtra is at about 15.6° to 22° North latitude and 72.6° to 80.9° East longitude (रेखांश). If your bubbles appear in the ocean or in another country, you have probably swapped the two columns, or the values were read as text.
Ravindra Bagale's Tip
Friends, many students store latitude and longitude as text, or rounded to two decimals, so bubbles stack up or land about a kilometre away. Keep them as decimal numbers with four to six decimal places and set the data categories Latitude and Longitude. Practise, and it will feel very easy.
Ravindra Bagale's Tip – मराठी
मित्रांनो, बरेच students latitude आणि longitude text म्हणून, किंवा दोन decimals पर्यंत round करून साठवतात, त्यामुळे bubbles एकावर एक येतात किंवा साधारण एक किलोमीटर दूर पडतात. त्या चार ते सहा decimal places असलेल्या decimal numbers म्हणून ठेवा आणि Latitude आणि Longitude data categories set करा. Practice करा, मग एकदम सोपं वाटेल.
Ravindra Bagale's Tip – हिंदी
दोस्तों, बहुत से students latitude और longitude को text के रूप में, या दो decimals तक round करके रखते हैं, जिससे bubbles एक के ऊपर एक आ जाते हैं या लगभग एक किलोमीटर दूर गिरते हैं. इन्हें चार से छह decimal places वाले decimal numbers रखो और Latitude और Longitude data categories set करो. Practice करो, फिर बहुत आसान लगेगा.
Fix common mistakes
| Wrong result | Reason | Correction |
|---|---|---|
| All stores stacked at one point | Latitude/Longitude summed (Sum of Latitude) | Set Don't summarize, or use Average |
| Bubbles in the sea | Latitude and Longitude swapped | Latitude is ~16–21 for Maharashtra, Longitude ~73–80 |
| Bubble size equal for all | No relationship to Orders | Create the Stores, then Orders relationship |
Practise independently
Practice task
Which two stores are in Nashik and what are their bubble values?
Hints
- Latitude about 20.0.
Solution
Gangapur ₹300 and College Road ₹500.
Think like a professional
Coordinates are master data. Keep them in a store dimension owned by operations, not typed into a report.
 Revision card