5. Web Data, APIs and Google Sheets
5.4 JSON APIs with Web.Contents and Json.Document
Start with a problem
The ops team gives Shahrukh a JSON endpoint of dark stores with latitude and longitude. Power Query shows a Record, and he does not know what to click.
Explain simply
Json.Document turns JSON into records and lists. Click the list, convert To Table, expand the record fields, and set types.
Show the data
web_darkstores.json (shortened):
| storeId | area | city | lat | lng |
|---|---|---|---|---|
| S01 | Kothrud | Pune | 18.5074 | 73.8077 |
| S02 | Baner | Pune | 18.5590 | 73.7868 |
| S03 | Gangapur | Nashik | 20.0110 | 73.7650 |
| S04 | College Road | Nashik | 20.0059 | 73.7629 |
| S05 | Rajarampuri | Kolhapur | 16.6950 | 74.2430 |
About this data: This table uses columns: storeId, area, city, lat, lng. This table uses columns: Preview. This table uses columns: Column1. Values shown are the lesson examples already on this page (not a new dataset).
Fictional sample data. Practice file: web_darkstores.json (source: src/practice/).
Demonstrate
-
Get data › Web › paste the link to web_darkstores.json › Anonymous.
Your result should look like this:
Preview Record: source = fictional practice API, stores = List -
Click List next to
stores› List Tools › Transform › To Table › OK.Your result should look like this:
Column1 5 Record values -
Expand Column1 › tick all fields › untick Use original column name as prefix.
Your result should look like this:
Columns storeId, area, city, lat, lng (5 rows) -
Set lat and lng to Decimal Number; later set Data category Latitude/Longitude (Module 15).
- For a real API with a key, use the connector's Web API credential, not a key pasted into the URL.
Show the result
Your result should look like this (fictional sample):
| city | Stores |
|---|---|
| Pune | 2 |
| Nashik | 2 |
| Kolhapur | 1 |
| Total | 5 |
Explain what happened
The JSON root was a record with a stores list of 5 records. To Table plus Expand turned each record into a row and each field into a column.
Explore further
Table.FromRecords(Source[stores])does the same in one M step.
Detailed reference for this lesson:
Many systems (courier tracking, weather, internal order services) offer REST APIs that return JSON. Here is a fictional internal endpoint that returns dark stores:
{ "stores": [
    { "storeId": "BLK-PUN-KOT-01", "area": "Kothrud",    "city": "Pune",   "lat": 18.507, "lng": 73.807 },
    { "storeId": "BLK-NGP-DHP-01", "area": "Dharampeth", "city": "Nagpur", "lat": 21.139, "lng": 79.063 } ] }
Steps in Power BI
- Get data › Web › Advanced › URL parts
https://api.example.com/andv1/darkstores› add a headerAccept=application/json› OK. - Choose the authentication the API needs. Anonymous for public APIs, or Web API (key) / Basic / Organizational account as documented by the provider.
- Power Query shows a Record. Click the List next to
stores› List Tools › Transform › To Table › OK. - Click the expand icon on Column1 › tick all fields › untick Use original column name as prefix › OK.
- Set types (lat/lng as Decimal Number) and set the Data category to Latitude/Longitude later in the model (Module 15).
let
    Source  = Json.Document(Web.Contents("https://api.example.com",
                 [RelativePath = "v1/darkstores", Headers = [Accept = "application/json"]])),
    Stores  = Table.FromRecords(Source[stores]),
    Typed   = Table.TransformColumnTypes(Stores, {{"lat", type number}, {"lng", type number}})
in
    Typed
Never paste secret API keys into a shared query
Anyone who opens the .pbix or Advanced Editor can read them. Use the connector's credential dialog (for example Web API key) so the key is stored in Power BI's credential store, or ask your admin for the approved method.
Practice task
Using any free public JSON API that allows anonymous use (read its terms first), load one list of records, turn it into a table and set the data types.
Ravindra Bagale's Tip
Many new learners expand every JSON record and list field, creating hundreds of columns. Expand only the fields you need and set data types immediately. Check the API's page size and rate limits before looping through many pages. Don't worry – after doing it two or three times, it becomes a habit.
Ravindra Bagale's Tip – मराठी
नवीन शिकणारे बरेच students प्रत्येक JSON record आणि list field expand करतात आणि शेकडो columns तयार होतात. फक्त लागणारे fields expand करा आणि लगेच data types set करा. अनेक pages वर loop करण्याआधी API चा page size आणि rate limits चेक करा. घाबरू नका, दोन-तीन वेळा केलं की सवय होते.
Ravindra Bagale's Tip – हिंदी
नए सीखने वाले बहुत से students हर JSON record और list field को expand कर देते हैं और सैकड़ों columns बन जाते हैं. सिर्फ़ ज़रूरी fields expand करो और तुरंत data types set करो. कई pages पर loop करने से पहले API का page size और rate limits check करो. घबराओ मत, दो-तीन बार करने पर आदत हो जाती है.
Fix common mistakes
| Wrong result | Reason | Correction |
|---|---|---|
| Hundreds of columns | Expanded every nested field | Expand only needed fields |
| lat/lng summed on a card | Numeric fields default to Sum | Summarize by None; set data category |
| API key visible in Advanced Editor | Key pasted into the query | Use the credential dialog |
Practise independently
Practice task
Which store is furthest south (smallest latitude)?
Hints
- Compare lat values.
Solution
Rajarampuri, Kolhapur (16.6950).
Think like a professional
Read the API's documentation for paging, limits and terms before connecting a scheduled report to it.
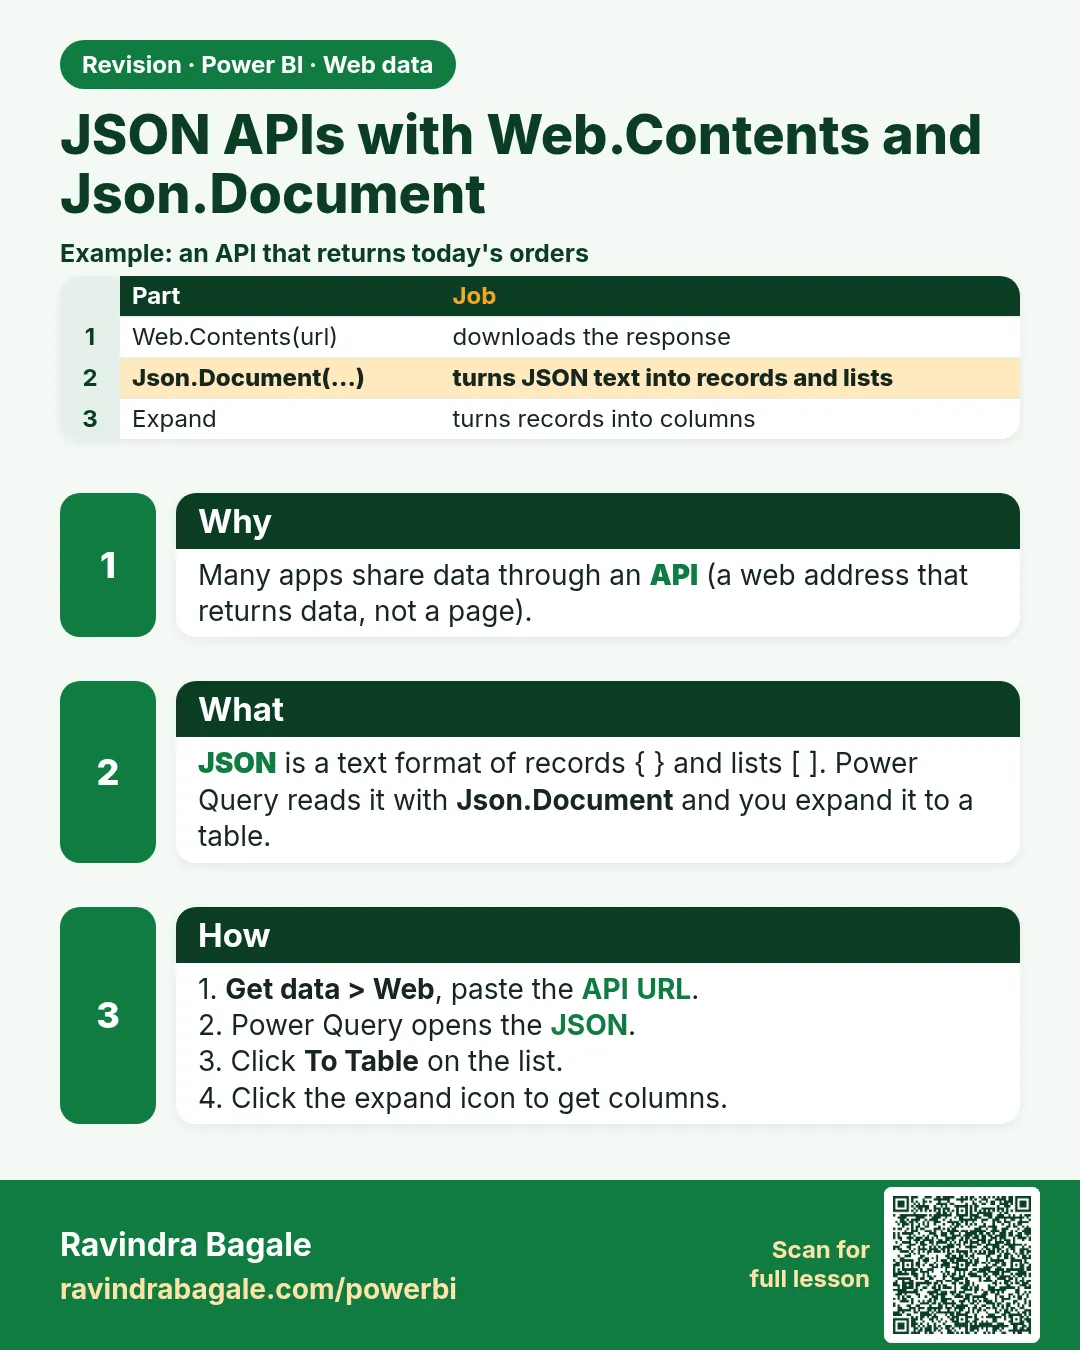 Revision card
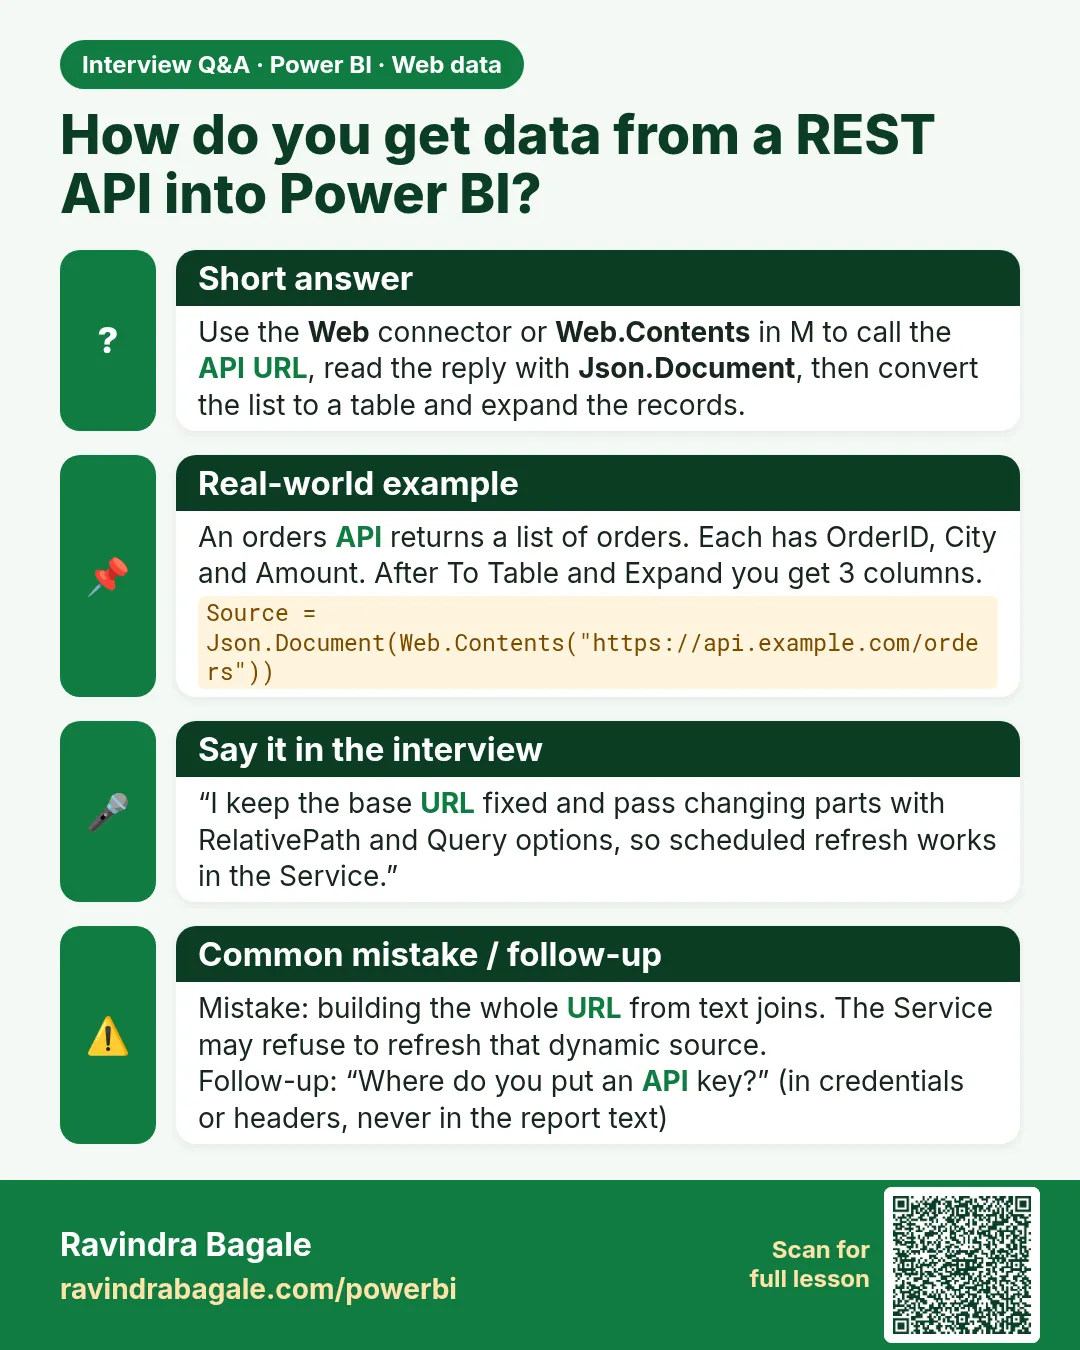 Interview card
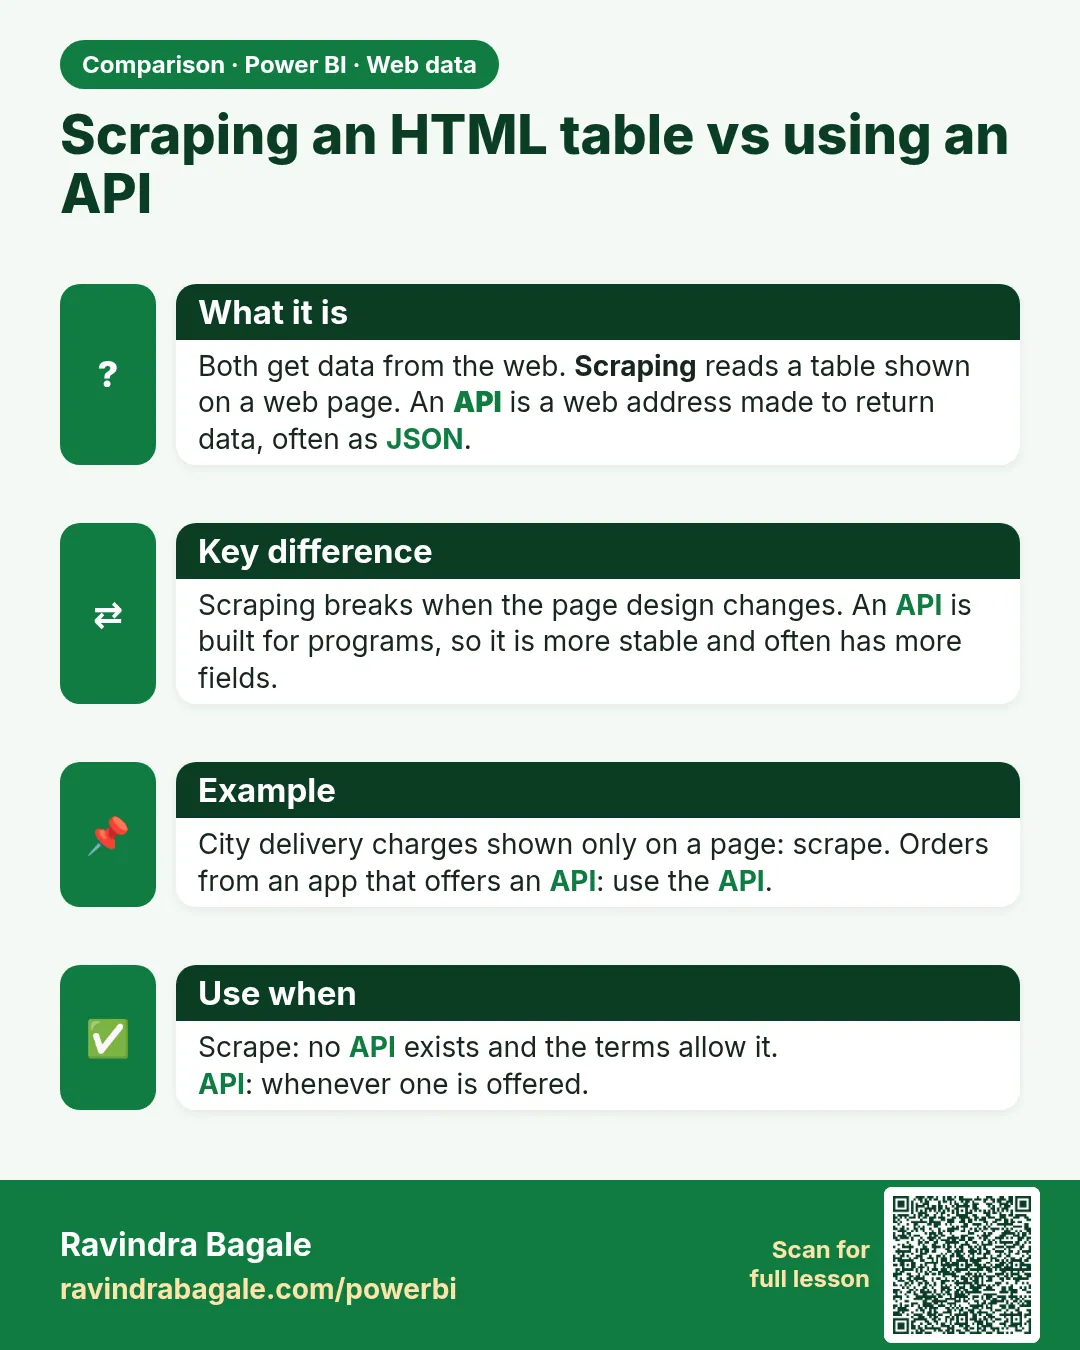 Comparison card