3.2 Common Connectors
Start with a problem
Raja receives three things on Monday: an Excel workbook of targets, a CSV of orders with ₹ symbols and Marathi product names, and a request to add a small mapping table by hand.
Explain simply
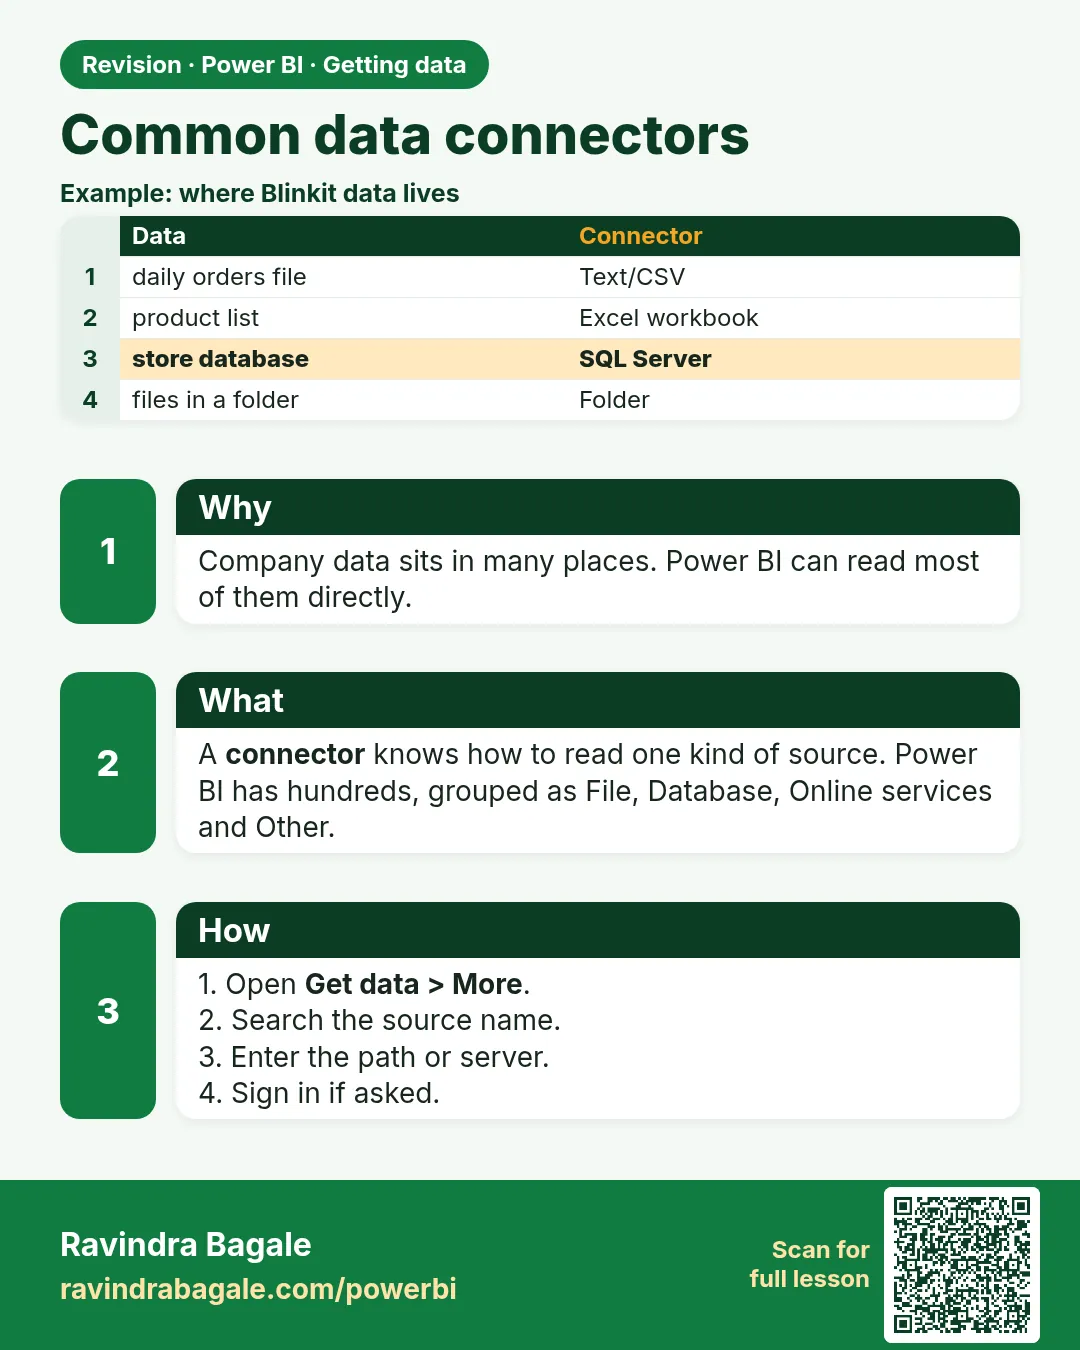
Pick the connector that matches the source: Excel workbook (prefer formatted Tables), Text/CSV (check delimiter and UTF-8 encoding), databases (Module 4), Web/Google Sheets (Module 5), Folder (Module 9) and Enter data for small typed tables.
Show the data
monthly_targets_fy2026_27.csv:
| Month | FY | Quarter | Target (₹) |
|---|---|---|---|
| 2026-04 | FY 2026-27 | Q1 | 1,000 |
| 2026-05 | FY 2026-27 | Q1 | 1,100 |
About this data: This table uses columns: Month, FY, Quarter, Target (₹). This table uses columns: Preview. This table uses columns: Targets. Values shown are the lesson examples already on this page (not a new dataset).
Fictional sample data. Practice file: visuals_orders_apr_may_2026.csv, monthly_targets_fy2026_27.csv (source: src/practice/).
Demonstrate
-
Get data › Text/CSV › visuals_orders_apr_may_2026.csv › File origin 65001: Unicode (UTF-8), Delimiter Comma › Transform Data.
Your result should look like this:
Preview 8 rows; ₹ and Devanagari text (if any) display correctly -
Get data › Text/CSV › monthly_targets_fy2026_27.csv (or the Excel version formatted as a Table with Ctrl+T) › Transform Data.
Your result should look like this:
Targets 2 rows: Apr 1,000; May 1,100 -
Home › Enter data › type Status / Is Revenue: Delivered TRUE, Cancelled FALSE › name
StatusMap› Load.Your result should look like this:
StatusMap 2 rows -
Close & Apply and build a table: Month (from Order Date) with Total Sales and Target.
Show the result
Your result should look like this (fictional sample):
| Month | Total Sales (₹) | Target (₹) | Achievement |
|---|---|---|---|
| Apr-2026 | 900 | 1,000 | 90.0% |
| May-2026 | 1,200 | 1,100 | 109.1% |
| Total | 2,100 | 2,100 | 100.0% |
Explain what happened
Each source used its own connector. The CSV needed the right encoding; the targets came from a clean Table; the small StatusMap was typed with Enter data. April: 400 + 200 + 300 = 900; May: 150 + 450 + 250 + 350 + 0 = 1,200.
Explore further
- Search the Get data window for a dedicated connector before falling back to Web or ODBC.
Detailed reference for this lesson:
Excel workbook
Get data › Excel workbook › select file › Navigator shows sheets, tables (formatted Excel tables) and named ranges. Prefer formatted tables (Ctrl+T in Excel) – they have clear boundaries and headers, and new rows are picked up reliably.
Text/CSV
Get data › Text/CSV › select the file. Power BI detects the delimiter (comma, tab, semicolon…), file origin/encoding (use 65001: Unicode UTF-8 for Hindi/Marathi text or ₹ symbols) and data type detection (based on the first 200 rows by default).
Databases (SQL Server, MySQL and others)
Get data › SQL Server database (or More… › Database › MySQL database) › enter the server and database › choose Import or DirectQuery › sign in. Module 4 covers databases step by step: authentication (proving who you are to the database), native SQL queries, query folding, MySQL driver setup, DirectQuery vs Live connection (connecting directly to a model that already exists), and gateways.
Web pages, APIs and Google Sheets
Get data › Web reads HTML tables, CSV/JSON files at a URL and REST APIs (a standard way for two programs to exchange data over the web). Get data › More… › Online Services › Google Sheets reads a Google Sheet. Module 5 covers both, including Add table using examples, paginated pages and refresh limits.
Folder and SharePoint folder
Get data › More… › File › Folder combines many files with the same structure (for example monthly Blinkit order CSVs or monthly bank statements). Refresh picks up a new file that is dropped into the folder. Module 9 is a full walkthrough.
SharePoint folder
If files are stored in SharePoint or OneDrive for work, use the SharePoint folder connector (with the site URL) instead of a local folder path. Scheduled refresh in the Service then works without an on-premises data gateway.
Enter data
Home › Enter data lets you type or paste a small table manually – useful for small mapping tables, targets or test data.
Ravindra Bagale's Tip
Friends, many students use the generic Web or ODBC connector when a dedicated connector exists. Search the Get Data window first. A dedicated connector (SQL Server, SharePoint folder, Google Sheets) usually supports better authentication, query folding and refresh. Never forget this.
Ravindra Bagale's Tip – मराठी
मित्रांनो, dedicated connector असताना बरेच students generic Web किंवा ODBC connector वापरतात. आधी Get Data window मध्ये शोधा. Dedicated connector (SQL Server, SharePoint folder, Google Sheets) साधारणपणे authentication, query folding आणि refresh चांगलं support करतो. हे अजिबात विसरू नका.
Ravindra Bagale's Tip – हिंदी
दोस्तों, dedicated connector मौजूद होने पर भी बहुत से students generic Web या ODBC connector इस्तेमाल करते हैं. पहले Get Data window में search करो. Dedicated connector (SQL Server, SharePoint folder, Google Sheets) आमतौर पर authentication, query folding और refresh को बेहतर support करता है. यह बिल्कुल मत भूलना.
Fix common mistakes
| Wrong result | Reason | Correction |
|---|---|---|
| ₹ shows as ₹ | Wrong file origin (encoding) | Choose 65001: Unicode (UTF-8) |
| Excel columns shift after a colleague adds rows | Loaded a sheet range, not a Table | Format the data as a Table (Ctrl+T) and load the Table |
| All columns in one column | Wrong delimiter | Pick Comma (or the real delimiter) |
Practise independently
Practice task
Add a June target of ₹1,200 with Enter data or to the targets file. With no June orders yet, what is the FY-to-date achievement?
Hints
- Targets become 1,000 + 1,100 + 1,200.
Solution
₹2,100 ÷ ₹3,300 = 63.6%.
Think like a professional
Ask for data in a stable form (an Excel Table, a UTF-8 CSV, a view) instead of fixing a messy export every month.
 Revision card