Ravi Sir's Cards › Classroom chapters
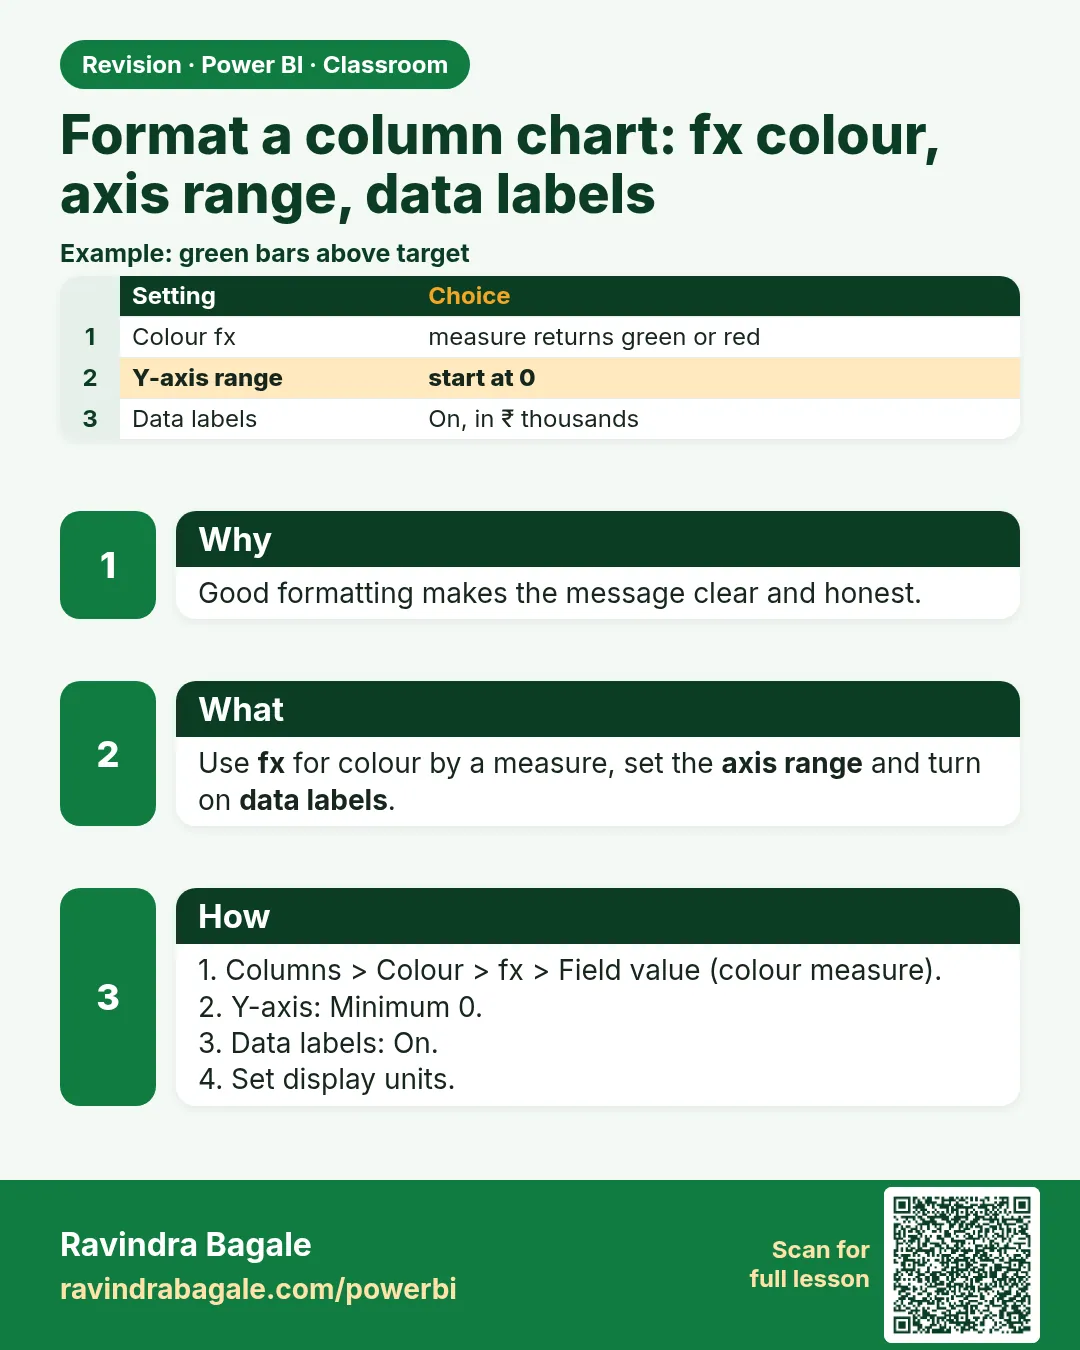
Format a column chart: fx colour, axis range, data labels
Format a column chart: fx colour, axis range, data labels. Good formatting makes the message clear and honest.
Lesson: How to Format a Column Chart in Power BI: Conditional Color with fx, Axis Range and Data Labels · मराठी card