32. Keyboard Shortcuts and DAX Cheat Sheet
32.3 Common Measure Patterns (Copy & Adapt)
Total Orders    = DISTINCTCOUNT(Orders[Order ID])
AOV             = DIVIDE([Total Sales], [Delivered Orders])
Cancel Rate     = DIVIDE([Cancelled Orders], [Total Orders])
Avg Deliv Mins  = AVERAGEX(VALUES(Orders[Order ID]),
                      CALCULATE(MAX(Orders[Delivery Time Mins])))
% Under 10 Mins = DIVIDE(CALCULATE([Delivered Orders],
                      Orders[Delivery Time Mins] <= 10), [Delivered Orders])
% of Total      = DIVIDE([Total Sales], CALCULATE([Total Sales], ALL(Product)))
Sales LY        = CALCULATE([Total Sales], SAMEPERIODLASTYEAR('Date'[Date]))
YoY %           = DIVIDE([Total Sales] - [Sales LY], [Sales LY])
Sales YTD       = TOTALYTD([Total Sales], 'Date'[Date])
Running Total   = CALCULATE([Total Sales],
                      FILTER(ALL('Date'[Date]), 'Date'[Date] <= MAX('Date'[Date])))
Rolling 12M     = CALCULATE([Total Sales],
                      DATESINPERIOD('Date'[Date], MAX('Date'[Date]), -12, MONTH))
Rank            = RANKX(ALL(Product[Product Name]), [Total Sales], , DESC, DENSE)
Top 5 Sales     = CALCULATE([Total Sales], TOPN(5, ALL(Product[Product Name]), [Total Sales]))
Selected Item   = SELECTEDVALUE(DarkStore[City], "All Cities")
Delivered Sales = CALCULATE([Total Sales],
                      USERELATIONSHIP(Orders[Delivered Date], 'Date'[Date]))
Ravindra Bagale's Tip
Friends, many students copy a measure pattern and forget to change the table and column names to match their model. After pasting, read every reference and replace it, then test the measure with a slicer before using it in the report. This matters for both exams and interviews.
Ravindra Bagale's Tip – मराठी
मित्रांनो, बरेच students measure pattern copy करतात आणि त्यांच्या model नुसार table आणि column names बदलायला विसरतात. Paste केल्यानंतर प्रत्येक reference वाचा आणि बदला, मग report मध्ये वापरण्याआधी slicer सोबत measure test करा. हे exam आणि interview दोन्हीसाठी important आहे.
Ravindra Bagale's Tip – हिंदी
दोस्तों, बहुत से students measure pattern copy करते हैं और अपने model के हिसाब से table और column names बदलना भूल जाते हैं. Paste करने के बाद हर reference पढ़ो और बदलो, फिर report में इस्तेमाल करने से पहले slicer के साथ measure test करो. यह exam और interview दोनों के लिए ज़रूरी है.
Thodkyaat sangaycha tar (quick recap)
Make a habit of the few shortcuts you use every day, and after copying a pattern, change the table and column names to match your model. Finally, the glossary.
रोज वापरणार ते थोडेच shortcuts सवयीत आणा, आणि pattern copy केल्यावर table आणि column ची नावं तुमच्या model प्रमाणे बदला. आता शेवटी glossary.
रोज़ इस्तेमाल होने वाले थोड़े से shortcuts आदत में लाइए, और pattern copy करने के बाद table और column के नाम अपने model के हिसाब से बदलिए. अब आख़िर में glossary.
Deepen this topic (Why / What / How)
Fictional Maharashtra practice. Shortcut lists can differ by Desktop version — verify in your build.
Why: Blank-page syndrome wastes time when the pattern already exists.
What: Copy-adapt patterns: totals, ratios, YTD, previous period, % of total — always on a Date table + star schema.
How — adapt patterns safely:
Vertical steps (one under another)
- Copy a pattern into a measures table — rename to business words.
- Replace table/column names to your model (FactOrders, DimDate).
- Verify against a known Excel total for one city/day (fictional data OK).
- Avoid copy-paste of time intel without Mark as Date table.
- Advance with Ch 47 time intel and Ch 48 calc groups / field parameters.
Tiny example: Fictional: [Orders YTD] using datesYTD on DimDate[Date] after marking Date table.
Ravindra Bagale's Tip
Friends, adapt means change names and test — not paste blindly into production.
Ravindra Bagale's Tip – मराठी
मित्रांनो, adapt = नावे बदला + test; अंधपणे paste नका.
Ravindra Bagale's Tip – हिंदी
दोस्तों, adapt = नाम बदलो + test; अंधाधुंध paste मत करो।
Core patterns to keep on a card
Vertical points
- Base total: [Delivered Orders] = COUNTROWS(FactOrders) or SUM of units.
- Safe ratio: [AOV] = DIVIDE([Revenue],[Delivered Orders]).
- % of total: DIVIDE([Revenue], CALCULATE([Revenue], ALL(DimCity))).
- Previous period: CALCULATE([Revenue], DATEADD(DimDate[Date], -1, MONTH)) — needs Date table.
- Status flag measure for conditional formatting (IF threshold).
When patterns break
Vertical points
- Wrong grain, then totals explode; revisit relationships (Ch 11).
- Missing Date table, then time intel lies.
- Implicit measures hide in visuals — prefer explicit measures.
- Performance: heavy iterators on large facts — see Ch 49.
- Interview: explain pattern in Why/What/How, not only paste DAX.
Worked pattern board
Why: Interviews ask for % of total and previous period constantly.
What: Two patterns with easy English commentary.
How — copy, rename, test:
Vertical steps
- Create [% of City Revenue] using DIVIDE + CALCULATE + ALL(DimCity).
- Create [Revenue PM] with DATEADD -1 MONTH on DimDate[Date].
- Put both on a matrix: City × Month.
- Explain aloud: filter context removed for city total; date shifted for PM.
- If numbers look wild, check relationships and Date table mark first.
[% of City Revenue] =
DIVIDE (
    [Revenue],
    CALCULATE ( [Revenue], ALL ( DimCity ) )
)

[Revenue PM] =
CALCULATE (
    [Revenue],
    DATEADD ( DimDate[Date], -1, MONTH )
)
Ravindra Bagale's Tip
Friends, if you cannot explain ALL() in one sentence, do not ship the % measure yet.
Ravindra Bagale's Tip – मराठी
मित्रांनो, ALL() एका वाक्यात समजवत नसाल तर % measure ship करू नका.
Ravindra Bagale's Tip – हिंदी
दोस्तों, ALL() एक वाक्य में नहीं समझा सकते तो % measure मत भेजो।
Quiz (5 questions)
1. Adapt a pattern means:
2. % of total often uses:
3. Time intel patterns deepen in:
4. Patterns break when grain is wrong:
5. Prefer measures that are:
Practice tasks (12) — hints only, no full answers
- Task. Adapt a YTD pattern on a marked Date table.
Hint: Verify month totals. - Task. Build % of total by City.
Hint: ALL(DimCity). - Task. Build previous month revenue pattern.
Hint: DATEADD -1 MONTH. - Task. Create a measures table and move patterns there.
Hint: Hide helper table columns. - Task. Compare your pattern result to an Excel pivot (fictional).
Hint: Within rounding. - Task. Break a pattern on purpose (wrong relationship) and observe.
Hint: Then fix. - Task. Write interview lines for three patterns.
Hint: Why/What/How. - Task. Add a status measure for conditional formatting.
Hint: IF threshold. - Task. Link one pattern to Ch 47 time intel.
Hint: One sentence. - Task. Link iterators need to Ch 46.
Hint: When SUM is not enough. - Task. Card-revise patterns without opening Desktop.
Hint: Use Ravi Sir cards. - Task. Refactor calc1/calc2 names to business words.
Hint: Kindness to future-you.
Loading DAX practice tasks...
- Sell Through (Medium): Shown per Warehouses Name. Measure: Sell Through = SUM of UnitsOut ÷ SUM of UnitsIn.
- Share of UnitsIn (Medium): Shown per Warehouses Name. Measure: UnitsIn Share = SUM of UnitsIn ÷ SUM of UnitsIn for all of Warehouses.
- UnitsIn for Electronics only (Medium): Shown per City. Measure: UnitsIn Electronics = SUM of UnitsIn where ItemGroup is "Electronics".
- Sell Through against target (Hard): Shown per Warehouses Name. Measure: Sell Through Status = "On target" when Sell Through is >= 0.8, else "Check".
- Top 3 only (Hard): Shown per Warehouses Name. Measure: Top 3 UnitsIn = [Units Received] when the rank is 3 or better, else blank.
- UnitsIn of the top 2 (Hard): Measure: Top 2 UnitsIn = [Units Received] for the 2 best Warehouses names.
- UnitsIn in the first half-year (Medium): Shown per Country. Measure: H1 UnitsIn = SUM of UnitsIn for CountDate before 1 Oct 2025.
- Average UnitsIn per row (Medium): Shown per Warehouses Name. Measure: UnitsIn per Row = SUM of UnitsIn ÷ number of rows.
- Rows with high stock-out days (Medium): Shown per Country. Measure: High StockoutDays Rows = number of rows where StockoutDays is more than 5.
- Sell Through for Electronics (Hard): Shown per Country. Measure: Sell Through Electronics = Sell Through where ItemGroup is "Electronics".
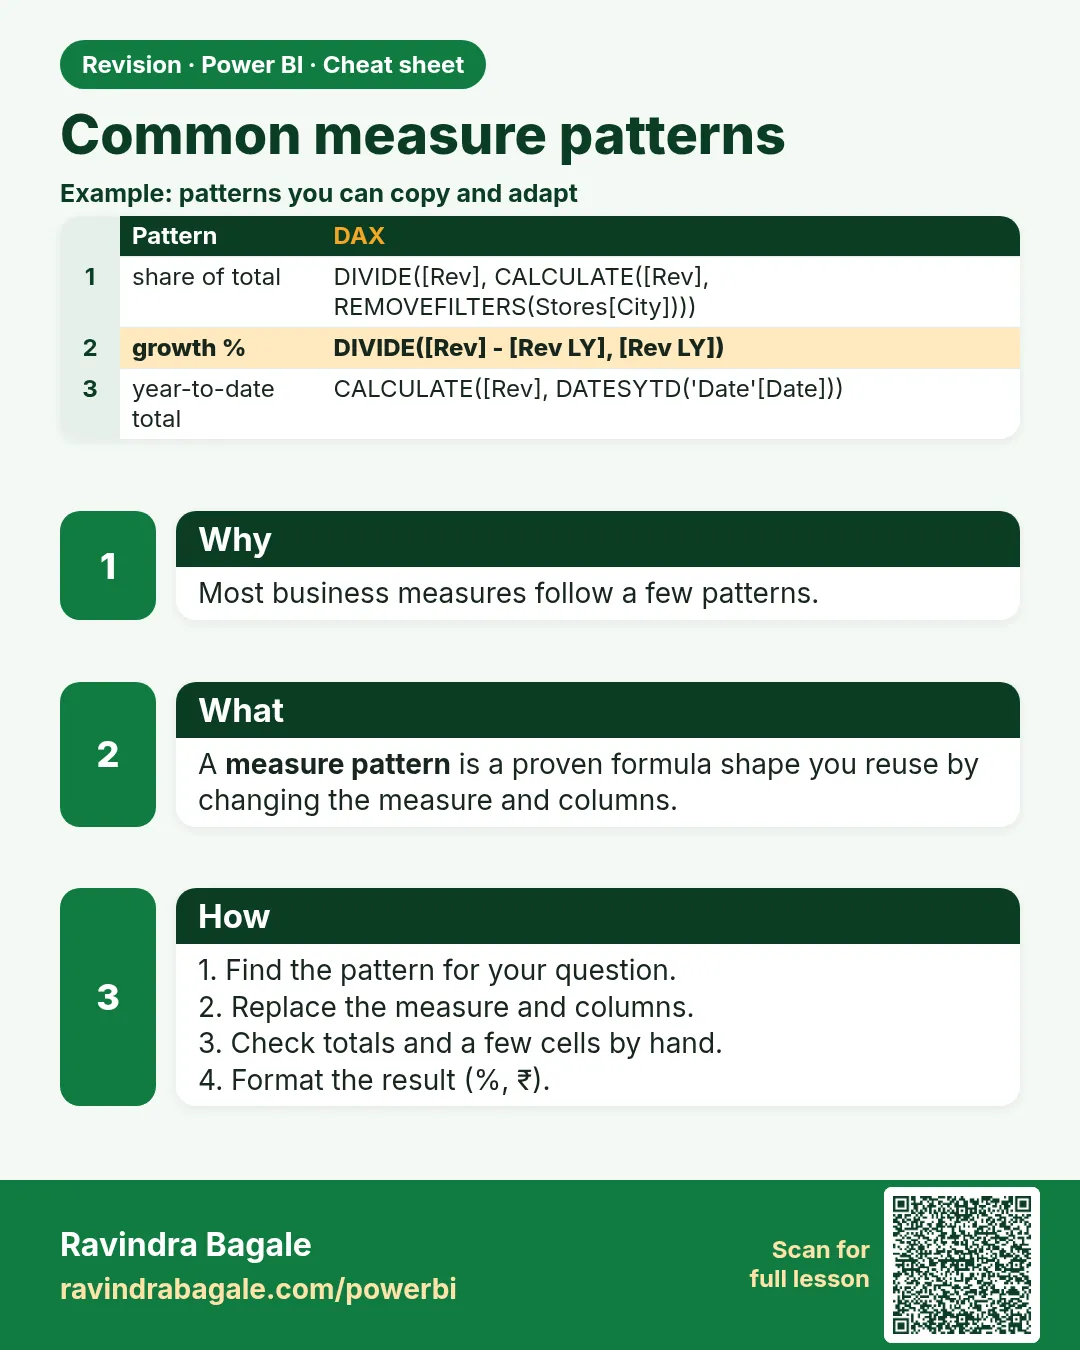 Revision card