Labs · Power BI
Lab: Speed Drill – Rebuild the First Bar-Chart Lab Using Keyboard Shortcuts
Course: Power BI · Chapter 32: Keyboard Shortcuts and DAX Cheat Sheet
Chapter 32 is a shortcuts and DAX cheat sheet; this lab turns the most useful shortcuts into muscle memory.
Chala mitrano! Shortcuts are not learnt by reading a list; they are learnt by using them ten times. Today we rebuild our very first chart twice, once with the mouse and once with the keyboard, and time both. The keyboard also matters for accessibility: some users cannot use a mouse at all. Haat keyboard var, dola screen var!
चला मित्रांनो! Shortcuts list वाचून शिकता येत नाहीत; ते दहा वेळा वापरून शिकतात. आज आपला पहिलाच chart दोनदा बनवू, एकदा mouse ने आणि एकदा keyboard ने, आणि दोन्हीचा वेळ मोजू. Accessibility साठीही keyboard महत्त्वाचा आहे: काही users mouse वापरूच शकत नाहीत. हात keyboard वर, डोळे screen वर!
चलो दोस्तों! Shortcuts list पढ़कर नहीं सीखे जाते; दस बार इस्तेमाल करके सीखे जाते हैं। आज अपना पहला chart दो बार बनाएंगे, एक बार mouse से और एक बार keyboard से, और दोनों का समय नापेंगे। Accessibility के लिए भी keyboard ज़रूरी है: कुछ users mouse इस्तेमाल ही नहीं कर सकते। हाथ keyboard पर, आँखें screen पर!
Suppose we are…
Suppose we are a Power BI analyst at Infosys and our team lead says: "You spend half your day hunting with the mouse. Learn ten shortcuts this week." We will practise on the smallest report we know: the Flipkart-style city sales bar chart from Lab C (12 rows, sample data made up for practice).
Goal of this lab
- Round 1: rebuild Lab C with the mouse only, and time it.
- Round 2: rebuild it keyboard-first, and time it.
- Use at least 8 shortcuts, including 3 in the DAX formula bar.
- Make your own shortcut card with the ones you will keep using.
What you need (all free)
- Power BI Desktop and a stopwatch (your phone).
- Download city_sales.csv (12 rows) saved in
Documents\PowerBI-Labs. - 30 minutes.
The data: before and after
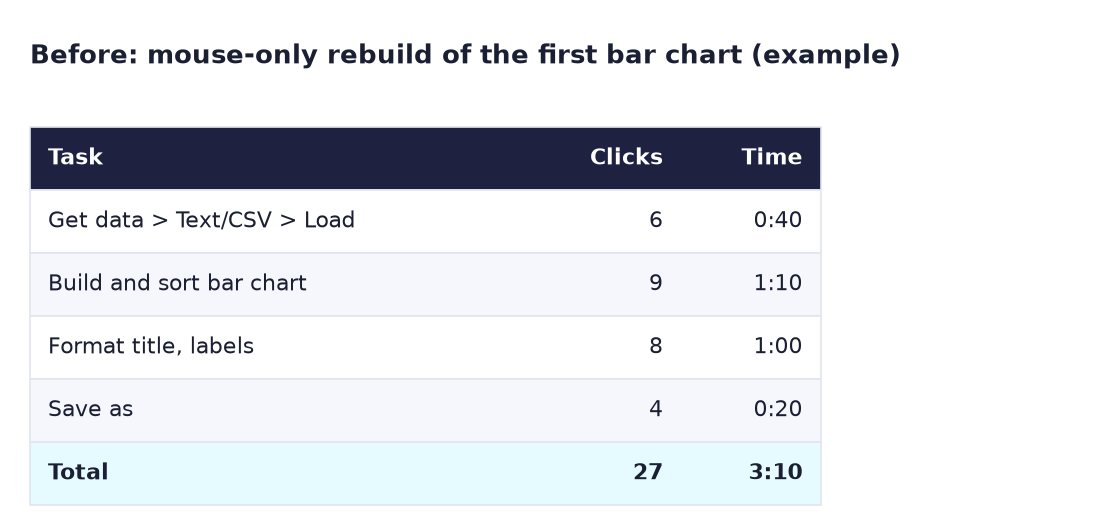
Before. An example mouse-only rebuild: 27 clicks and about 3 minutes.
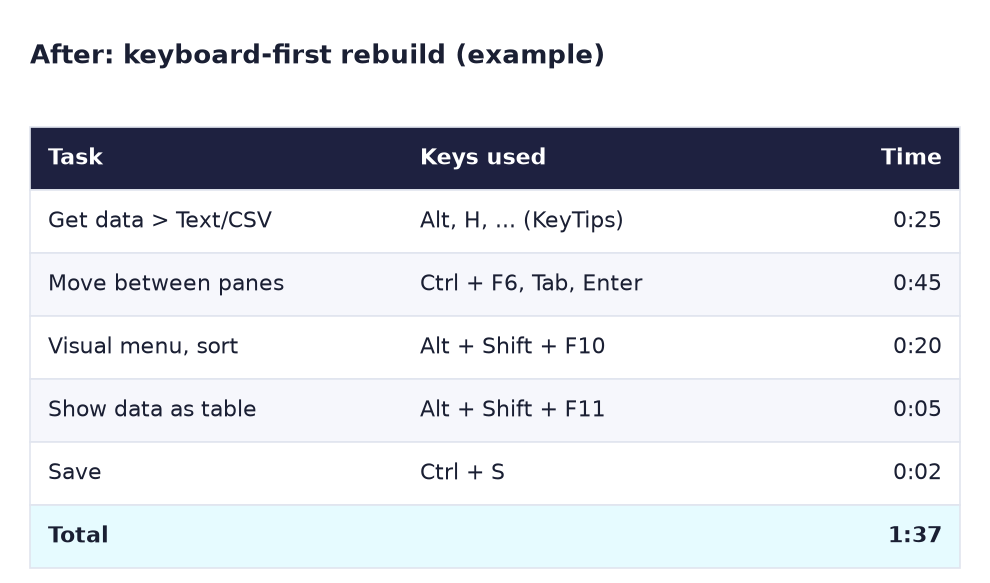
After. An example keyboard-first rebuild: about half the time. Your times will differ; what matters is that round 2 gets faster with practice.
The formula
The shortcuts we drill (from Microsoft's official list; press Shift + ? in Power BI Desktop to see it):
| Press | Does this |
|---|---|
| Alt | Shows KeyTips (letters) on the ribbon; press the letter to click |
| Ctrl + F6 | Moves focus between sections (canvas, Visualizations, Data pane, ribbon) |
| Tab / Shift + Tab | Moves forward / back inside a section |
| Enter or Space | Selects (ticks) the focused item |
| Right / Left arrow in the Data pane | Expands / collapses a table |
| Alt + Shift + F10 | Opens the selected visual's menu (… More options) |
| Alt + Shift + F11 | Shows the visual's data as a table |
| Ctrl + S | Saves |
In the DAX formula bar: Ctrl + Space (suggestions), Shift + Enter (new line), Ctrl + / (comment a line), Ctrl + Enter (submit).
And one measure to type in round 2, the Lab D measure:
Mumbai Sales = CALCULATE ( SUM ( city_sales[Sales] ), city_sales[City] = "Mumbai" )
Steps
Round 1: mouse only
- Open a blank Power BI Desktop file. Start the stopwatch.
- Repeat Lab C with the mouse: Get data → Text/CSV → city_sales.csv → Load; Clustered bar chart; City on Y-axis, Sales on X-axis; sort descending by Sales; data labels on; Save as
Lab-32-mouse. -
Stop the stopwatch. Write the time down.
What you should see: the Lab C chart: Mumbai 147K, Pune 131K, Nagpur 87K. A typical first time is 2–4 minutes.
Round 2: keyboard first (close the file and open a new blank one)
- Press Shift + ? and look at the shortcut list for 30 seconds. Close it with Esc. Start the stopwatch.
-
Press Alt. Letters appear on the ribbon. Press the letter for the Home tab, then the letter on Get data, then use the arrow keys to reach Text/CSV and press Enter. Type the file name in the Open box and press Enter, then Tab to Load and press Enter.
What you should see: city_sales in the Data pane. The KeyTip letters can differ between versions; read them from the screen, do not memorise them.
-
Press Ctrl + F6 until the focus is on the Visualizations pane. Use Tab/arrows to reach Clustered bar chart and press Enter.
-
Press Ctrl + F6 until the Data pane is focused. Use the arrows to reach city_sales, press Right arrow to expand it, go down to City and press Space, then go to Sales and press Space.
What you should see: the bar chart with City and Sum of Sales. If Power BI places a field in the wrong well, fix it with the mouse and note it on your card: that is fine.
-
With the visual selected, press Alt + Shift + F10 to open its menu, choose Sort axis → Sum of Sales, open it again and choose Sort descending.
- Press Alt + Shift + F11 to show the data as a table: check 147,000 / 131,000 / 87,000. Press Esc (or Alt + Shift + F11 again) to go back.
-
Create the measure: Alt KeyTips → Modeling → New measure. In the formula bar type
Mumbai Sales = CALC, press Ctrl + Space to see suggestions and Tab to accept CALCULATE. Use Shift + Enter to put the filter on a new line, then Ctrl + Enter to submit.What you should see: Mumbai Sales in the Data pane. Put it in a card: 147K.
-
Press Ctrl + S, name the file
Lab-32-keyboardand press Enter. Stop the stopwatch and write the time. - Compare the two times. Then do round 2 once more: the second keyboard round is usually much faster.
- On a sticky note or phone note, write your 8 keepers: the shortcuts you actually used.
Ravindra Bagale's Tip
Do not try to do everything with keys on day one. Mix: keyboard for Save, KeyTips, visual menu and the formula bar; mouse for dragging. Add one new shortcut each week. And Alt+Shift+F11 is gold for checking numbers fast in an interview or demo. Roj ek shortcut, mahinyat expert!
Ravindra Bagale's Tip – मराठी
पहिल्याच दिवशी सगळं keys ने करायचा प्रयत्न करू नका. Mix करा: Save, KeyTips, visual menu आणि formula bar साठी keyboard; dragging साठी mouse. दर आठवड्याला एक नवीन shortcut जोडा. आणि interview किंवा demo मध्ये numbers पटकन check करायला Alt+Shift+F11 सोन्यासारखा आहे. रोज एक shortcut, महिन्यात expert!
Ravindra Bagale's Tip – हिंदी
पहले ही दिन सब कुछ keys से करने की कोशिश मत करो। Mix करो: Save, KeyTips, visual menu और formula bar के लिए keyboard; dragging के लिए mouse। हर हफ्ते एक नया shortcut जोड़ो। और interview या demo में numbers जल्दी check करने के लिए Alt+Shift+F11 सोने जैसा है। रोज़ एक shortcut, महीने में expert!
Common mistakes
| Mistake | What happens | Fix |
|---|---|---|
| Memorising KeyTip letters from a video | Letters differ in your version | Press Alt and read the letters on screen |
| Pressing Alt + Shift + F10 with no visual selected | Nothing happens | Select the visual first (click it or Tab to it on the canvas) |
| Pressing Enter in the formula bar mid-formula | The measure is submitted half-written | Use Shift + Enter for a new line |
| Ctrl + F6 "does nothing" | The focus is inside a dialog | Press Esc first, then Ctrl + F6 |
| Comparing round 1 with your very first keyboard try | Keyboard looks slower | Compare with the second keyboard round |
Self-check checklist
0 of 6 done
Try-at-home challenge
Without the mouse, select the bar chart and move it a little to the right, then make it bigger. Then add a second visual (a card with Mumbai Sales), select both visuals and group them. Which keys did you use?
Check your answer
Select the visual (Tab on the canvas), then use the arrow keys for small moves and Shift + arrow keys for bigger moves (in editing mode). To select both, open the Selection pane with F6, move to the second visual and press Ctrl + Space to add it to the selection. Then press Ctrl + G to group them. Resizing exactly is easier in Format → General → Properties → Size (type the width and height), which also works from the keyboard with Tab.
Samjla ka? Shift + ? shows the list, Alt shows KeyTips, Ctrl + F6 moves between panes, Alt + Shift + F10 opens the visual menu. Aata pudhe jaauya: match 25 Power BI terms to their meanings.