Labs · Power BI
Lab: Add a Profit Column Twice – in Power Query and as a DAX Calculated Column – and Compare
Course: Power BI · Chapter 8: Adding Columns: Power Query Add Column Tab and DAX Calculated Columns
Chapter 8 compares the Add Column tab with DAX calculated columns; this lab builds the same Profit both ways.
Chala mitrano! Profit is just Sales minus Cost. Simple maths. But Power BI gives you three places to write it, and interviewers love to ask "where would you put it, and why?" Today we write it in all three places, put them side by side, and then decide like a professional. Teen jaaga, ek uttar!
चला मित्रांनो! Profit म्हणजे फक्त Sales वजा Cost. साधं गणित. पण Power BI ते लिहायला तीन जागा देतो, आणि interviewers ना विचारायला आवडतं "तुम्ही ते कुठे ठेवाल, आणि का?" आज आपण तिन्ही जागी लिहू, शेजारी शेजारी ठेवू, आणि मग professional सारखा निर्णय घेऊ. तीन जागा, एक उत्तर!
चलो दोस्तों! Profit मतलब बस Sales माइनस Cost। सीधा गणित। लेकिन Power BI इसे लिखने की तीन जगहें देता है, और interviewers को पूछना पसंद है "आप इसे कहाँ रखोगे, और क्यों?" आज हम तीनों जगह लिखेंगे, साथ-साथ रखेंगे, और फिर professional की तरह फैसला करेंगे। तीन जगह, एक जवाब!
Suppose we are…
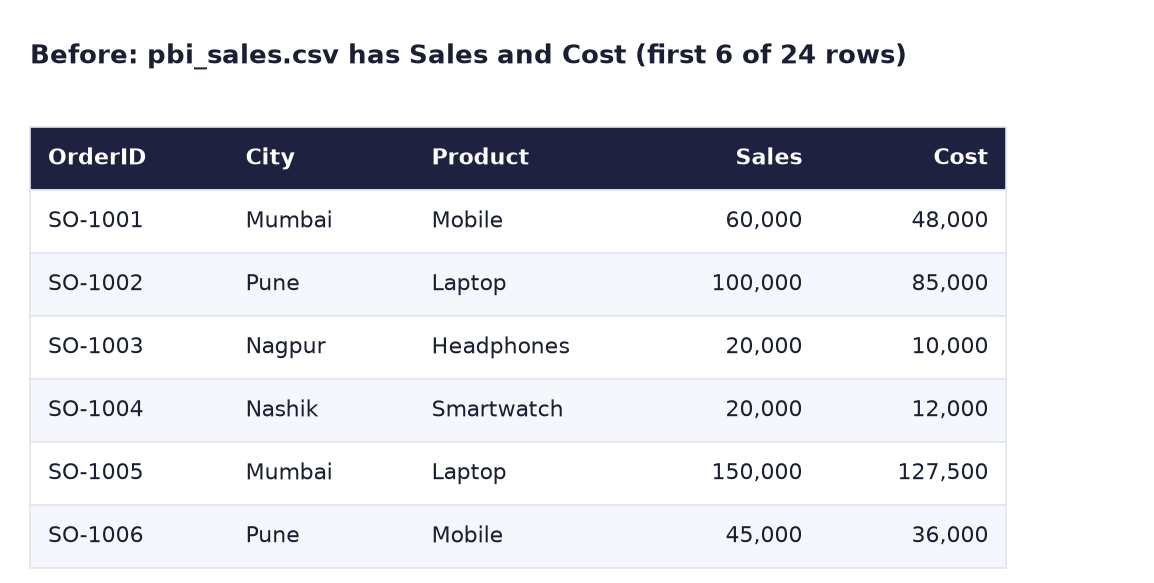
Suppose we are a finance analyst at Croma. Our pbi_sales.csv file has Sales and Cost for 24 orders in four cities, but no Profit. The finance head wants Profit by city and the overall margin. A senior colleague says "add it in Power Query"; another says "just write a DAX column". Who is right? We will try both, plus a measure, and compare.
The numbers are sample data made up for practice.
Goal of this lab
By the end you will have:
- Profit PQ: a custom column made in Power Query.
- Profit DAX: a calculated column made with DAX.
- Profit Measure and Margin %: measures that calculate on the fly.
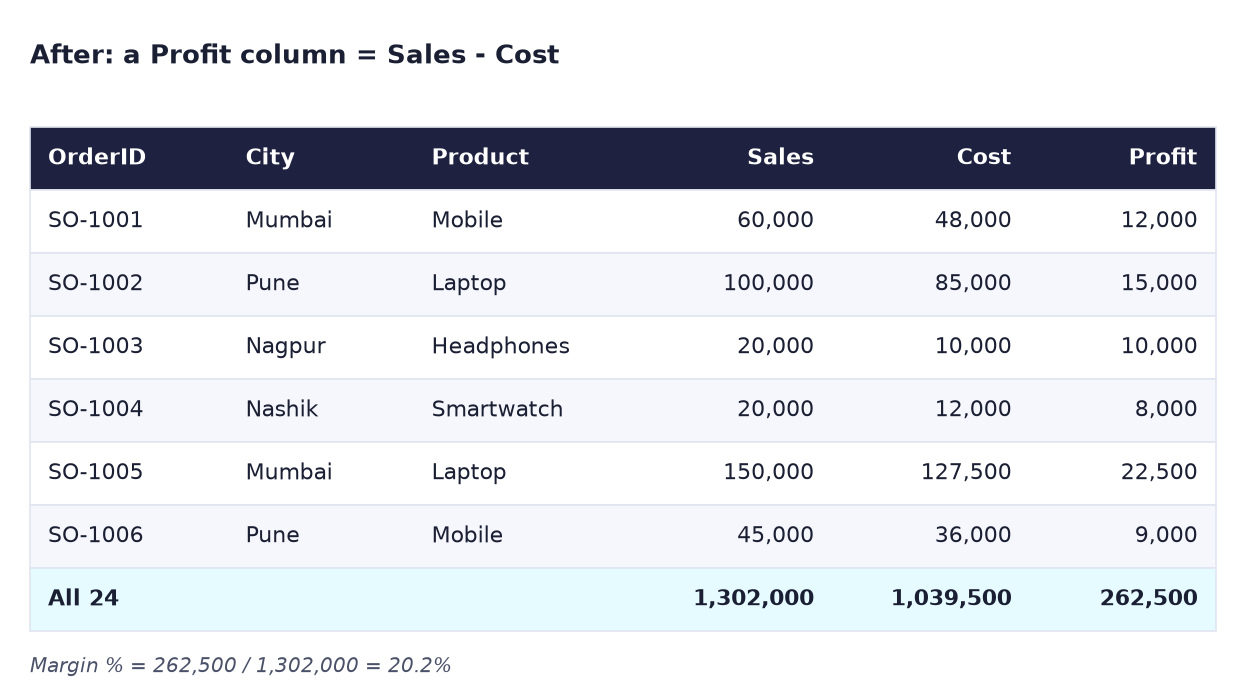
- One table that shows all three agree: total profit 262,500.
What you need (all free)
- Power BI Desktop.
- The file: Download pbi_sales.csv (24 orders)
- 30 minutes.
The data: before and after
Before. Sales and Cost, but no Profit.
After. A Profit column. For all 24 orders: Sales 1,302,000, Cost 1,039,500, Profit 262,500, margin 20.2%.
The formula
The maths is the same everywhere. Only the language and the place change:
Power Query custom column (M):   [Sales] - [Cost]
DAX calculated column:           Profit DAX = pbi_sales[Sales] - pbi_sales[Cost]
DAX measure:                     Profit Measure = SUM ( pbi_sales[Sales] ) - SUM ( pbi_sales[Cost] )
DAX measure for margin:          Margin % = DIVIDE ( [Profit Measure], SUM ( pbi_sales[Sales] ) )
| Power Query column | DAX calculated column | Measure | |
|---|---|---|---|
| When it is calculated | At refresh, before loading | At refresh, after loading | Every time a visual needs it |
| Stored in the file? | Yes, compressed well | Yes, compressed less well | No, only the formula |
| Can use other tables' measures, slicers? | No | No slicers | Yes, reacts to every filter |
| Best for | Row-level values like Profit | When you need DAX-only functions (e.g. RELATED) | Totals and ratios like Margin % |
Rule of thumb: row-level maths goes as early as possible (Power Query), totals and ratios go in measures. A DAX calculated column is the "middle" option you use only when Power Query cannot do it.
Steps
-
Get data → Text/CSV → pbi_sales.csv → Transform Data.
What you should see: 24 rows; Sales and Cost show the 123 (Whole Number) icon.
-
Click Add Column → Custom Column. Name:
Profit PQ. Formula:[Sales] - [Cost](double-click Sales and Cost in the list on the right to insert them). Click OK.What you should see: a new column; SO-1001 shows 12000. Applied Steps has a new step Added Custom.
-
Click the ABC123 icon on the Profit PQ header and choose Whole Number. Then click Home → Close & Apply.
-
Go to Table view, select the pbi_sales table, and click Table tools → New column. Type
Profit DAX = pbi_sales[Sales] - pbi_sales[Cost]and press Enter.What you should see: a column Profit DAX with the same numbers as Profit PQ. In the Data pane its icon has a small fx: that marks a DAX calculated column.
-
Right-click pbi_sales in the Data pane → New measure:
Profit Measure = SUM ( pbi_sales[Sales] ) - SUM ( pbi_sales[Cost] ). Press Enter. - New measure again:
Margin % = DIVIDE ( [Profit Measure], SUM ( pbi_sales[Sales] ) ). On the Measure tools ribbon, click the % button. -
In Report view, make a Table visual with City, Profit PQ, Profit DAX, Profit Measure and Margin %.
What you should see: Mumbai 88,500, Pune 69,000, Nagpur 53,500, Nashik 51,500 in all three Profit columns, Total 262,500, and Margin % 20.16% in the total row.
-
Now look at where each one lives. Open Transform data: Profit PQ is there; Profit DAX and the measures are not, because Power Query runs before DAX. Close the editor without changes.
-
Delete the duplicate: right-click Profit DAX in the Data pane → Delete from model → Yes. Keep Profit PQ and the measures.
What you should see: the table still works; only the Profit DAX column disappears from it.
-
Save as
Lab-08-profit-two-ways.
Ravindra Bagale's Tip
Never make a "Margin %" column. A percentage must be calculated from totals, not added or averaged row by row. Profit can be a column because adding profits is fine. Margin must be a measure: total profit divided by total sales. Percent mhanje measure, he lakshat theva!
Ravindra Bagale's Tip – मराठी
कधीही "Margin %" column बनवू नका. Percentage totals वरून काढायचा असतो, row by row add किंवा average करून नाही. Profit column असू शकतो कारण profits add करणं बरोबर आहे. Margin measure च हवा: total profit भागिले total sales. Percent म्हणजे measure, हे लक्षात ठेवा!
Ravindra Bagale's Tip – हिंदी
कभी भी "Margin %" column मत बनाओ। Percentage totals से निकाला जाता है, row by row जोड़कर या average करके नहीं। Profit column हो सकता है क्योंकि profits जोड़ना सही है। Margin measure ही होना चाहिए: total profit भाग total sales। Percent मतलब measure, यह याद रखो!
Common mistakes
| Mistake | What happens | Fix |
|---|---|---|
| Profit PQ left as type ABC123 (any) | Power BI may not sum it; no Σ sign | Set the type to Whole Number in Power Query |
Writing Sales - Cost without brackets in Power Query |
"The name 'Sales' wasn't recognized" | Columns in M go in square brackets: [Sales] - [Cost] |
DAX column without the table name, [Sales] - [Cost] |
Works, but is hard to read and is bad practice | Write pbi_sales[Sales] - pbi_sales[Cost] for columns |
Using / instead of DIVIDE for margin |
An error (∞ or NaN) when Sales is 0 | DIVIDE returns blank instead of an error |
| Keeping both Profit PQ and Profit DAX | The same number twice, a bigger file, confused users | Keep one; delete the other |
| Looking for the DAX column in Power Query | It is not there | Power Query runs first; DAX columns live only in the model |
Self-check checklist
0 of 4 done
Try-at-home challenge
Make a wrong margin on purpose to see why the tip matters. Add a Power Query custom column Row Margin = [Profit PQ] / [Sales] (type Decimal Number), load it, and show Average of Row Margin next to your Margin % measure in a card each. Why are they different, and which one should the finance head see?
Check your answer
Average of Row Margin shows 26.67%, but Margin % shows 20.16%. The average treats a 12,000-rupee Headphones order (50% margin) the same as a 150,000-rupee Laptop order (15% margin). The real margin is total profit ÷ total sales = 262,500 ÷ 1,302,000 = 20.16%. The finance head must see the measure. Delete the Row Margin column afterwards.
Samjla ka? Row maths in Power Query, totals and ratios in measures, DAX columns only when needed. Aata pudhe jaauya: combine a whole folder of monthly bank statements in one go.