Labs · Power BI
Lab: Drill from Year to Month on a Sales Chart and Explain Each Drill Button
Course: Power BI · Chapter 16: Drill Up and Drill Down
Chapter 16 explains drill up and drill down; this lab presses every drill button on one chart and records what changes.
Chala mitrano! Four small arrows sit on top of every chart with a hierarchy, and most people click them randomly until something happens. Today we press each one on purpose and write down what it does. After this, you can guide your manager through the data like a tour guide. Ek ek button, samjun ghya!
चला मित्रांनो! Hierarchy असलेल्या प्रत्येक chart वर चार छोटे arrows असतात, आणि बहुतेक लोक काहीतरी होईपर्यंत ते random click करतात. आज आपण प्रत्येक arrow मुद्दाम दाबू आणि तो काय करतो ते लिहून ठेवू. यानंतर तुम्ही manager ला tour guide सारखं data मधून फिरवू शकाल. एक एक button, समजून घ्या!
चलो दोस्तों! Hierarchy वाले हर chart के ऊपर चार छोटे arrows होते हैं, और ज़्यादातर लोग कुछ होने तक उन्हें random click करते हैं। आज हम हर एक को जानबूझकर दबाएंगे और लिखेंगे कि वह क्या करता है। इसके बाद आप manager को tour guide की तरह data में घुमा सकोगे। एक एक button, समझ लो!
Suppose we are…
Suppose we are presenting the Croma sample sales to the CFO on a projector. She looks at a chart of 2025 vs 2026 and asks: "2025 was bigger, fine. But which quarter of 2025 was weak? And inside that quarter, which month?" We want to answer by clicking on the same chart, not by building new ones. The numbers are sample data made up for practice.
Goal of this lab
By the end you will have:
- A column chart on the Calendar hierarchy (Year › Quarter › Month).
- Drilled into 2025 and found the weak quarter (Qtr 3, 141,000) and its weakest month (July, 30,000).
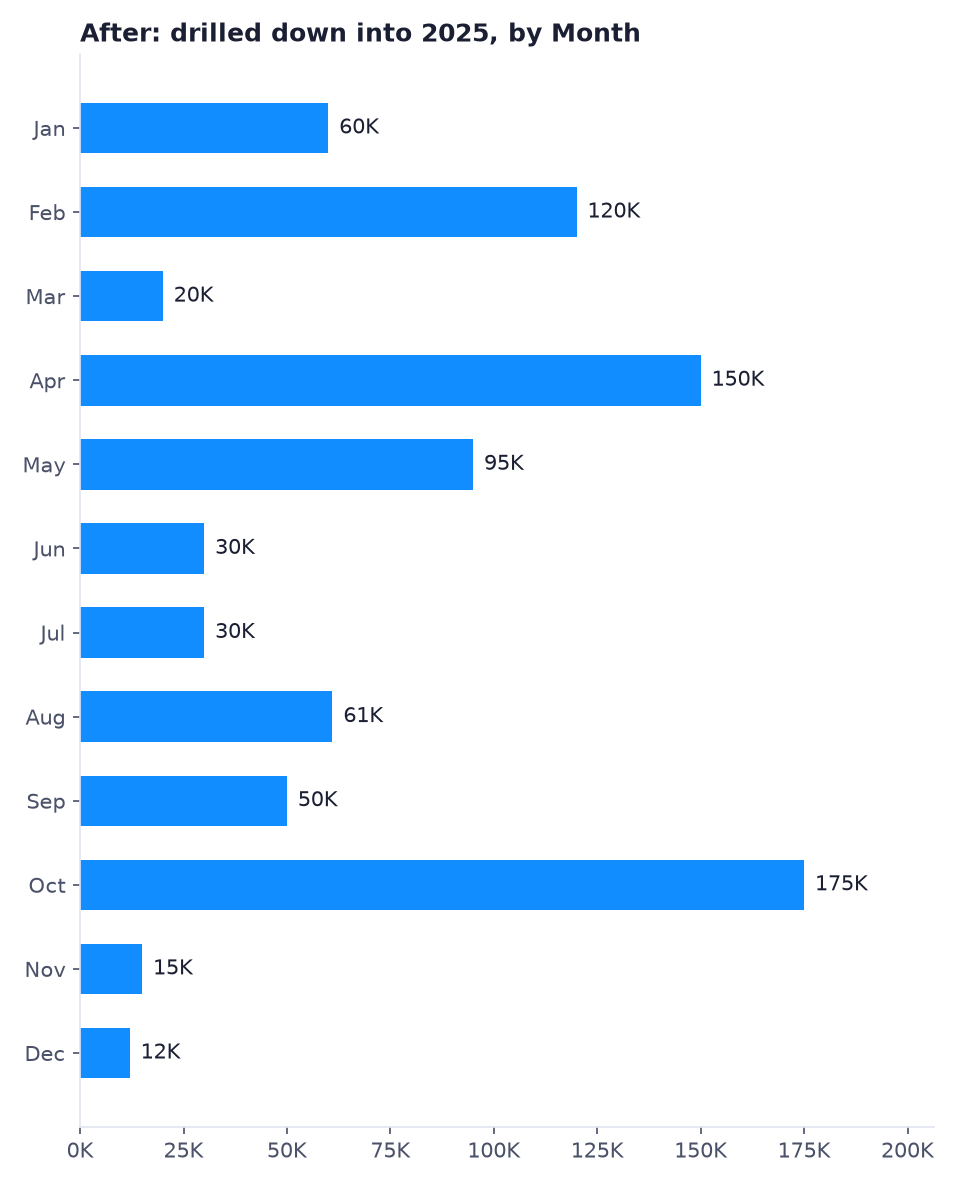
- Seen all 12 months of 2025 in one chart.
- A one-line note for each of the four drill buttons.
What you need (all free)
- Power BI Desktop and
Lab-12-hierarchy-groups.pbixfrom Lab 12 (it has DateTable, Total Sales and the Calendar hierarchy). - Sample data if you need to rebuild: Download pbi_sales.csv (24 orders)
- 25 minutes.
The data: before and after
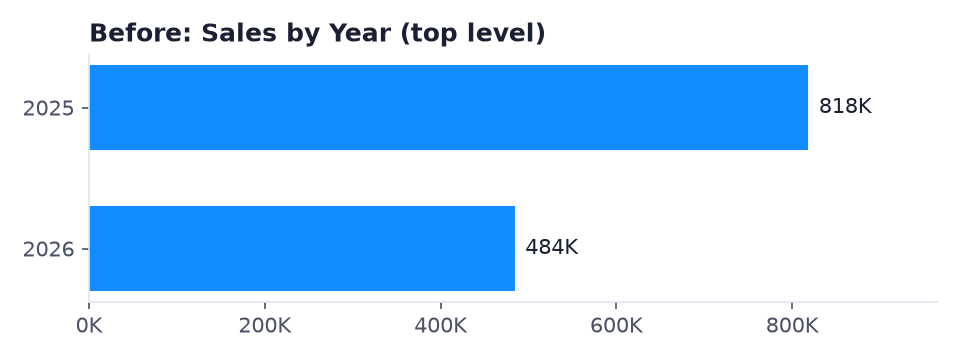
Before. The chart at the top level: two bars.
After. Drilled into 2025 and moved to the month level: 12 bars, and the weak months jump out.
The formula
No new DAX. The chart uses the same measure, Total Sales = SUM ( pbi_sales[Sales] ). What changes is the filter the chart sends to it:
| You are looking at | Filter on Total Sales | Example result |
|---|---|---|
| Year level | Year = 2025 | 818,000 |
| Drilled into 2025, Quarter level | Year = 2025 and Quarter = Qtr 3 | 141,000 |
| Drilled into Qtr 3, Month level | Year = 2025, Quarter = Qtr 3, Month = July | 30,000 |
| Next level without drilling into a bar | Quarter = Qtr 1 (both years together) | 200,000 + 305,000 = 505,000 |
Drilling adds a filter for the bar you clicked. "Go to the next level" changes the level without keeping a bar's filter (except a year you already drilled into).
Steps
- Open
Lab-12-hierarchy-groups.pbixand Save asLab-16-drill. Add a new page (the + at the bottom). -
Click Clustered column chart. X-axis: Calendar (the whole hierarchy), Y-axis: Total Sales. Turn on Data labels.
What you should see: two bars, 2025 818K and 2026 484K, and four small arrow icons above the chart when you hover over it.
-
Hover over the chart. Find the four icons, from left to right: Drill up (↑), Drill down mode (↓ in a circle), Go to the next level in the hierarchy (⇊) and Expand all down one level (a forked arrow).
-
Click Drill down mode (the icon turns dark: drill mode is on). Now click the 2025 bar.
What you should see: four bars: Qtr 1 200K, Qtr 2 275K, Qtr 3 141K, Qtr 4 202K. The chart title or axis shows you are inside 2025.
-
Click the Qtr 3 bar.
What you should see: July 30K, August 61K, September 50K. July is the weakest month of the weak quarter.
-
Click Drill up once.
What you should see: back to the four quarters of 2025.
-
Now click Go to the next level (⇊).
What you should see: all 12 months of 2025 (the After image). October is the best month (175K), December the weakest (12K).
-
Click Drill up twice to get back to the two years. Turn Drill down mode off (click it again).
-
Click Go to the next level (⇊) from the year level.
What you should see: four bars that mix both years: Qtr 1 505K, Qtr 2 454K, Qtr 3 141K, Qtr 4 202K.
-
Click Drill up, then click Expand all down one level (forked arrow).
What you should see: six bars labelled with both levels: 2025 Qtr 1, 2025 Qtr 2, … 2026 Qtr 2.
-
Write one line for each button in your notes (see the tip), and save.
Ravindra Bagale's Tip
Remember it like this. Drill down = "open this one bar". Next level = "show the next level for everything I am in". Expand = "show the next level, but keep the parent name in the label". Drill up = "go back". If the CFO is confused, say which year or quarter you are inside before you click. Aapan kuthe aahot, he aadhi sanga!
Ravindra Bagale's Tip – मराठी
असं लक्षात ठेवा. Drill down = "हा एक bar उघड". Next level = "मी ज्यात आहे त्या सगळ्याचा पुढचा level दाखव". Expand = "पुढचा level दाखव, पण label मध्ये parent चं नाव ठेव". Drill up = "मागे जा". CFO गोंधळल्या तर click करण्याआधी तुम्ही कोणत्या year किंवा quarter मध्ये आहात ते सांगा. आपण कुठे आहोत, हे आधी सांगा!
Ravindra Bagale's Tip – हिंदी
ऐसे याद रखो। Drill down = "यह एक bar खोलो"। Next level = "मैं जिसमें हूँ उस सबका अगला level दिखाओ"। Expand = "अगला level दिखाओ, पर label में parent का नाम रखो"। Drill up = "वापस जाओ"। CFO उलझ जाएँ तो click करने से पहले बताओ कि आप किस year या quarter के अंदर हो। हम कहाँ हैं, यह पहले बताओ!
Common mistakes
| Mistake | What happens | Fix |
|---|---|---|
| Clicking a bar with drill mode off | The bar is only highlighted and other visuals filter | Turn on Drill down mode first, or right-click the bar → Drill down |
| Using Next level at the top and expecting 2025 only | Quarters of both years are added together (Qtr 1 = 505K) | Drill into 2025 first, then use Next level |
| Putting Year, Quarter and Month as three separate fields in different visuals | No arrows appear | Put the Calendar hierarchy (or several fields) in the same X-axis box |
| Months in A–Z order | April before January | Sort Month by Month No (Lab 11) |
| Leaving the chart drilled down when you save | The next viewer sees only one quarter | Drill up to the top level before saving |
Self-check checklist
0 of 5 done
Try-at-home challenge
Do the same drill on a Matrix with the Calendar hierarchy in Rows (as in Lab 12). Which is better for the CFO's projector meeting, the chart or the matrix, and why?
Check your answer
In the matrix, the same four icons appear, and Expand shows parents and children together (2025 with its quarters underneath, with subtotals). The matrix is better when she wants exact numbers and subtotals; the column chart is better for seeing the shape quickly (Qtr 3 and December are obviously low). Many reports put both on the page: the chart to spot the problem, the matrix to quote the number.
Samjla ka? Drill down opens one bar, Next level shows the next level for everything, Expand keeps the parent in the label. Aata pudhe jaauya: build a City details page and drill through to it.