Labs · Power BI
Lab: Clean a Messy Sales File in Power Query – Promote Headers, Fix Data Types and Remove Blank Rows
Course: Power BI · Chapter 6: Power Query Essentials
Chapter 6 introduces Power Query; this lab uses its five most common buttons on one ugly file.
Chala mitrano! Real files never arrive clean. There is always a title on top, empty rows in the middle and a Total at the bottom. If you load such a file straight away, every number is wrong. Today we clean one in Power Query, and the best part: Power Query remembers every step, so next month's file gets cleaned automatically. Ekda kaam, nehmi aaram!
चला मित्रांनो! खऱ्या files कधीच clean येत नाहीत. वर नेहमी title, मध्ये रिकाम्या rows आणि खाली Total असतोच. अशी file सरळ load केली तर प्रत्येक number चुकतो. आज आपण Power Query मध्ये एक file clean करू, आणि सगळ्यात छान गोष्ट: Power Query प्रत्येक step लक्षात ठेवतो, म्हणून पुढच्या महिन्याची file आपोआप clean होते. एकदा काम, नेहमी आराम!
चलो दोस्तों! असली files कभी clean नहीं आतीं। ऊपर हमेशा title, बीच में खाली rows और नीचे Total होता ही है। ऐसी file सीधे load की तो हर number गलत होता है। आज हम Power Query में एक file clean करेंगे, और सबसे अच्छी बात: Power Query हर step याद रखता है, इसलिए अगले महीने की file अपने आप clean हो जाती है। एक बार काम, हमेशा आराम!
Suppose we are…
Suppose we are a data analyst for the Pune branch of a Vijay Sales-style electronics store. Every month the old ERP (the billing software) exports March sales as messy_sales.csv. It is made for printing, not for analysis:
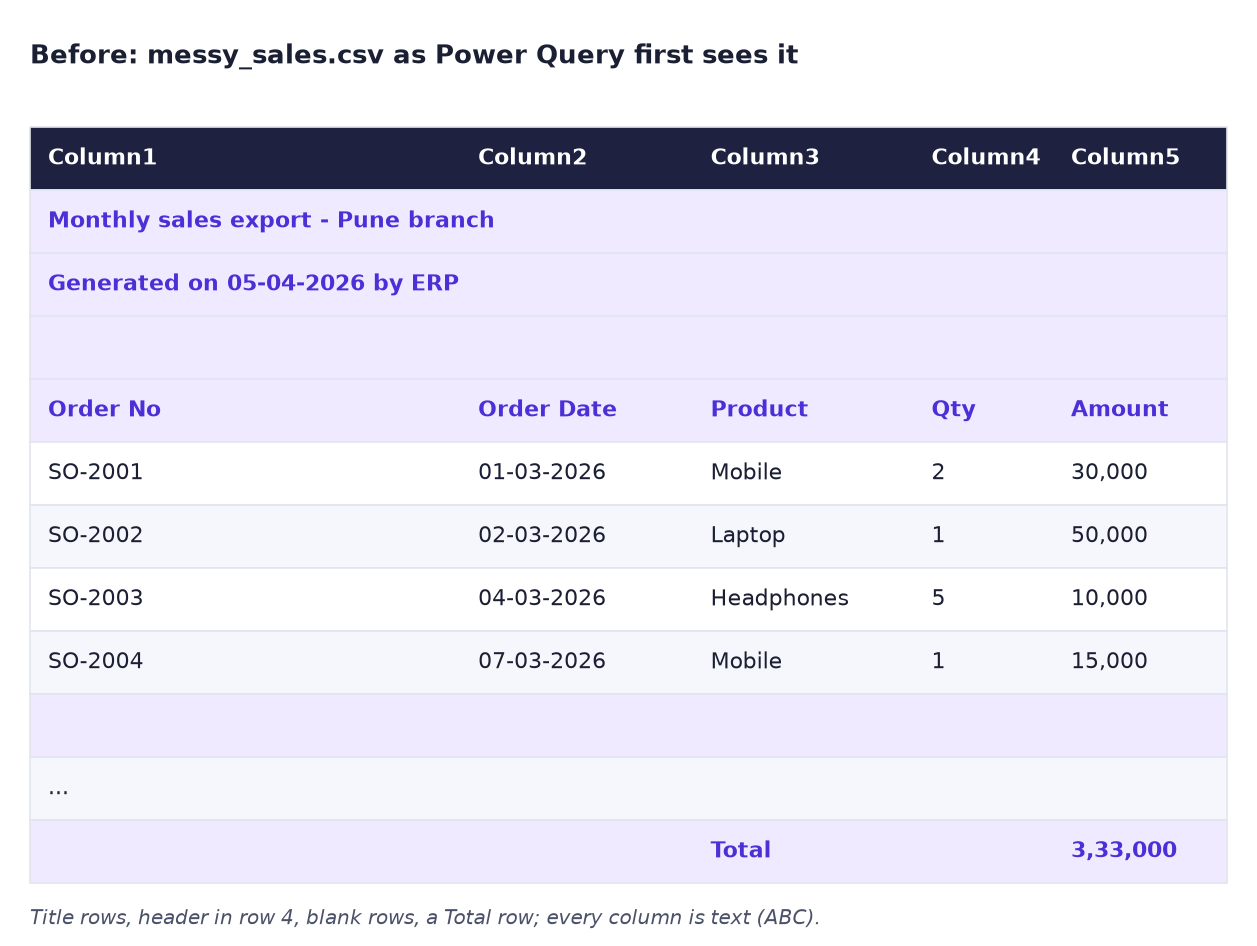
- Two title lines and an empty line at the top.
- Empty lines between the orders.
- A Total line at the bottom (if we load it, the total is counted twice).
- Dates written as 01-03-2026, which means 1 March in India, but 3 January on a US-format computer.
- Amounts with Indian commas, such as 1,00,000, stored as text.
The data is sample data made up for practice.
Goal of this lab
By the end you will have:
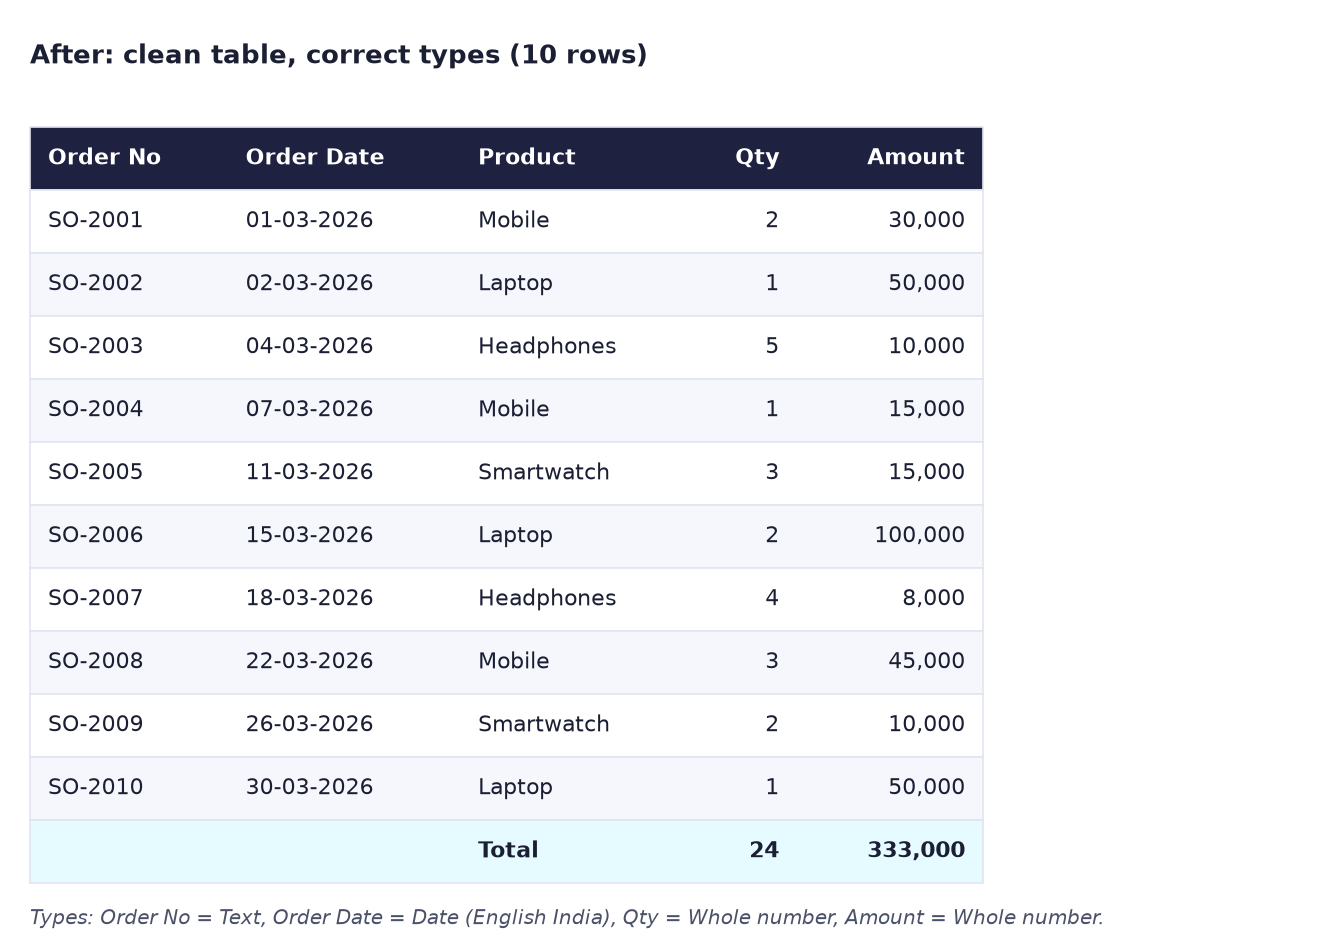
- A query with exactly 10 orders and the headers Order No, Order Date, Product, Qty, Amount.
- Correct data types: Date, Whole Number and Text.
- A total of 333,000, counted once, and 5 named steps in Applied Steps that will clean next month's file too.
What you need (all free)
- Power BI Desktop.
- The messy file: Download messy_sales.csv (ERP export, 17 lines)
- 30 minutes.
The data: before and after
Before. This is how Power Query sees the file: generic Column1 to Column5, everything as text, and junk rows highlighted.
After. Ten clean rows with proper headers and types. The total is 333,000.
The formula
You will not type any code. Every button you click writes one line of M (the Power Query language) into Applied Steps. Here are the five lines you will create, so you can read them in the formula bar:
Removed Top Rows        = Table.Skip(Source, 3)
Promoted Headers        = Table.PromoteHeaders(#"Removed Top Rows", [PromoteAllScalars=true])
Removed Blank Rows      = Table.SelectRows(#"Promoted Headers", each not List.IsEmpty(List.RemoveMatchingItems(Record.FieldValues(_), {"", null})))
Filtered Rows           = Table.SelectRows(#"Removed Blank Rows", each [Product] <> "Total")
Changed Type with Locale = Table.TransformColumnTypes(#"Filtered Rows", {{"Order Date", type date}, {"Amount", Int64.Type}}, "en-IN")
In plain words: skip 3 rows, use the next row as headers, drop rows where every cell is empty, drop the row where Product is "Total", then read dates and amounts the Indian way (en-IN = English (India)). That last part is what turns 01-03-2026 into 1 March and 1,00,000 into 100000.
Steps
-
In Power BI Desktop, click Home → Get data → Text/CSV, choose
messy_sales.csvand click Transform Data (not Load).What you should see: the Power Query Editor. In Applied Steps on the right there is Source, and maybe also Promoted Headers and Changed Type.
-
If you see Promoted Headers or Changed Type, delete them: click the X to the left of each step, starting from the bottom, until only Source is left.
What you should see: columns named Column1 to Column5, with "Monthly sales export - Pune branch" in the first row, exactly like the Before image.
-
Click Home → Remove Rows → Remove Top Rows, type
3and click OK.What you should see: the first row now reads Order No, Order Date, Product, Qty, Amount.
-
Click Home → Use First Row as Headers. Power Query adds a Changed Type step by itself; delete it with its X so that you choose the types yourself.
What you should see: real column names in the header, and the step Promoted Headers.
-
Click Home → Remove Rows → Remove Blank Rows.
What you should see: 11 rows: the 10 orders and the Total row.
-
Click the drop-down arrow on the Product header, untick Total, click OK.
What you should see: 10 rows, from SO-2001 to SO-2010.
-
Click the ABC icon on Order No and choose Text. Click the ABC icon on Qty and choose Whole Number.
-
Right-click the Order Date header and choose Change Type → Using Locale…. Set Data Type to Date and Locale to English (India). Click OK.
What you should see: a calendar icon on the header. SO-2006 shows the 15th of March (shown as 15-03-2026 or 3/15/2026, depending on your Windows date format), and no Error cells.
-
Right-click Amount → Change Type → Using Locale…, choose Whole Number and English (India), and click OK.
What you should see: numbers aligned to the right; SO-2006 shows 100000.
-
Rename the query (left side, under Queries) to March Sales. Click Home → Close & Apply.
-
In Report view, build a Table visual with Product and Amount.
What you should see: Laptop 200,000, Mobile 90,000, Smartwatch 25,000, Headphones 18,000 and Total 333,000.
-
Save as
Lab-06-clean-messy-sales.
Ravindra Bagale's Tip
Always look at the Applied Steps list before you close. Read it like a recipe: skip 3 rows, headers, remove blanks, remove Total, set types. If one step looks strange, click it and see the table at that moment. Power Query is like a CCTV recording of your cleaning. Step by step bagha!
Ravindra Bagale's Tip – मराठी
Close करण्याआधी Applied Steps list नेहमी बघा. Recipe सारखी वाचा: 3 rows skip, headers, blanks काढा, Total काढा, types set करा. एखादी step विचित्र वाटली तर त्यावर click करा आणि त्या क्षणाचं table बघा. Power Query म्हणजे तुमच्या cleaning चं CCTV recording. Step by step बघा!
Ravindra Bagale's Tip – हिंदी
Close करने से पहले Applied Steps list हमेशा देखो। Recipe की तरह पढ़ो: 3 rows skip, headers, blanks हटाओ, Total हटाओ, types set करो। कोई step अजीब लगे तो उस पर click करो और उस पल का table देखो। Power Query आपकी cleaning की CCTV recording है। Step by step देखो!
Common mistakes
| Mistake | What happens | Fix |
|---|---|---|
| Clicking Load instead of Transform Data | The junk rows go straight into the report | Click Transform data on the Home ribbon and clean there |
| Keeping the automatic Changed Type step | Wrong guesses, e.g. dates read the US way | Delete it and set types yourself |
| Changing Order Date to Date without a locale on a US-format PC | 01-03-2026 becomes 3 January; 15-03-2026 becomes Error | Use Change Type → Using Locale → English (India) |
| Forgetting to remove the Total row | Total shows 666,000 (counted twice) | Filter Product ≠ Total |
| Removing the top 4 rows | The header row is gone; Column names become SO-2001… | Remove 3, then Use First Row as Headers |
| Typing over values in Table view | You cannot: Power BI data is read-only there | Fix it in Power Query, so the fix repeats every refresh |
Self-check checklist
0 of 5 done
Try-at-home challenge
Next month the ERP sends April's file in exactly the same shape. Prove that your steps work again: open messy_sales.csv in Notepad, change SO-2010's Amount from "50,000" to "55,000" and save. In Power BI click Home → Refresh. What is the new total, and did you have to repeat any step?
Check your answer
The new total is 338,000 (Laptop becomes 205,000). You did not repeat any step: Refresh re-ran all of Applied Steps on the new file. That is the whole point of cleaning in Power Query instead of by hand in Excel. (Remember to change the value back to "50,000" afterwards if you want the lab numbers to match again.)
Samjla ka? Remove top rows, promote headers, remove blanks, filter the Total, set types with the right locale. Aata pudhe jaauya: fix 10 common data problems in one customer file.