Labs · Power BI
Lab: Build a City Details Page and Drill Through to It from a Bar Chart
Course: Power BI · Chapter 17: Drill Through
Chapter 17 explains drill through; this lab builds a details page that any city bar can open.
Chala mitrano! The main page should be clean: a few big numbers and charts. But managers always want details: "Show me Pune's orders." If you put every detail on the main page, it becomes a jungle. Drill through solves this: one details page, opened only when someone asks. Mukhya page swachh, details ek click var!
चला मित्रांनो! Main page clean असावं: काही मोठे numbers आणि charts. पण managers ना नेहमी details हवे असतात: "Pune चे orders दाखवा." प्रत्येक detail main page वर टाकलं तर ते जंगल होतं. Drill through हे सोडवतं: एक details page, कोणी विचारलं तरच उघडणारं. मुख्य page स्वच्छ, details एका click वर!
चलो दोस्तों! Main page साफ होना चाहिए: कुछ बड़े numbers और charts। लेकिन managers को हमेशा details चाहिए: "Pune के orders दिखाओ।" हर detail main page पर डालोगे तो वह जंगल बन जाएगा। Drill through इसका हल है: एक details page, जो कोई पूछे तभी खुले। मुख्य page साफ, details एक click पर!
Suppose we are…
Suppose we built the Croma sales overview, and the Pune store manager calls: "My city is below target. Show me exactly which orders we got." We do not want a separate report per city. We want one details page that opens for whichever city is right-clicked. That is drill through. The numbers are sample data made up for practice.
Goal of this lab
By the end you will have:
- An Overview page with a bar chart of sales by city.
- A City Details page with City as its drill-through field, two cards and an order table.
- Right-clicked Pune and landed on its 6 orders (24 units, 346,000), then come back with the Back button.
What you need (all free)
- Power BI Desktop and your
Lab-12-hierarchy-groups.pbix(or Lab 11) file. - Sample data if you need to rebuild: Download pbi_sales.csv (24 orders) Download pbi_cities.csv
- 30 minutes.
The data: before and after
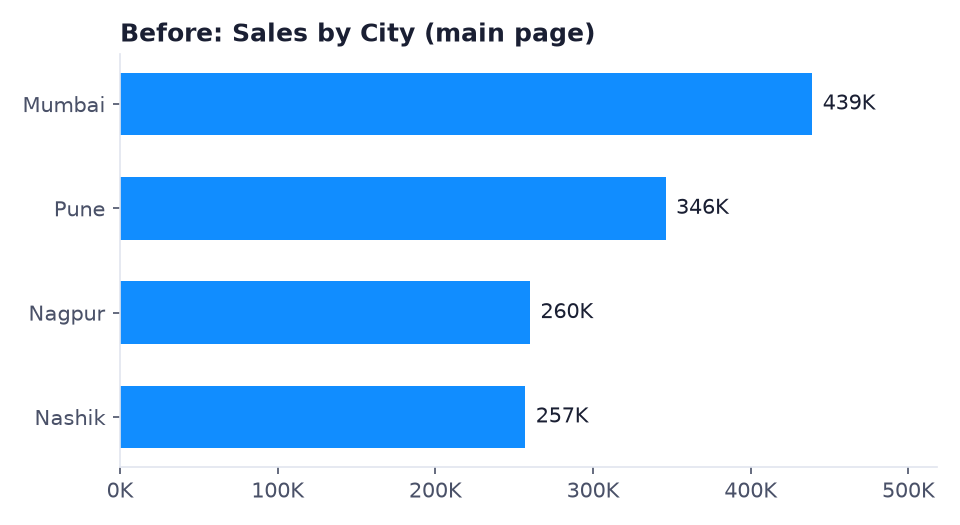
Before. The main page: one bar per city, no detail.
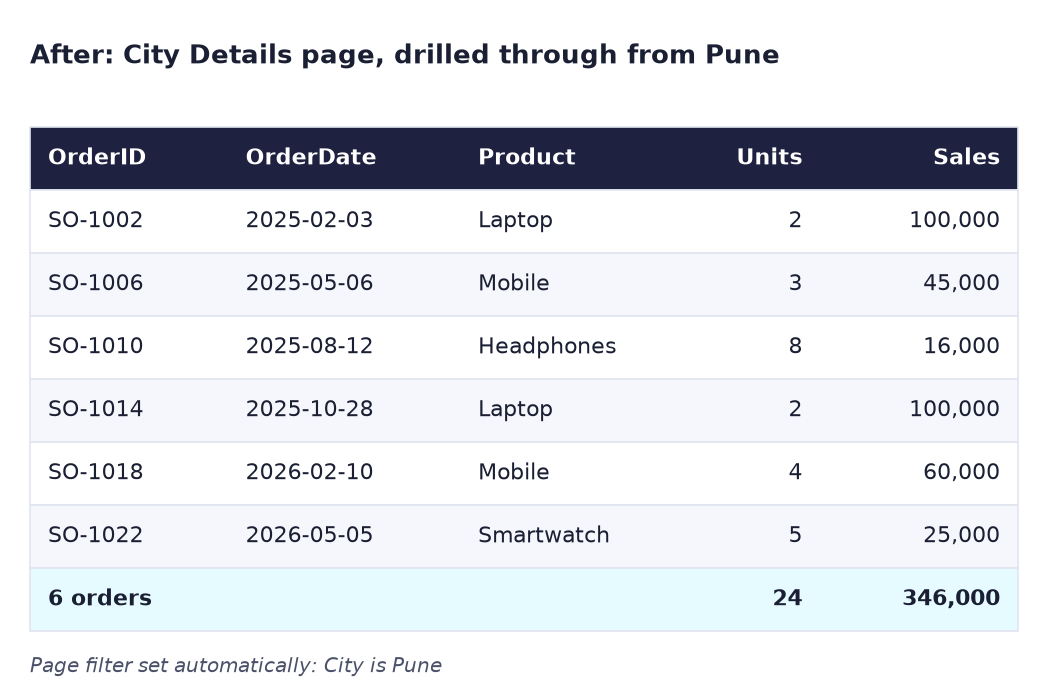
After. Right-click Pune → Drill through → City Details: only Pune's six orders.
The formula
We add one helper measure for the details page:
Orders = COUNTROWS ( pbi_sales )
Drill through works by passing a filter. When you right-click Pune and choose City Details, Power BI opens that page with the filter City = Pune already applied, exactly as if you had added a page filter by hand. Every visual on the page then calculates its measures (Orders = 6, Total Sales = 346,000) for Pune only.
Steps
- Open your Lab 12 file and Save as
Lab-17-drill-through. Rename the first page Overview (double-click the page tab). - On Overview, make a Clustered bar chart: Y-axis pbi_cities[City], X-axis Total Sales, sorted descending, data labels on.
- If you do not have it yet, add the measure
Orders = COUNTROWS ( pbi_sales )(right-click pbi_sales → New measure). - Click + at the bottom to add a page. Rename it City Details.
-
On City Details, click empty canvas. In the Visualizations pane, scroll down to Drill through and drag pbi_cities[City] into Add drill-through fields here.
What you should see: a Back arrow button appears at the top left of the page automatically.
-
Add two Cards: Orders and Total Sales.
-
Add a Table with pbi_sales[OrderID], DateTable[Date], pbi_products[Product], Units (or pbi_sales[Units]) and Total Sales. Sort it by Date.
What you should see: right now it shows all 24 orders, because no city is passed yet.
-
Add a Text box at the top with the words
City details(we make this title dynamic in Lab 20). -
Go back to Overview. Right-click the Pune bar → Drill through → City Details.
What you should see: the City Details page opens. The Filters pane shows City is Pune. Cards: 6 orders and 346K. Table: SO-1002, SO-1006, SO-1010, SO-1014, SO-1018, SO-1022, with 24 units in total.
-
Hold Ctrl and click the Back button (in Power BI Desktop, buttons need Ctrl+click while editing).
What you should see: back on Overview.
-
Try Nagpur: right-click → Drill through → City Details. Then right-click the City Details page tab → Hide page, so users only reach it by drilling through. Save.
What you should see: for Nagpur, 6 orders and 260K. The hidden page tab looks faded in Desktop.
Ravindra Bagale's Tip
Use the drill-through field from the dimension table (pbi_cities[City]). Then any visual that shows City from that table, a bar, a table or a map, can drill through to the same page. And hide the details page: a details page with no filter shows everything and confuses people. Ek details page, saglya visuals sathi!
Ravindra Bagale's Tip – मराठी
Drill-through field dimension table मधला वापरा (pbi_cities[City]). मग त्या table मधली City दाखवणारा कोणताही visual, bar, table किंवा map, त्याच page वर drill through करू शकतो. आणि details page hide करा: filter नसलेलं details page सगळं दाखवतं आणि लोकांना गोंधळात टाकतं. एक details page, सगळ्या visuals साठी!
Ravindra Bagale's Tip – हिंदी
Drill-through field dimension table वाला इस्तेमाल करो (pbi_cities[City])। तब उस table की City दिखाने वाला कोई भी visual, bar, table या map, उसी page पर drill through कर सकता है। और details page hide करो: बिना filter वाला details page सब कुछ दिखाता है और लोगों को उलझाता है। एक details page, सारे visuals के लिए!
Common mistakes
| Mistake | What happens | Fix |
|---|---|---|
| Drill-through field from pbi_sales[City] but the bar uses pbi_cities[City] | Drill through does not appear in the right-click menu | Use the same column in both places (the dimension column) |
| Left-clicking the bar and looking for the page | Nothing happens; it only cross-filters | Right-click the bar → Drill through |
| Clicking Back without Ctrl in Desktop | The button is just selected | Ctrl+click in Desktop; a normal click works in the Service |
| Not hiding the details page | Users open it directly and see all 24 orders | Right-click the tab → Hide page |
| Deleting the Back button | Users get stuck on the details page | Insert it again: Insert → Buttons → Back |
Self-check checklist
0 of 4 done
Try-at-home challenge
Make the details page also work from a Product chart, so that right-clicking Laptop on any Product chart opens a page with only Laptop orders. Do you need a new page, or can City Details do both?
Check your answer
The same page can do both: add pbi_products[Product] to the Drill through box under City. Now right-clicking Laptop on a Product chart opens City Details with Product is Laptop: 8 orders and 750K. (Rename the page "Details" so the name fits both.) If you right-click a bar in a chart that has both City and Product, both filters pass at once, for example Pune + Laptop = 2 orders, 200K.
Samjla ka? A drill-through page receives the filter of the bar you right-click. Aata pudhe jaauya: show the product split in a tooltip when you hover over a city.