Labs · Power BI
Lab: Solve 5 Interview-Style DAX Tasks on the Sample File and Check the Answers
Course: Power BI · Chapter 31: Interview Questions Asked in MNC Interviews
Chapter 31 lists questions asked in MNC interviews; this lab turns five of them into hands-on tasks with exact answers.
Download pbi_sales.csv (24 orders) Download pbi_products.csv (4 products) Download pbi_cities.csv (4 cities)
Chala mitrano! Interviewers at Accenture, Deloitte or Infosys rarely ask "what is DAX". They say: "Write a measure for last year's sales" and watch your screen. Today: five such tasks, one after another. Try each yourself first, then open the answer. Every task has one exact number, so there is no guessing. Ek ek task, pakka uttar!
चला मित्रांनो! Accenture, Deloitte किंवा Infosys मधले interviewers क्वचितच "DAX म्हणजे काय" विचारतात. ते म्हणतात: "मागच्या वर्षीच्या sales साठी measure लिहा" आणि तुमची screen बघतात. आज असे पाच tasks, एकामागून एक. आधी प्रत्येक task स्वतः करून बघा, मग answer उघडा. प्रत्येक task चा एक नक्की number आहे, त्यामुळे अंदाज नाही. एक एक task, पक्कं उत्तर!
चलो दोस्तों! Accenture, Deloitte या Infosys के interviewers कम ही पूछते हैं "DAX क्या है"। वो कहते हैं: "पिछले साल की sales का measure लिखो" और आपकी screen देखते हैं। आज ऐसे पाँच tasks, एक के बाद एक। पहले हर task खुद करो, फिर answer खोलो। हर task का एक पक्का number है, तो अंदाज़ा नहीं। एक एक task, पक्का जवाब!
Suppose we are…
Suppose we are in a 45-minute live DAX round at Accenture for a Power BI analyst role. The interviewer shares the same small electronics sales model we built in Lab 11 (24 orders, 4 cities, 4 products, a DateTable for 2025–2026) and gives five tasks. The numbers are sample data made up for practice.
Goal of this lab
Write five measures and check each against an exact answer:
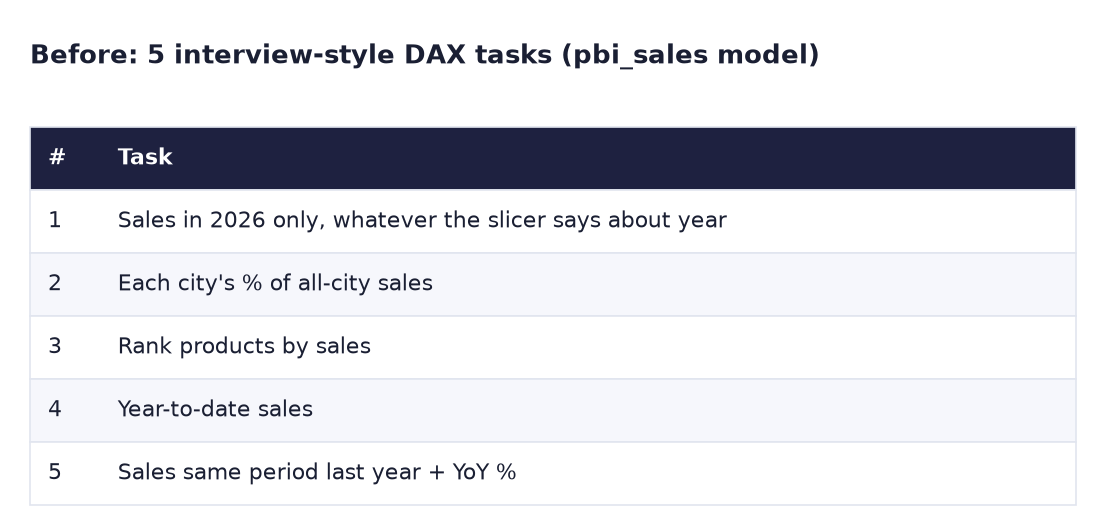
- Sales in 2026 only, whatever the Year slicer says.
- Each city's % of all-city sales.
- Rank products by sales.
- Year-to-date sales.
- Sales for the same period last year and the YoY %.
What you need (all free)
- Power BI Desktop and
Lab-11-star-schema.pbixfrom Lab 11 (pbi_sales, pbi_products, pbi_cities, a marked DateTable and the Total Sales measure). No file? Do Lab 11 first; the CSVs are here: - Download pbi_sales.csv (24 orders) Download pbi_products.csv Download pbi_cities.csv
- 45 minutes.
The data: before and after
Before. The five tasks, in plain words, as an interviewer would say them.
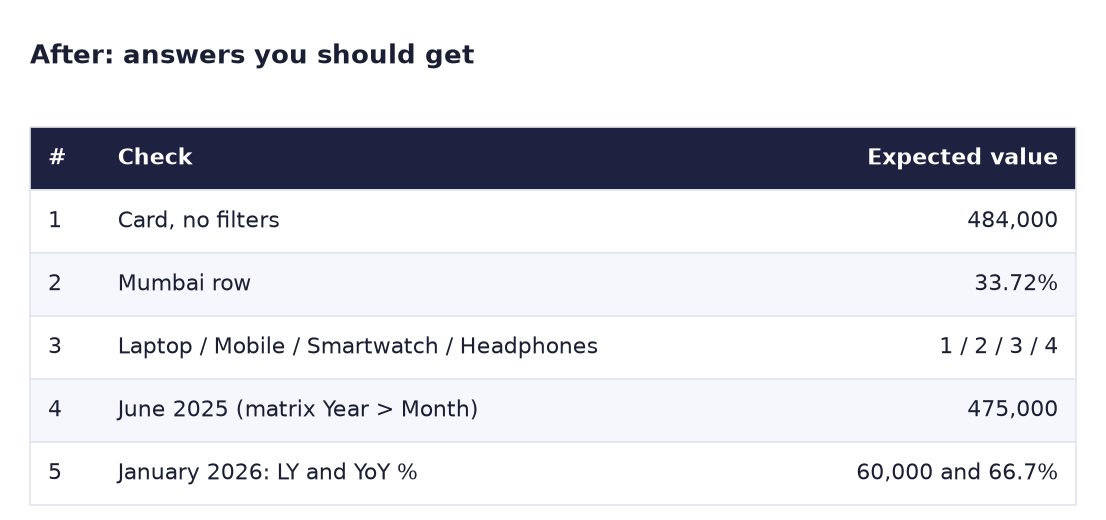
After. The exact values you should get.
The formula
All five use the one base measure, Total Sales = SUM ( pbi_sales[Sales] ), plus one of these ideas:
| Task | Key idea | Function |
|---|---|---|
| 1 | Replace the Year filter | CALCULATE |
| 2 | Remove the City filter for the denominator | ALL inside CALCULATE, DIVIDE |
| 3 | Compare each product with all products | RANKX + ALL |
| 4 | From 1 January to the current date | TOTALYTD |
| 5 | Shift the dates back one year | SAMEPERIODLASTYEAR |
Try writing each measure before opening its answer.
Steps
- Open
Lab-11-star-schema.pbixand Save asLab-31-dax-tasks. Add a new page. Check that DateTable is marked as a date table (Table tools → Mark as date table). -
Task 1. Create a measure Sales 2026 that shows 2026 sales even if a Year slicer says 2025. Put it in a Card, then add a slicer with DateTable[Year] and pick 2025.
What you should see: the card shows 484K (484,000) with no slicer selection and with 2025 selected.
Answer 1
Sales 2026 = CALCULATE ( [Total Sales], DateTable[Year] = 2026 )CALCULATE replaces the filter on DateTable[Year], so the slicer cannot change it. Year is a number (YEAR returns a number), so write 2026 without quotes.
-
Task 2. Create City % of Total. Build a Table with pbi_cities[City], Total Sales and the new measure, formatted as a percentage with 2 decimals.
What you should see: Mumbai 33.72%, Pune 26.57%, Nagpur 19.97%, Nashik 19.74%, total 100.00%.
Answer 2
City % of Total =
DIVIDE ( [Total Sales], CALCULATE ( [Total Sales], ALL ( pbi_cities ) ) )
The numerator keeps the row's city (439,000 for Mumbai). The denominator removes all city filters (1,302,000). 439,000 / 1,302,000 = 33.72%. DIVIDE returns blank instead of an error if the denominator is 0.
-
Task 3. Create Product Rank and build a Table with pbi_products[Product], Total Sales and Product Rank.
What you should see: Laptop 1 (750,000), Mobile 2 (390,000), Smartwatch 3 (90,000), Headphones 4 (72,000).
Answer 3
Product Rank = RANKX ( ALL ( pbi_products[Product] ), [Total Sales], , DESC, Dense )ALL gives RANKX the full list of 4 products to compare with. Without ALL, each row sees only itself and every product gets rank 1. The total row shows 1 too; to blank it, wrap it:
IF ( HASONEVALUE ( pbi_products[Product] ), RANKX ( … ) ). -
Task 4. Create Sales YTD. Build a Matrix: Rows = DateTable[Year] then DateTable[Month] (Month sorted by Month No, as in Lab 12), Values = Total Sales and Sales YTD. Expand 2025.
What you should see: June 2025 Sales YTD = 475,000 (60k + 120k + 20k + 150k + 95k + 30k), and December 2025 = 818,000. January 2026 starts again at 100,000.
Answer 4
Sales YTD = TOTALYTD ( [Total Sales], DateTable[Date] )TOTALYTD needs the Date column of a proper date table. It restarts each 1 January. If the matrix uses pbi_sales[OrderDate] instead of DateTable, the numbers go wrong: always slice by DateTable.
-
Task 5. Create Sales LY and YoY %. Add both to the matrix and expand 2026.
What you should see: January 2026: Total Sales 100,000, Sales LY 60,000, YoY % 66.7%.
Answer 5
Sales LY = CALCULATE ( [Total Sales], SAMEPERIODLASTYEAR ( DateTable[Date] ) )
YoY % = DIVIDE ( [Total Sales] - [Sales LY], [Sales LY] )
(100,000 − 60,000) / 60,000 = 66.7%. Look at the 2026 year row: Sales LY shows 818,000, all of 2025, because 2026 in DateTable means all 12 months. But 2026 data only runs to June, so YoY % shows −40.8%, which is misleading. That is the trap in the challenge below.
-
Save the file. Count your score: 1 point for each task you solved without opening the answer.
Ravindra Bagale's Tip
In a live round, say what you are doing as you type: "I use ALL on the city table so the denominator ignores the row's city." Even if you make a small syntax mistake, the interviewer hears that you know the idea. And always check one number by hand, like 439,000 divided by 1,302,000. Bolat bolat type kara!
Ravindra Bagale's Tip – मराठी
Live round मध्ये type करताना काय करताय ते बोला: "Denominator row ची city ignore करावा म्हणून city table वर ALL वापरतो." छोटी syntax चूक झाली तरी interviewer ला कळतं की तुम्हाला concept माहीत आहे. आणि नेहमी एक number हाताने check करा, जसं 439,000 भागिले 1,302,000. बोलत बोलत type करा!
Ravindra Bagale's Tip – हिंदी
Live round में type करते समय बोलो कि क्या कर रहे हो: "Denominator row की city ignore करे, इसलिए city table पर ALL लगा रहा हूँ।" छोटी syntax गलती हो भी जाए, interviewer समझ जाता है कि आपको concept आता है। और हमेशा एक number हाथ से check करो, जैसे 439,000 भाग 1,302,000। बोलते बोलते type करो!
Common mistakes
| Mistake | What happens | Fix |
|---|---|---|
DateTable[Year] = "2026" with quotes |
Error: cannot compare number and text | Year is a number: = 2026 |
| RANKX without ALL | Every product shows rank 1 | RANKX ( ALL ( pbi_products[Product] ), … ) |
ALL ( pbi_sales[City] ) while the table uses pbi_cities[City] |
% stays 100% on every row | Remove the filter on the column the visual uses: ALL ( pbi_cities ) |
| Time intelligence on pbi_sales[OrderDate] | Blank or wrong YTD and LY | Use DateTable[Date], marked as a date table |
Dividing with / |
Error or infinity when LY is 0 | Use DIVIDE |
| Trusting the 2026 year-row YoY | −40.8% "drop" that is not real | Compare equal periods (see the challenge) |
Self-check checklist
0 of 6 done
Try-at-home challenge
The interviewer asks: "Is 2026 better or worse than 2025 so far?" The year row says −40.8%. Give a fair answer with a number: compare January–June 2026 with January–June 2025.
Check your answer
2026 January–June = 484,000. 2025 January–June = 475,000 (the June 2025 YTD from Task 4). Growth = (484,000 − 475,000) / 475,000 = +1.9%, slightly better, not 40.8% worse. One way in DAX: put Sales YTD and Sales YTD LY = CALCULATE ( [Sales YTD], SAMEPERIODLASTYEAR ( DateTable[Date] ) ) in a matrix by month and read the June 2026 row: 484,000 and 475,000. The lesson: always compare equal periods.
Samjla ka? CALCULATE, ALL, RANKX, TOTALYTD, SAMEPERIODLASTYEAR: five tasks, five exact numbers. Aata pudhe jaauya: rebuild your first bar chart with keyboard shortcuts.