Labs · Power BI
Lab: Make a Chart/Table Toggle with Bookmarks, the Selection Pane and Buttons
Course: Power BI · Chapter 19: Bookmarks, Selection Pane, Buttons and Navigation
Chapter 19 covers bookmarks, the Selection pane, buttons and navigation; this lab combines all four into one toggle.
Chala mitrano! Some people love charts, some want exact numbers in a table. Instead of giving both and wasting half the page, we give one space and two buttons: Chart and Table. It feels like a real app. The secret is three tools working together: Selection pane, Bookmarks and Buttons. Ek jaaga, don roop!
चला मित्रांनो! काही लोकांना charts आवडतात, काहींना table मध्ये अचूक numbers हवे असतात. दोन्ही देऊन अर्धं page वाया घालवण्यापेक्षा, आपण एक जागा आणि दोन buttons देऊ: Chart आणि Table. खऱ्या app सारखं वाटतं. रहस्य म्हणजे तीन tools एकत्र: Selection pane, Bookmarks आणि Buttons. एक जागा, दोन रूप!
चलो दोस्तों! कुछ लोगों को charts पसंद हैं, कुछ को table में सटीक numbers चाहिए। दोनों देकर आधा page बर्बाद करने के बजाय, हम एक जगह और दो buttons देंगे: Chart और Table। असली app जैसा लगता है। राज़ है तीन tools का साथ: Selection pane, Bookmarks और Buttons। एक जगह, दो रूप!
Suppose we are…
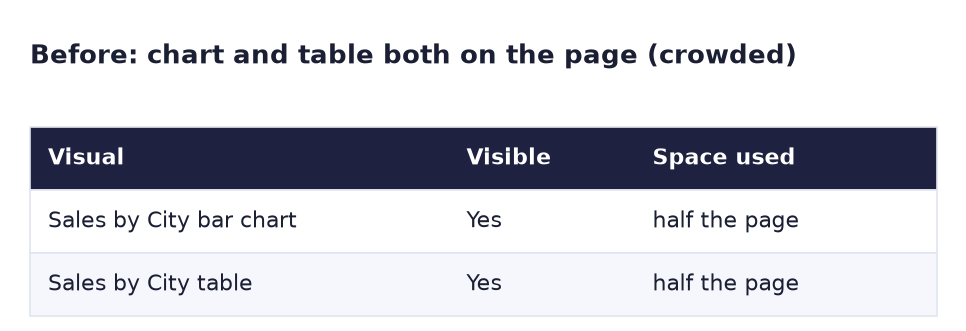
Suppose the Croma report page is crowded. The sales director likes the city bar chart; the finance team insists on the table with exact numbers. Both visuals take half the page each. We will put them in the same spot, show one at a time, and let the user switch with two buttons, while any slicer choice (for example Product = Laptop) stays as it is. The numbers are sample data made up for practice.
Goal of this lab
By the end you will have:
- A bar chart and a table of Sales by City stacked in one place.
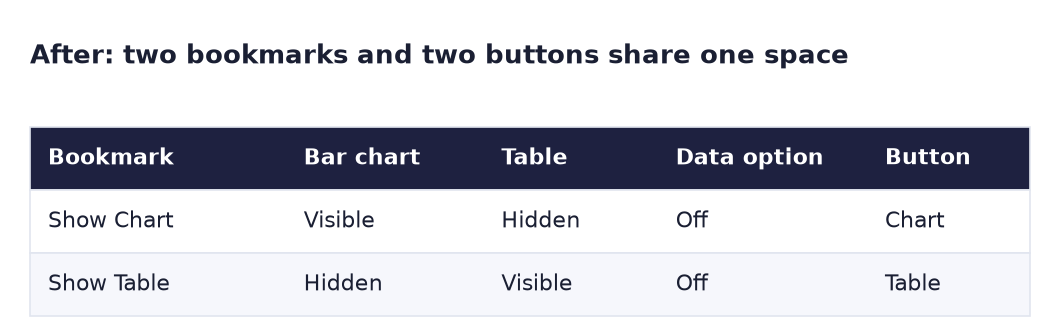
- Two bookmarks, Show Chart and Show Table, with Data turned off.
- Two buttons, Chart and Table, that switch between them and keep the slicer selection.
What you need (all free)
- Power BI Desktop and your
Lab-18-tooltip.pbix(or any file with pbi_cities, pbi_products and Total Sales). - Sample data if you need to rebuild: Download pbi_sales.csv (24 orders) Download pbi_cities.csv
- 30 minutes.
The data: before and after
Before. Two visuals showing the same thing, each eating half the page.
After. Two bookmarks and two buttons share one space.
The formula
No DAX. A bookmark is a saved snapshot of the page. You choose what it remembers:
| Bookmark option | What it remembers | For our toggle |
|---|---|---|
| Data | Filters, slicer choices, sort order, drill level | Off, so the user's Laptop choice is not reset |
| Display | Which visuals are visible or hidden (Selection pane) | On: this is the whole toggle |
| Current page | Which page to open | On |
A button with Action → Bookmark simply applies a bookmark when it is clicked.
Steps
- Open your Lab 18 file, Save as
Lab-19-bookmarks, and add a new page called Toggle. - Add a Clustered bar chart (pbi_cities[City], Total Sales) and a Table (City, Total Sales). Give both the same size and position: select each one and set Format → General → Properties → Size and position to the same numbers, for example X 40, Y 120, Width 600, Height 400.
- Add a Slicer with pbi_products[Product] on the left of the page.
- Click View → Selection and View → Bookmarks. Two panes open on the right.
-
In the Selection pane, double-click each visual name and rename them
City chart,City tableandProduct slicer.What you should see: three names with an eye icon next to each.
-
Click the eye next to City table to hide it. In the Bookmarks pane click Add, then double-click the new bookmark and rename it
Show Chart. - Click the … next to Show Chart and untick Data. Keep Display and Current page ticked.
- Now show City table (eye on) and hide City chart (eye off). Add a bookmark, rename it
Show Tableand untick Data too. - Click Insert → Buttons → Blank. In Format button → Button → Style → Text type
Chart. Under Action, switch it on, set Type to Bookmark and Bookmark to Show Chart. - Make a second button
Tablewith Action → Bookmark → Show Table. Place both buttons above the visual. -
Test: Ctrl+click the Chart button, then the Table button.
What you should see: the chart and the table swap in the same place.
-
In the slicer, click Laptop. Ctrl+click Table, then Chart.
What you should see: both views keep Laptop: Mumbai 250K, Pune 200K, Nagpur 150K, Nashik 150K. The slicer is not reset, because Data is off.
-
Clear the slicer, click Show Chart in the Bookmarks pane so the page opens with the chart, and save.
Ravindra Bagale's Tip
The number one bookmark bug: you update a visual, but the bookmark still remembers the old state. After changing visibility, right-click the bookmark → Update. And always name things in the Selection pane; "Clustered bar chart 3" is impossible to find later. Naav dya, update kara!
Ravindra Bagale's Tip – मराठी
Bookmark चा नंबर एक bug: तुम्ही visual बदलता, पण bookmark ला अजून जुनी स्थिती आठवते. Visibility बदलल्यानंतर bookmark वर right-click करा → Update. आणि Selection pane मध्ये नेहमी नावं द्या; "Clustered bar chart 3" नंतर शोधणं अशक्य असतं. नाव द्या, update करा!
Ravindra Bagale's Tip – हिंदी
Bookmark का नंबर एक bug: आप visual बदलते हो, लेकिन bookmark को अभी भी पुरानी स्थिति याद रहती है। Visibility बदलने के बाद bookmark पर right-click करो → Update। और Selection pane में हमेशा नाम दो; "Clustered bar chart 3" बाद में ढूँढना नामुमकिन है। नाम दो, update करो!
Common mistakes
| Mistake | What happens | Fix |
|---|---|---|
| Data left on in the bookmarks | Clicking a button resets the slicer to what it was when you saved | Untick Data for toggle bookmarks |
| Hiding visuals after adding the bookmark | The bookmark saved the wrong state | Set visibility first, then Add, or right-click → Update |
| Clicking buttons without Ctrl in Desktop | The button is selected for editing instead | Ctrl+click in Desktop |
| Visuals not exactly on top of each other | The page "jumps" when you toggle | Same X, Y, Width, Height in Size and position |
| Bookmark saved with Selected visuals only | Only part of the state applies | Leave All visuals unless you know why |
Self-check checklist
0 of 4 done
Try-at-home challenge
Make the active button look "pressed": when the chart is shown, the Chart button should be dark and the Table button light, and the other way round. Hint: you need two copies of each button and the Selection pane.
Check your answer
Make four buttons: Chart (dark), Chart (light), Table (dark), Table (light). Place the dark and light copies of each button exactly on top of each other. In the Show Chart state, show Chart (dark) and Table (light) and hide the other two; right-click Show Chart → Update. In Show Table, show Table (dark) and Chart (light); Update. Give the light buttons the bookmark actions. Now the dark button always marks the current view.
Samjla ka? Selection pane hides and shows, bookmarks remember it (Data off), buttons apply it. Aata pudhe jaauya: colour bars red or green with DAX and write a dynamic title.