Labs · Power BI
Lab: Combine Three Monthly Bank-Statement CSVs from a Folder and Refresh When a Fourth Month Arrives
Course: Power BI · Chapter 9: Get Data from Folder: Monthly Bank Statements Walkthrough
Chapter 9 walks through Get data from Folder; this lab does it with your own sample statements and a fourth month.
Download bank_statements_jan_mar.zip (Jan–Mar, 3 CSVs) Download bank_2026_04.csv (April, add later)
Chala mitrano! Every month a new statement, every month the same copy-paste into one big sheet. Boring, and one wrong paste spoils everything. Today Power BI does the copy-paste for us: we point it at a folder once, and every new file in that folder joins the report on Refresh. Folder madhe taka, refresh dabaa, kaam khatam!
चला मित्रांनो! दर महिन्याला नवीन statement, दर महिन्याला एका मोठ्या sheet मध्ये तेच copy-paste. कंटाळवाणं, आणि एक चुकीचं paste सगळं बिघडवतं. आज Power BI आपल्यासाठी copy-paste करेल: एकदाच folder दाखवायचा, आणि त्या folder मधली प्रत्येक नवीन file Refresh वर report मध्ये येते. Folder मध्ये टाका, refresh दाबा, काम खतम!
चलो दोस्तों! हर महीने नया statement, हर महीने एक बड़ी sheet में वही copy-paste। बोरिंग, और एक गलत paste सब बिगाड़ देता है। आज Power BI हमारे लिए copy-paste करेगा: एक बार folder दिखाओ, और उस folder की हर नई file Refresh पर report में आ जाती है। Folder में डालो, refresh दबाओ, काम खत्म!
Suppose we are…
Suppose we are a young software engineer at Infosys in Pune who wants to track monthly spending. Our bank (for example HDFC or SBI) lets us download each month's statement as a CSV. We have January, February and March 2026. April's file will come next month, and we do not want to rebuild anything when it does.
The statements are sample data made up for practice: a salary credit, rent, a Swiggy order, the MSEDCL electricity bill, an Amazon purchase and a mutual fund SIP each month. No real account details are used.
Goal of this lab
By the end you will have:
- One table Bank with 18 rows from 3 files, plus a Source.Name column telling which file each row came from.
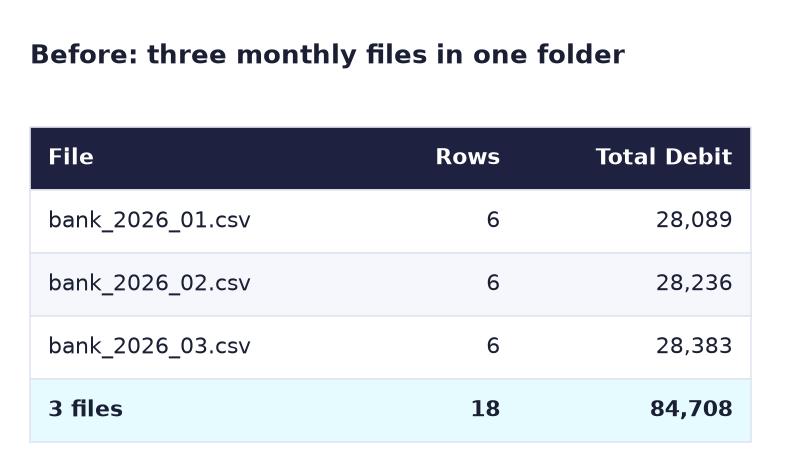
- A measure Total Debit by month: 28,089, 28,236 and 28,383.
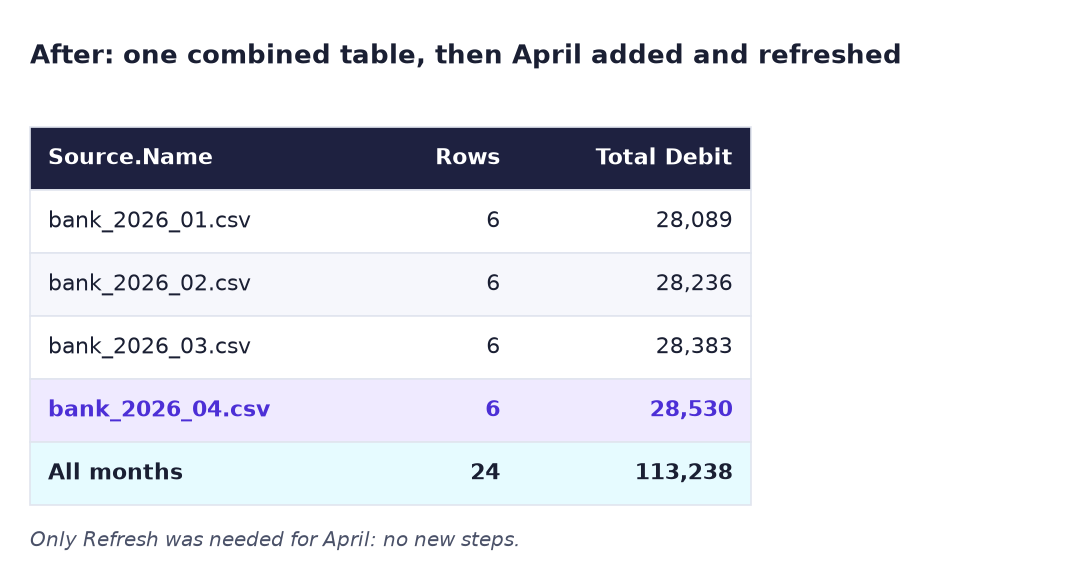
- Added April by copying one file into the folder and clicking Refresh: 24 rows, Total Debit 113,238.
What you need (all free)
- Power BI Desktop on Windows.
- Download bank_statements_jan_mar.zip (Jan–Mar, 3 CSVs)
- Download bank_2026_04.csv (April, add later)
- 30 minutes.
The data: before and after
Before. Three separate files of 6 rows each in one folder.
After. One combined table. When April is dropped into the folder, one Refresh adds it.
The formula
When you click Combine & Transform, Power Query writes these main steps for you:
Source                  = Folder.Files("C:\PowerBI\BankStatements")
Filtered Hidden Files1  = Table.SelectRows(Source, each [Attributes]?[Hidden]? <> true)
Invoke Custom Function1 = Table.AddColumn(#"Filtered Hidden Files1", "Transform File", each #"Transform File"([Content]))
Expanded Table Column1  = Table.ExpandTableColumn(#"Removed Other Columns1", "Transform File", …)
In plain words:
Folder.Filesmakes a list of every file in the folder, one row per file.Transform Fileis a small function built from the first file. It reads one CSV and promotes its headers.- The function runs on every file, and Expand stacks the results under each other.
So when April arrives, Folder.Files simply finds 4 files instead of 3. Nothing else changes.
And the one DAX line:
Total Debit = SUM ( Bank[Debit] )
Steps
-
Create the folder
C:\PowerBI. Right-clickbank_statements_jan_mar.zip→ Extract All…, set the destination toC:\PowerBIand click Extract. Leavebank_2026_04.csvin Downloads for now.What you should see:
C:\PowerBI\BankStatementswith three files: bank_2026_01.csv, bank_2026_02.csv, bank_2026_03.csv. -
In Power BI Desktop: Home → Get data → More… → Folder → Connect. Browse to
C:\PowerBI\BankStatementsand click OK.What you should see: a window listing the 3 files with columns such as Name, Extension and Date modified.
-
Click Combine & Transform Data. In the Combine Files window keep Sample File: First file and check Delimiter: Comma. Click OK.
What you should see: a query called BankStatements with columns Source.Name, Date, Description, Debit, Credit, Balance and 18 rows. On the left there is a new group, Transform File from BankStatements, with helper queries. Do not delete them.
-
Check the types. Date must have the calendar icon; Debit, Credit and Balance must show 123. If any is ABC, click the icon and choose Whole Number.
What you should see: empty Debit or Credit cells show null, for example the Credit of the Rent rows.
-
Rename the query to Bank (right-click → Rename) and click Home → Close & Apply.
- Right-click Bank in the Data pane → New measure:
Total Debit = SUM ( Bank[Debit] ). -
Make a Table visual with Source.Name and Total Debit.
What you should see: bank_2026_01.csv 28,089, bank_2026_02.csv 28,236, bank_2026_03.csv 28,383, Total 84,708.
-
Save as
Lab-09-bank-folder. Now April arrives: copybank_2026_04.csvfrom Downloads intoC:\PowerBI\BankStatements. -
In Power BI, click Home → Refresh.
What you should see: a fourth row, bank_2026_04.csv 28,530, and Total 113,238. Table view shows Bank (24 rows). You added no step.
-
Add a Card with Total Debit and a Slicer with Description. Click Swiggy - UPI.
What you should see: the card shows 2,782 (640 + 677 + 714 + 751): Swiggy spending went up every month.
-
Save again.
Ravindra Bagale's Tip
Keep the folder clean. Only same-shaped CSVs in it: no Excel copies, no PDFs, no "final_v2" files. One wrong file and the refresh fails or adds strange rows. Many teams make a rule: one folder, one file type, one format. Folder swachh, report swachh!
Ravindra Bagale's Tip – मराठी
Folder clean ठेवा. त्यात फक्त एकाच format च्या CSVs: Excel copies नाही, PDFs नाही, "final_v2" files नाही. एक चुकीची file आणि refresh fail होतो किंवा विचित्र rows येतात. बऱ्याच teams नियम करतात: एक folder, एक file type, एक format. Folder स्वच्छ, report स्वच्छ!
Ravindra Bagale's Tip – हिंदी
Folder साफ रखो। उसमें सिर्फ एक ही format की CSVs: Excel copies नहीं, PDFs नहीं, "final_v2" files नहीं। एक गलत file और refresh fail होता है या अजीब rows आ जाती हैं। बहुत सी teams नियम बनाती हैं: एक folder, एक file type, एक format। Folder साफ, report साफ!
Common mistakes
| Mistake | What happens | Fix |
|---|---|---|
| Choosing the zip file itself in Get data | Power BI cannot combine a zip | Extract it first, then point at the folder |
Extracting to C:\PowerBI\BankStatements |
You get BankStatements\BankStatements\… |
Extract to C:\PowerBI; the zip already has the BankStatements folder |
| Deleting the helper queries | Refresh fails: "Transform File wasn't recognized" | Keep the Transform File from… group |
| Putting a PDF or Excel file in the folder | Refresh error or junk rows | In the Source step, filter Extension to .csv |
| Clicking Combine & Load and forgetting to check types | Debit may load as text and cannot be summed | Use Combine & Transform and check the 123 icons |
Renaming April to bank_april.csv |
It still loads, but the names no longer sort by month | Keep one naming pattern: bank_YYYY_MM.csv |
Self-check checklist
0 of 5 done
Try-at-home challenge
Source.Name is ugly in a chart. Make a proper Month column instead and show Total Debit by month in a column chart. Hint: in Power Query, select the Date column and use Add Column → Date → Month → Name of Month.
Check your answer
The new column shows January, February, March, April. In the chart, sort it by month order, not A–Z: add another column with Add Column → Date → Month → Month (1 to 4), then in Table view select the Month name column and use Column tools → Sort by column → Month (the number column). The columns read 28,089, 28,236, 28,383 and 28,530: spending creeps up by about 147 every month, mostly from Swiggy and electricity.
Samjla ka? Folder.Files lists the files, Transform File cleans one, Expand stacks them all, and Refresh picks up new months. Aata pudhe jaauya: turn a hard-coded file path into a parameter.