Labs · Power BI
Lab: Find the Slowest Visual with Performance Analyzer and Make It Faster
Course: Power BI · Chapter 27: Performance Tips
Chapter 27 lists performance tips; this lab practises the first step of every tuning job: measure, then fix.
Chala mitrano! When a report is slow, beginners start changing random things. Professionals first measure: which visual is slow, and is it the DAX or the drawing? Performance Analyzer gives you a stopwatch for every visual. Today we plant a slow measure on purpose, catch it, and fix it. Aadhi mojaa, mag sudhara!
चला मित्रांनो! Report slow असला की beginners random गोष्टी बदलायला लागतात. Professionals आधी मोजतात: कोणता visual slow आहे, आणि DAX मुळे की drawing मुळे? Performance Analyzer प्रत्येक visual साठी stopwatch देतो. आज आपण मुद्दाम एक slow measure लावू, त्याला पकडू, आणि सुधारू. आधी मोजा, मग सुधारा!
चलो दोस्तों! Report slow हो तो beginners random चीज़ें बदलने लगते हैं। Professionals पहले नापते हैं: कौन सा visual slow है, और वजह DAX है या drawing? Performance Analyzer हर visual के लिए stopwatch देता है। आज हम जानबूझकर एक slow measure लगाएंगे, उसे पकड़ेंगे, और ठीक करेंगे। पहले नापो, फिर सुधारो!
Suppose we are…
Suppose the Croma report takes several seconds to open and the director complains. Our 24-row sample is too small to be slow by itself, so we simulate a badly written measure, the kind that on a real 50-million-row table makes a page crawl. Then we do what a performance engineer does: record, find the slowest visual, understand why, fix, and record again. The numbers are sample data made up for practice.
Goal of this lab
By the end you will have:
- Recorded a page with Performance Analyzer and sorted visuals by duration.
- Identified the slow visual and seen that its time is in DAX query, not in Visual display.
- Replaced the slow measure and recorded a big improvement.
What you need (all free)
- Power BI Desktop and a file with pbi_sales, pbi_cities and Total Sales (Lab 11 or later).
- Sample data if you need to rebuild: Download pbi_sales.csv (24 orders) Download pbi_cities.csv
- 30 minutes.
The data: before and after
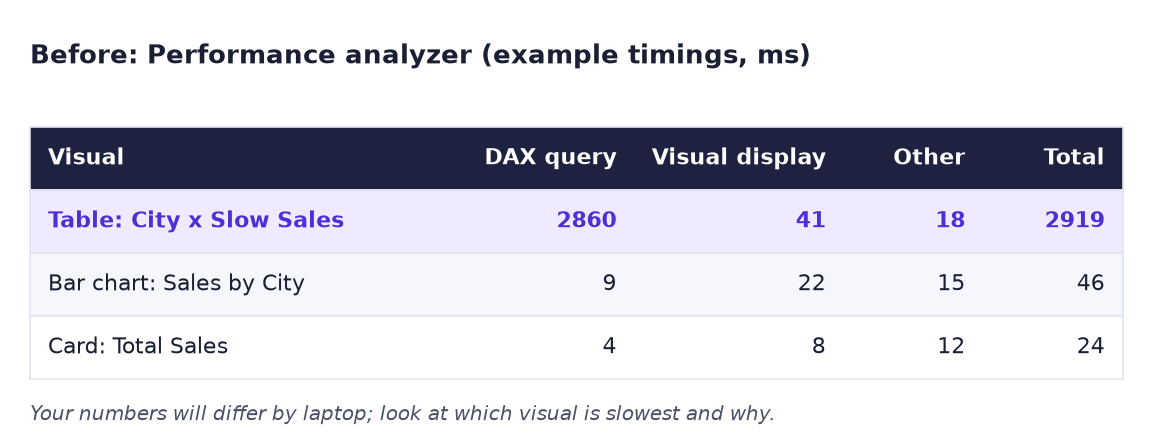
Before. Example Performance Analyzer results: one visual takes almost 3 seconds, nearly all in the DAX query.
After. The slow measure replaced: the same table loads in under 0.1 seconds.
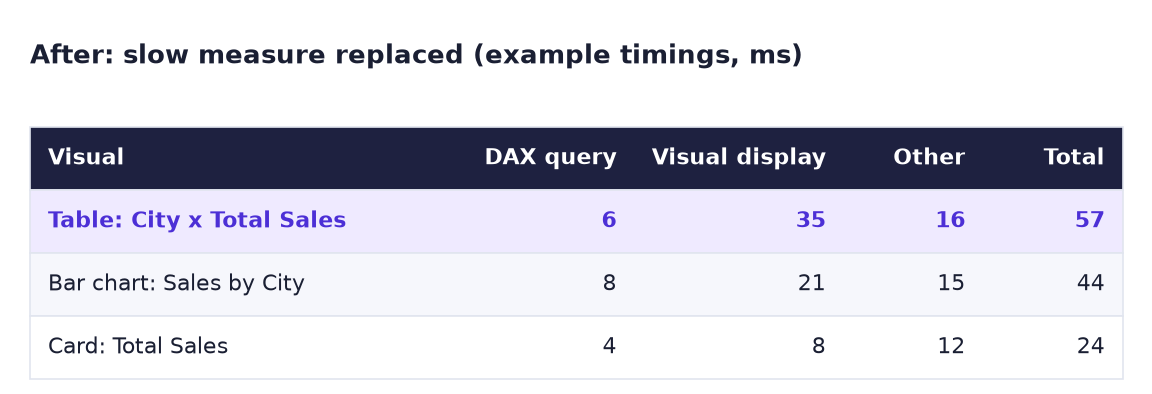
These are example timings from one laptop. Yours will be different; what matters is which visual is slowest and where its time goes.
The formula
The deliberately slow measure:
Slow Sales =
VAR _busywork = SUMX ( GENERATESERIES ( 1, 3000000 ), MOD ( [Value], 7 ) )
RETURN [Total Sales] + 0 * _busywork
GENERATESERIES ( 1, 3000000 ) builds a 3-million-row table and SUMX loops over it, for every cell of the visual. The answer is the same as Total Sales (0 × anything = 0), but the work is huge. In real reports the same pattern appears as SUMX or FILTER over a whole big fact table when a simple SUM or a CALCULATE filter would do.
The fix:
Total Sales = SUM ( pbi_sales[Sales] )
How to read Performance Analyzer:
| Line | Meaning | If it is big… |
|---|---|---|
| DAX query | Time for the engine to calculate the numbers | Simplify measures, reduce rows/columns, check the model |
| Visual display | Time to draw the visual | Fewer data points, simpler visual, fewer visuals per page |
| Other | Waiting for other visuals or background work | Usually too many visuals on one page |
Steps
- Open your file, Save as
Lab-27-performanceand add a page Perf test. - Right-click pbi_sales → New measure and paste the Slow Sales measure.
-
Add a Card (Total Sales), a Bar chart (pbi_cities[City], Total Sales) and a Table (pbi_cities[City], Slow Sales).
What you should see: the table takes a moment to appear; its numbers are the same as Total Sales (Mumbai 439,000…).
-
Click View → Performance analyzer. In the pane, click Start recording, then Refresh visuals.
What you should see: one line per visual with a duration in milliseconds.
-
Click the Duration (ms) header to sort, largest first. Expand the top line with the +.
What you should see: the Table at the top, with most of its time in DAX query (often 1 to 5 seconds, depending on your laptop). The card and bar chart take tens of milliseconds.
-
Under the table's entry, click Copy query. Open DAX query view, paste it and click Run. Read the query: you will see Slow Sales inside it. This tells you which measure to look at.
- Back in Report view, select the table and replace Slow Sales with Total Sales.
-
In Performance analyzer, click Clear, then Refresh visuals again and sort by duration.
What you should see: the table now takes about as long as the bar chart (tens of milliseconds). The slow measure is gone from the page.
-
Click Stop. Delete the Slow Sales measure (right-click → Delete from model). Save.
Ravindra Bagale's Tip
Five checks before anything clever: turn off Auto date/time, remove columns you never use, keep a star schema, prefer SUM and CALCULATE over SUMX and FILTER on big tables, and keep each page under about 8 to 10 visuals. Most slow reports are fixed by these five. Saadha model, vegaane report!
Ravindra Bagale's Tip – मराठी
काहीही हुशारी करण्याआधी पाच checks: Auto date/time बंद करा, कधीच न वापरलेले columns काढा, star schema ठेवा, मोठ्या tables वर SUMX आणि FILTER पेक्षा SUM आणि CALCULATE वापरा, आणि प्रत्येक page वर साधारण 8 ते 10 पेक्षा कमी visuals ठेवा. बहुतेक slow reports या पाचांनीच सुधारतात. साधं model, वेगाने report!
Ravindra Bagale's Tip – हिंदी
कुछ भी चालाकी करने से पहले पाँच checks: Auto date/time बंद करो, कभी न इस्तेमाल होने वाले columns हटाओ, star schema रखो, बड़ी tables पर SUMX और FILTER की जगह SUM और CALCULATE इस्तेमाल करो, और हर page पर लगभग 8 से 10 से कम visuals रखो। ज़्यादातर slow reports इन्हीं पाँच से ठीक होती हैं। सादा model, तेज़ report!
Common mistakes
| Mistake | What happens | Fix |
|---|---|---|
| Recording without clicking Refresh visuals | Only the visuals you happen to click are timed | Start recording, then Refresh visuals |
| Comparing one run with another without Clear | Old and new lines mix | Clear before each test |
| Blaming the visual type when DAX query is the big number | You redesign the chart, nothing improves | Fix the measure or the model first |
| Testing once only | The first run can be slower (cold cache) | Refresh visuals twice and compare the second run |
| Leaving the Slow Sales measure in the file | Someone reuses it later | Delete it after the lab |
Self-check checklist
0 of 5 done
Try-at-home challenge
Turn off Auto date/time for this file (File → Options and settings → Options → Current file → Data load). Compare the file size before and after saving. Why does a file with only 24 rows still change size?
Check your answer
With Auto date/time on, Power BI creates a hidden date table for every date column (OrderDate, and Date in DateTable), each covering whole years. Turning it off removes those hidden tables, so the .pbix gets a little smaller and the model has fewer objects. On real models with many date columns the saving is much bigger, and the field list becomes cleaner. You already have your own DateTable, so you lose nothing.
Samjla ka? Measure first: DAX query vs Visual display tells you where to fix. Aata pudhe jaauya: the Blinkit quick-commerce mini project, from raw CSV to report.