12. Data Hierarchies and Groups
12.7 Groups vs Calculated Columns vs Hierarchies
Start with a problem
Salman is asked for three things: Fresh vs Packaged, delivery bands 0–10 / 11–20 minutes, and a Region › City › Store drill. Which tool fits each?
Explain simply
Group: combine a few values, no code. Calculated column: any row rule, including unequal limits and blanks. Hierarchy: a drill path.
Show the data
| Need | Values involved |
|---|---|
| Fresh vs Packaged | Dairy, Fruits, Snacks |
| Delivery band 0–10 / 11–20 / Not delivered | Delivery Mins (7 to 16, one blank) |
| Region › City › Store drill | DarkStore columns |
About this data: This table uses columns: Need, Values involved. This table uses columns: Category (groups), Total Sales (₹). This table uses columns: Delivery Band, Orders. This table uses columns: Need, Tool, Why. Values shown are the lesson examples already on this page (not a new dataset).
Fictional sample data. Practice file: visuals_orders_apr_may_2026.csv, dark_stores_maharashtra.csv (source: src/practice/).
Demonstrate
-
Fresh vs Packaged, then list group on Category (12.5).
Your result should look like this:
Category (groups) Total Sales (₹) Fresh 1,450 Packaged 650 -
Delivery band, then calculated column:
Delivery Band = SWITCH(TRUE(), ISBLANK(Orders[Delivery Mins]), "Not delivered", Orders[Delivery Mins] <= 10, "0-10 min", "11-20 min").Your result should look like this:
Delivery Band Orders 0-10 min 3 11-20 min 4 Not delivered 1 -
Drill, then hierarchy Location (12.2).
Your result should look like this:
Location Region › City › Store
Show the result
Your result should look like this (fictional sample):
| Need | Tool | Why |
|---|---|---|
| Fresh vs Packaged | List group | Few values, no code |
| Delivery bands with custom limits | Calculated column (or Power Query column) | Unequal limits and a blank rule |
| Region › City › Store | Hierarchy | Drill path |
Explain what happened
Each tool matched the shape of the need. The ISBLANK test comes first because in DAX a blank compared with <= 10 is TRUE, so the cancelled order would otherwise land in 0-10 min.
Explore further
- In Power Query (M) the order matters too:
null <= 10returns null, so test for null first there as well.
Detailed reference for this lesson:
| Group (list/bin) | Calculated column / Power Query column | Hierarchy | |
|---|---|---|---|
| Purpose | Combine values into categories | Any row-level logic | Drill from general to detailed |
| Created with | Right-click › New group (no code) | DAX SWITCH / M conditional column |
Right-click › Create hierarchy |
| Flexibility | Simple membership or equal-width ranges | Unlimited (conditions, other columns, other tables) | Only orders existing columns |
| Maintenance | Easy for business users; dialog-based | Needs formula edits (or a mapping table) | Easy |
| Example | Region (West, Vidarbha …); Delivery time bins of 5 | Delivery Speed Band with custom limits 0–10, 11–15, 16–30, 30+ | State › City › Area › Store |
| Use in hierarchy? | Yes (a group can be a level, e.g. Region › City) | Yes | – |
Combine them
Mhanje asa: create the Region group, then build a hierarchy Region › City › Area › Store Name. Now a map or matrix can drill from West to Pune to Kothrud.
Practice task
Implement Region twice, once as a group and once as a DAX calculated column with SWITCH. Compare the results and write two lines on which one you would hand over to a business user.
Ravindra Bagale's Tip
Friends, many students use groups for logic that changes every month, and then edit the group by hand each time. Use a group for quick, stable buckets. Use a Power Query mapping table or a calculated column when the rules are complex, need documenting or must be reused in other reports. Don't worry – after doing it two or three times, it becomes a habit.
Ravindra Bagale's Tip – मराठी
मित्रांनो, बरेच students दर महिन्याला बदलणाऱ्या logic साठी groups वापरतात, आणि मग प्रत्येक वेळी group हाताने edit करतात. पटकन बनणाऱ्या, स्थिर buckets साठी group वापरा. Rules complex असतील, document करायचे असतील किंवा इतर reports मध्ये पुन्हा वापरायचे असतील तर Power Query mapping table किंवा calculated column वापरा. घाबरू नका, दोन-तीन वेळा केलं की सवय होते.
Ravindra Bagale's Tip – हिंदी
दोस्तों, बहुत से students हर महीने बदलने वाले logic के लिए groups इस्तेमाल करते हैं, और फिर हर बार group को हाथ से edit करते हैं. जल्दी बनने वाले, स्थिर buckets के लिए group इस्तेमाल करो. Rules complex हों, document करने हों या दूसरी reports में दोबारा इस्तेमाल करने हों तो Power Query mapping table या calculated column इस्तेमाल करो. घबराओ मत, दो-तीन बार करने पर आदत हो जाती है.
Fix common mistakes
| Wrong result | Reason | Correction |
|---|---|---|
| The cancelled order counted as 0-10 min | DAX treats BLANK <= 10 as TRUE | Test ISBLANK first |
| Bins give 5–9, 10–14 instead of 0–10 | Bins used for unequal business bands | Use a calculated column |
| A hierarchy built for Fresh/Packaged | Wrong tool for buckets | Use a group |
Practise independently
Practice task
For delivered orders in the 0-10 min band, what are the total sales and the share of delivered orders?
Hints
- 0-10 min: orders 301, 304, 305.
Solution
₹400 + ₹150 + ₹450 = ₹1,000; 3 of 7 delivered orders = 42.9%.
Think like a professional
Choose the simplest tool the next person can maintain, and write the grouping rules where business users can read them.
Thodkyaat sangaycha tar (quick recap)
A hierarchy is a drill path; a group is a set of buckets. Keep all levels in one table, do not forget the Other group, and clean outliers (values far away from the rest) before you make bins. Now let us move on – DAX, the "brain" of Power BI!
Hierarchy म्हणजे drill path, group म्हणजे buckets. सगळे levels एकाच table मध्ये हवेत, Other group विसरू नका, आणि bins बनवण्याआधी outliers (बाकीच्यांपेक्षा खूप वेगळी, असामान्य values) साफ करा. आता पुढे जाऊया – DAX, म्हणजे Power BI चा "brain"!
Hierarchy यानी drill path, group यानी buckets. सारे levels एक ही table में हों, Other group मत भूलिए, और bins बनाने से पहले outliers (बाक़ी से बहुत अलग, असामान्य values) साफ़ कीजिए. अब आगे बढ़ते हैं – DAX, यानी Power BI का "brain"!
Loading DAX practice tasks...
- Seat band (Easy): Calculated column on Subscriptions: Size = "Large" for 25 seats or more, else "Small".
- Monthly value per subscription (Easy): Calculated column on Subscriptions: Line MRR = Seats × PricePerSeat.
- Start quarter (Easy): Calculated column on Subscriptions: Start Qtr = "Q" and the quarter number of StartDate.
- Sales region (Medium): Calculated column on Accounts: Region = "Americas" for USA, Canada and Chile, "APAC" for India and Australia, else "EMEA".
- Price tier (Medium): Calculated column on Subscriptions: Tier = "Premium" for price 90 or more, "Standard" for 40 or more, else "Entry".
- Americas MRR (Medium): Measure: Americas MRR = [MRR] for Country in USA, Canada and Chile.
- Subscriptions per industry (Medium): Shown per Industry. Measure: Subs = number of Subscriptions rows.
- Large subscriptions per plan (Hard): Shown per Plan. Measure: Large Subs = number of rows with Seats 25 or more.
- Average seats per country (Hard): Shown per Country. Measure: Avg Seats = average of Seats.
- APAC share of MRR (Hard): Measure: APAC Share = [MRR] for India and Australia ÷ [MRR].
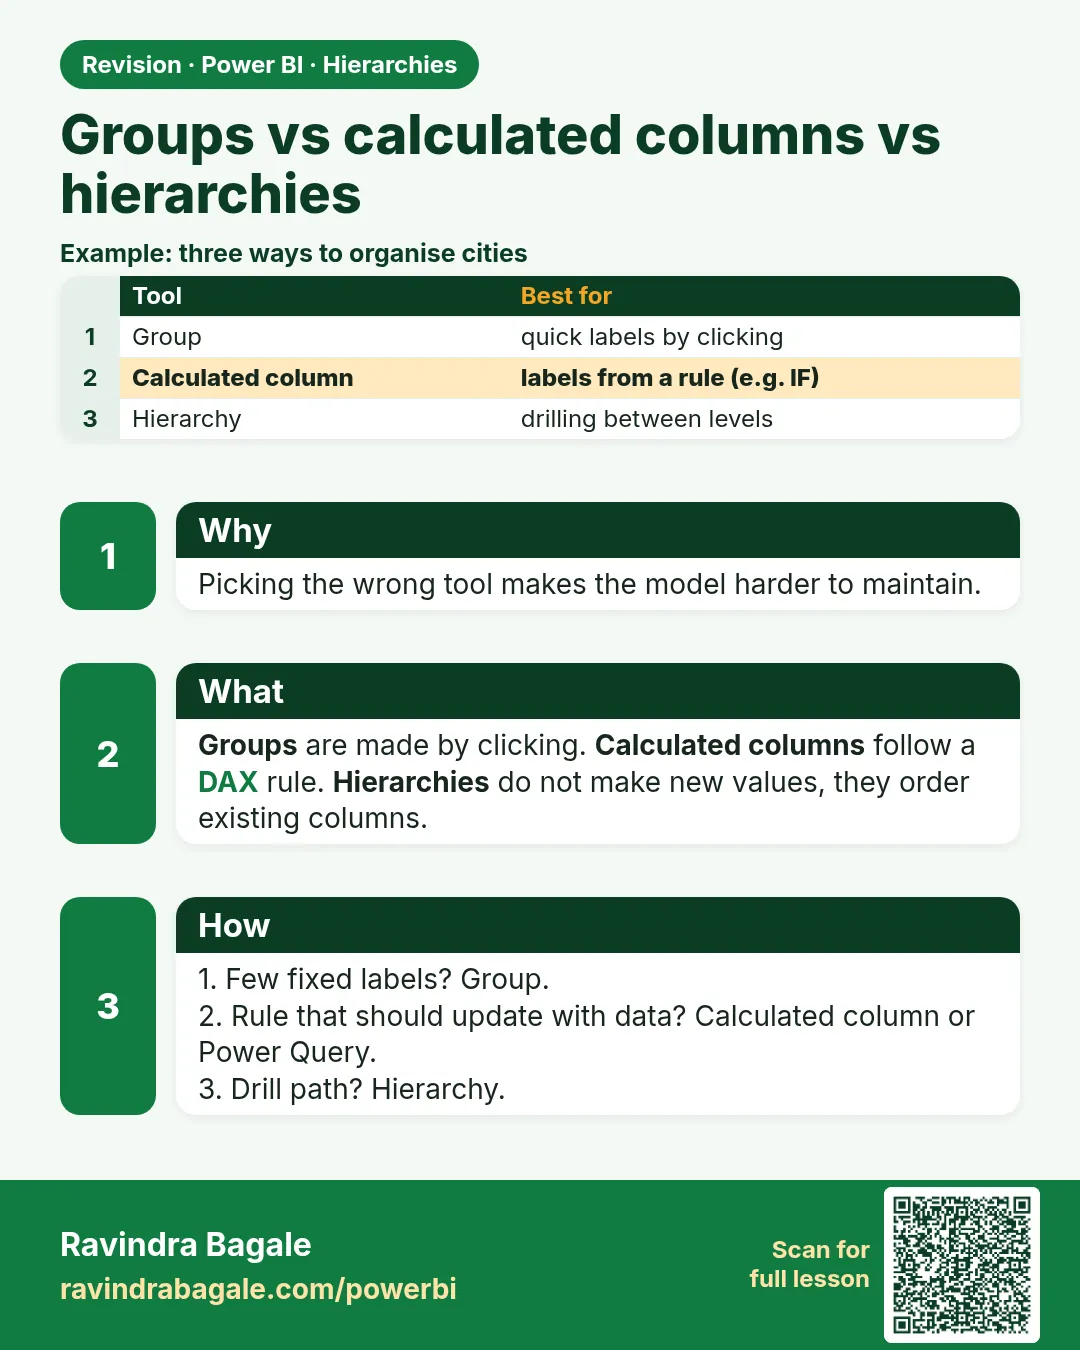 Revision card
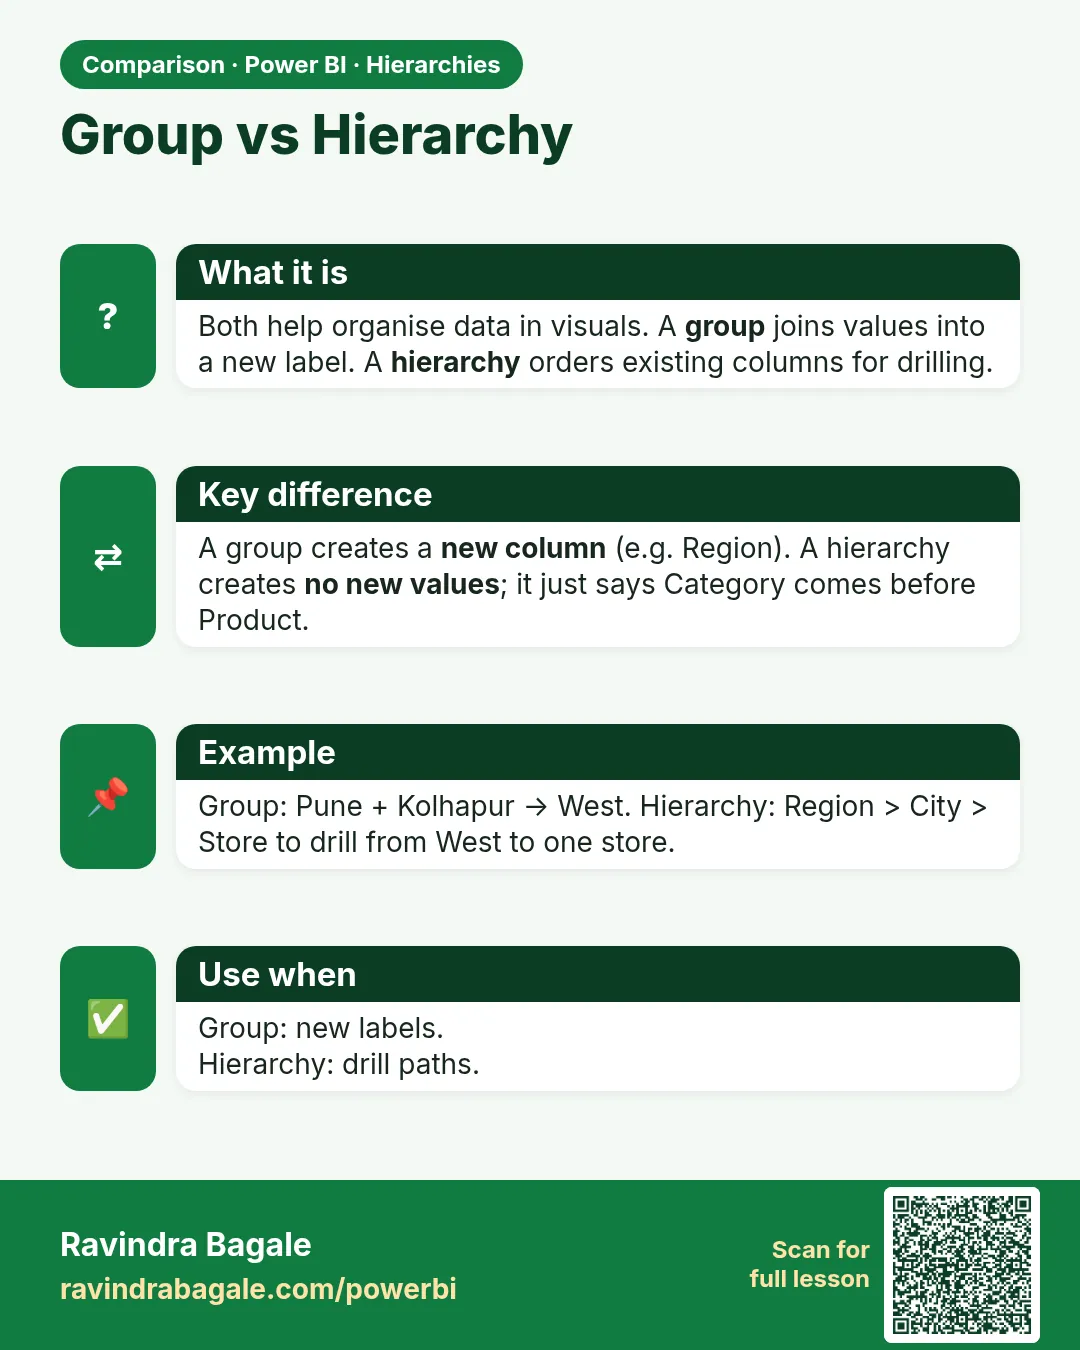 Comparison card