12. Data Hierarchies and Groups
12.1 What Is a Hierarchy?
In short: A hierarchy is an ordered set of columns (Region → City → Store) that visuals can drill down through.
Quick answer: the short, self-contained version of this lesson is the guide Power BI Hierarchy and Drill Down.
Start with a problem
Rani wants to start at region level, then open a region to see cities and stores, without three separate charts.
Explain simply
A hierarchy is an ordered set of columns (Region → City → Store) that visuals can drill down through.
Show the data
| Region | City | Store | Total Sales (₹) |
|---|---|---|---|
| West Maharashtra | Pune | Kothrud | 650 |
| West Maharashtra | Pune | Baner | 200 |
| North Maharashtra | Nashik | College Road | 500 |
| North Maharashtra | Nashik | Gangapur | 300 |
| South Maharashtra | Kolhapur | Rajarampuri | 450 |
About this data: This table uses columns: Region, City, Store, Total Sales (₹). This table uses columns: Level, Item, Total (₹). This table uses columns: Hierarchy, Levels, Example path. This table uses columns: Wrong result, Reason, Correction. Values shown are the lesson examples already on this page (not a new dataset).
Fictional sample data. Practice file: dark_stores_maharashtra.csv, visuals_orders_apr_may_2026.csv (source: src/practice/).
Demonstrate
- Data pane › DarkStores › right-click Region › Create hierarchy.
- Drag City and Store into the hierarchy.
- Matrix: Rows = Region hierarchy, Values = Total Sales.
- Click + next to West Maharashtra.
Show the result
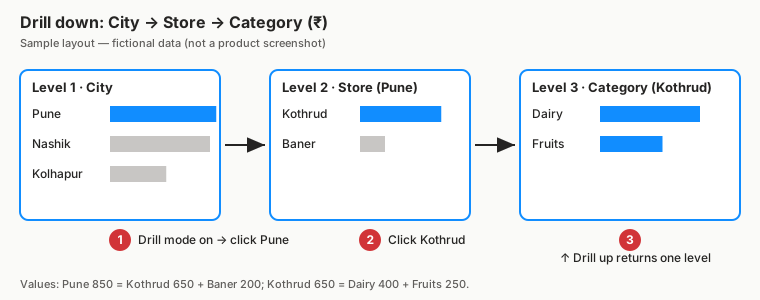
Your result should look like this (fictional sample):
| Level | Item | Total (₹) |
|---|---|---|
| Region | West Maharashtra | 850 |
| City | Pune | 850 |
| Store | Kothrud | 650 |
| Store | Baner | 200 |
Explain what happened
Each level is grouped under its parent, and totals roll up.
Explore further
- Module 16 covers drill buttons on charts.
Detailed reference for this lesson:
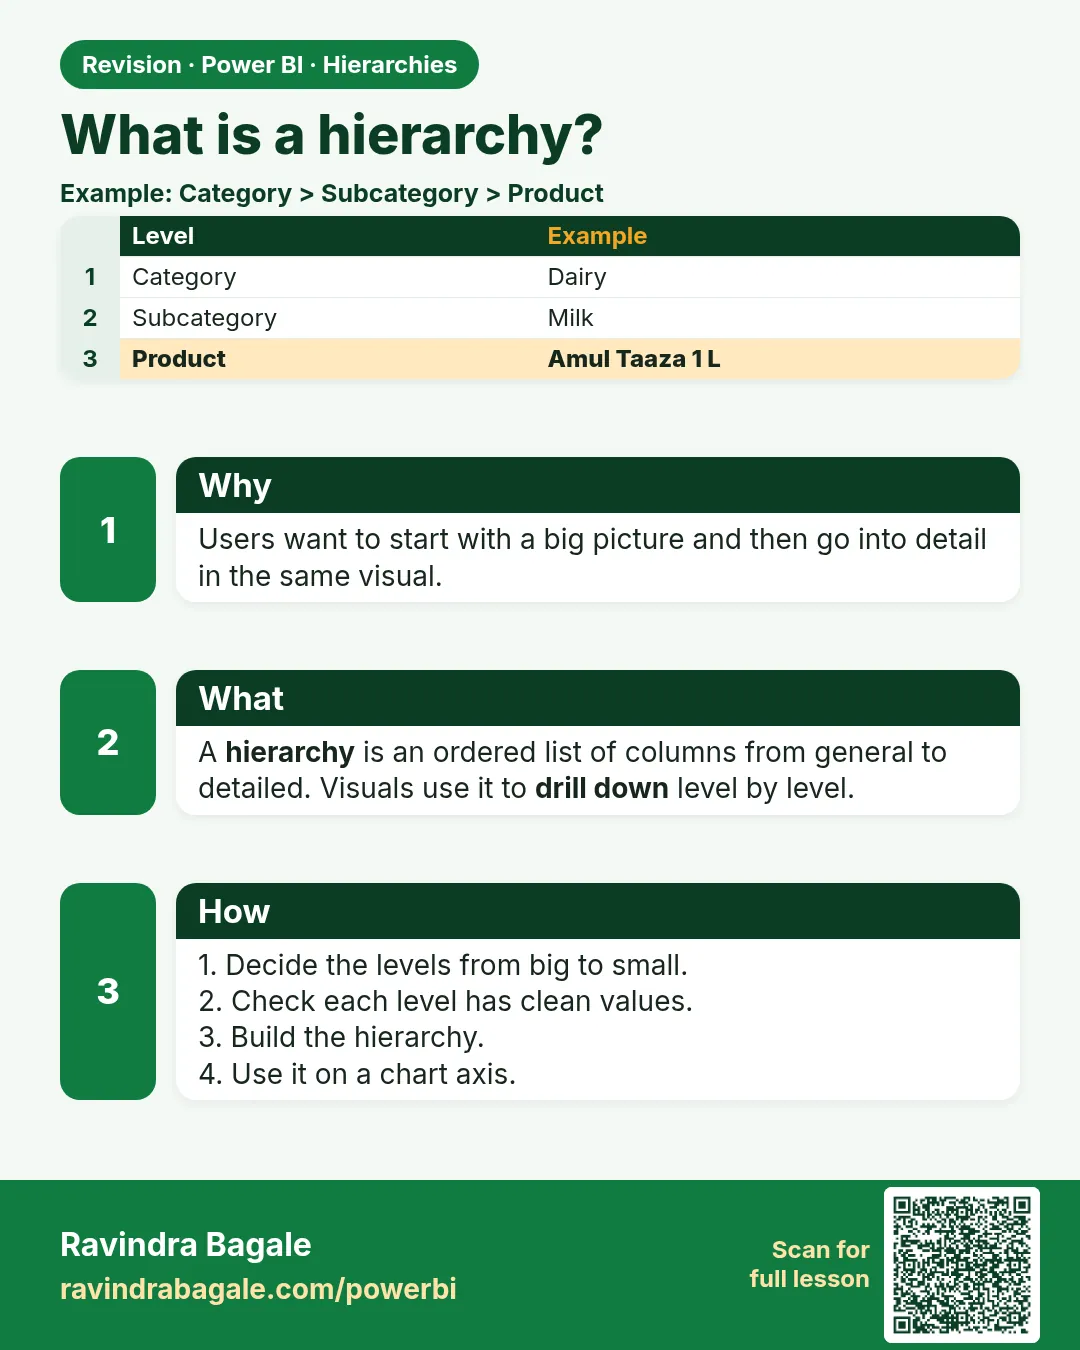
A hierarchy (श्रेणीरचना) is an ordered set of columns from the same table, from general to detailed. Users can drill down from a higher level to a lower one (Module 16).
| Hierarchy | Levels | Example path |
|---|---|---|
| Date (Date table) | Year › Quarter › Month › Day | 2025 › Q4 › October › 20 |
| Location (DarkStore) | State › City › Area › Store Name | Maharashtra › Pune › Kothrud › Blinkit Kothrud Hub |
| Product (Product) | Category › Sub Category › Product Name | Fruits & Vegetables › Fresh Fruits › Nashik Grapes 500 g |
Simple bhashet sangaycha tar, levels must be in one table. That is one reason why dimension tables such as DarkStore contain State, City and Area together (star schema, Module 11).
Ravindra Bagale's Tip
Friends, many students confuse a hierarchy with a group. A hierarchy is a drill path (State › City › Area › Store). A group combines values into buckets (Pune + Mumbai = West). Use the right tool, and you can combine them, for example Region › City.
Ravindra Bagale's Tip – मराठी
मित्रांनो, बरेच students hierarchy आणि group मध्ये गोंधळ करतात. Hierarchy म्हणजे drill path (State › City › Area › Store). Group values ना buckets मध्ये एकत्र करतो (Pune + Mumbai = West). योग्य tool वापरा, आणि दोन्ही एकत्र पण वापरू शकता, उदाहरणार्थ Region › City.
Ravindra Bagale's Tip – हिंदी
दोस्तों, बहुत से students hierarchy और group में उलझ जाते हैं. Hierarchy एक drill path है (State › City › Area › Store). Group values को buckets में जोड़ता है (Pune + Mumbai = West). सही tool इस्तेमाल करो, और दोनों को साथ भी जोड़ सकते हो, जैसे Region › City.
Fix common mistakes
| Wrong result | Reason | Correction |
|---|---|---|
| Store totals don't add up | Stores in two cities with the same name | Use unique store IDs |
| Wrong order (City above Region) | Hierarchy order | Drag to reorder |
| Hierarchy from Orders text columns | Dimension better | Build it in DarkStores |
Practise independently
Practice task
Expand North Maharashtra. Show the stores and totals.
Hints
- Nashik stores.
Solution
Nashik ₹800: College Road ₹500, Gangapur ₹300.
Think like a professional
Hierarchies support top-down storytelling: start high, drill to the cause.
 Revision card