Labs · Power BI
Lab: Create a Year › Quarter › Month Hierarchy and Group Cities into Regions
Course: Power BI · Chapter 12: Data Hierarchies and Groups
Chapter 12 explains hierarchies and groups; this lab builds one of each on the star-schema model.
Download pbi_sales.csv (24 orders) Download pbi_products.csv Download pbi_cities.csv
Chala mitrano! Managers think in levels: "How was the year? Which quarter was weak? Which month in that quarter?" A hierarchy gives them exactly that path in one visual. And groups let you make your own categories, like zones, with a few clicks and no formula. Today both, in 25 minutes. Varun khali, sagla spashta!
चला मित्रांनो! Managers levels मध्ये विचार करतात: "वर्ष कसं गेलं? कोणता quarter कमजोर होता? त्या quarter मधला कोणता महिना?" Hierarchy त्यांना एकाच visual मध्ये हाच मार्ग देते. आणि groups मुळे तुम्ही स्वतःच्या categories, जसं zones, काही clicks मध्ये बनवू शकता, formula शिवाय. आज दोन्ही, 25 मिनिटांत. वरून खाली, सगळं स्पष्ट!
चलो दोस्तों! Managers levels में सोचते हैं: "साल कैसा रहा? कौन सा quarter कमज़ोर था? उस quarter का कौन सा महीना?" Hierarchy उन्हें एक ही visual में यही रास्ता देती है। और groups से आप अपनी categories, जैसे zones, कुछ clicks में बना सकते हो, बिना formula के। आज दोनों, 25 मिनट में। ऊपर से नीचे, सब साफ!
Suppose we are…
Suppose we are still the BI developer at Croma with the star-schema model from Lab 11. Two requests arrive:
- The CFO wants one matrix that starts at Year and opens into Quarter and Month when she clicks, so she can find the weak quarter herself.
- The sales director has reorganised the team into two zones: West Maharashtra (Mumbai, Pune, Nashik) and Vidarbha (Nagpur). These zones are not in any file yet.
The data is sample data made up for practice.
Goal of this lab
By the end you will have:
- A hierarchy Calendar (Year › Quarter › Month) in DateTable.
- A matrix that expands from 2 years to 6 quarters and then to months.
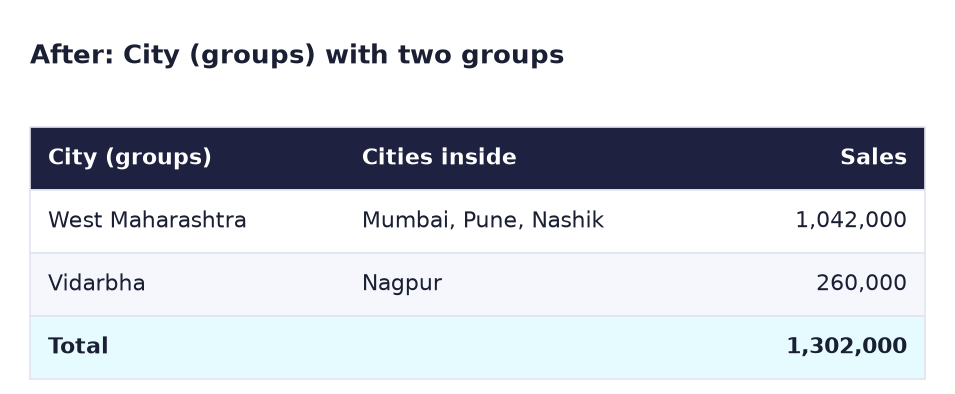
- A group field City (groups) with two zones: West Maharashtra 1,042,000 and Vidarbha 260,000.
What you need (all free)
- Power BI Desktop and your file
Lab-11-star-schema.pbixfrom Lab 11. No file? Do Lab 11 first (40 minutes); the three CSVs are here: - Download pbi_sales.csv (24 orders) Download pbi_products.csv Download pbi_cities.csv
- 25 minutes.
The data: before and after
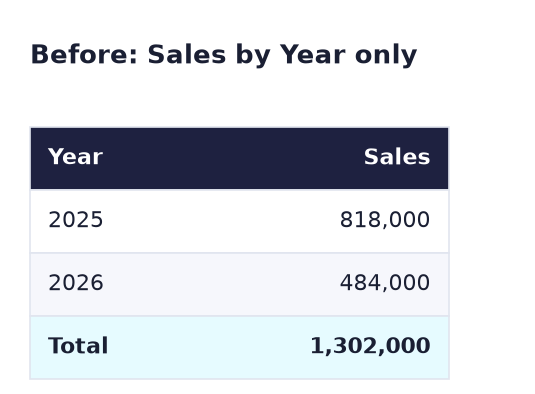
Before. Sales by Year only. The CFO cannot see which quarter was weak.
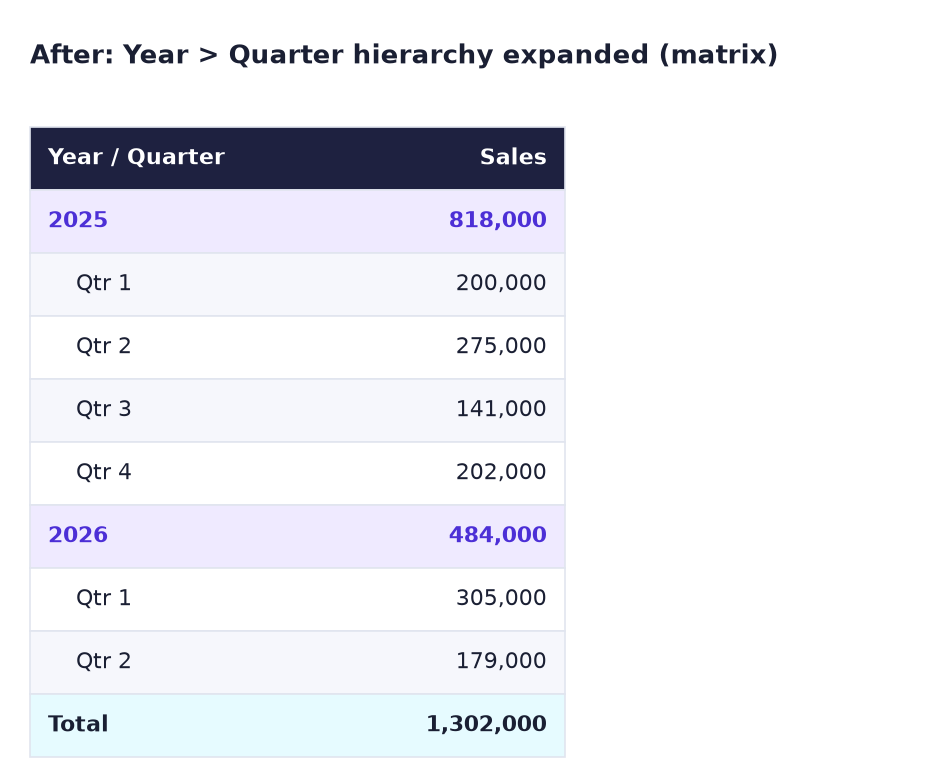
After (1). The same matrix with the Calendar hierarchy expanded one level. 2025 Qtr 3 (141,000) is clearly the weakest quarter.
After (2). Cities grouped into two zones.
The formula
Neither feature needs a formula, but it helps to know what they are underneath:
- A hierarchy is only a path of existing columns: Year, then Quarter, then Month. It adds no data. The matrix uses the path to know what to show when you expand.
- A group is a new column that Power BI writes for you. It works like this DAX calculated column:
Zone = SWITCH ( pbi_cities[City], "Nagpur", "Vidarbha", "West Maharashtra" )
Read it as: "if City is Nagpur, write Vidarbha; otherwise write West Maharashtra". Groups are faster to make with clicks; the DAX version is easier to review when there are many rules.
Steps
- Open
Lab-11-star-schema.pbix. -
In the Data pane, open DateTable, right-click Year and choose Create hierarchy.
What you should see: a new item Year Hierarchy with Year inside it.
-
Right-click Quarter → Add to hierarchy → Year Hierarchy. Do the same for Month.
-
Right-click Year Hierarchy → Rename and type
Calendar.What you should see: Calendar with three levels in order: Year, Quarter, Month.
-
Click an empty part of the canvas, then the Matrix icon. Put Calendar in Rows and Total Sales in Values.
What you should see: two rows: 2025 818,000 and 2026 484,000, Total 1,302,000.
-
Hover over the matrix and click the Expand all down one level icon (the forked double arrow at the top of the visual).
What you should see: 2025 with Qtr 1 200,000, Qtr 2 275,000, Qtr 3 141,000, Qtr 4 202,000, and 2026 with Qtr 1 305,000 and Qtr 2 179,000.
-
In Format visual → Row headers, switch +/- icons on. Collapse all, then click the + next to 2026 and then next to 2026 Qtr 1.
What you should see: January 100,000, February 160,000, March 45,000 (in month order, because of Sort by column in Lab 11).
-
Now the zones. In the Data pane, open pbi_cities, right-click City and choose New group.
- In the Groups window, hold Ctrl and click Mumbai, Nashik and Pune in the Ungrouped values list, then click Group. Double-click the new group name and type
West Maharashtra. -
Click Nagpur, click Group and name it
Vidarbha. Click OK.What you should see: a new field City (groups) under pbi_cities, with a groups icon.
-
Make a Table visual with City (groups) and Total Sales.
What you should see: West Maharashtra 1,042,000 and Vidarbha 260,000, Total 1,302,000.
-
Save as
Lab-12-hierarchy-groups.
Ravindra Bagale's Tip
Make groups on the dimension table (pbi_cities), not on the fact table. Then the zone works in every visual and with every measure, and if a new city opens you change the group in one place. In Groups, the tick box Include Other group puts any new, unassigned city into "Other" so it never silently disappears. Group dimension var, nehmi!
Ravindra Bagale's Tip – मराठी
Groups dimension table (pbi_cities) वर बनवा, fact table वर नाही. मग zone प्रत्येक visual मध्ये आणि प्रत्येक measure सोबत चालतो, आणि नवीन city उघडली तर group एकाच जागी बदलायचा. Groups मध्ये Include Other group tick केलं की नवीन, assign न केलेली city "Other" मध्ये जाते, म्हणजे ती गुपचूप गायब होत नाही. Group dimension वर, नेहमी!
Ravindra Bagale's Tip – हिंदी
Groups dimension table (pbi_cities) पर बनाओ, fact table पर नहीं। तब zone हर visual में और हर measure के साथ चलता है, और नई city खुले तो group एक ही जगह बदलना है। Groups में Include Other group tick करने से नई, बिना assign की city "Other" में जाती है, ताकि वह चुपचाप गायब न हो। Group dimension पर, हमेशा!
Common mistakes
| Mistake | What happens | Fix |
|---|---|---|
| Months shown April, August, December… | Month is sorted A–Z | In Table view: Column tools → Sort by column → Month No |
| Using the automatic date hierarchy of OrderDate | A second, hidden date table per date column; confusing | Use your own DateTable and Calendar hierarchy |
| Clicking Drill down (single arrow) instead of Expand | You see only one year's quarters, not both | Expand all down one level keeps the parent rows |
| Grouping on pbi_sales[City] (hidden in Lab 11) | Works in some visuals but not with pbi_cities fields | Group on pbi_cities[City] |
| Forgetting Nagpur in step 10 | Nagpur stays in "Ungrouped" and shows with its own name | Every value must belong to a group (or tick Include Other group) |
Self-check checklist
0 of 4 done
Try-at-home challenge
Build a second hierarchy called Geography in pbi_cities with City (groups) › City, and put it in a bar chart. Then answer: which city is the biggest inside West Maharashtra, and what share of the zone does it have?
Check your answer
Right-click City (groups) → Create hierarchy, then add City to it and rename it Geography. In a bar chart, click Expand all down one level. Inside West Maharashtra: Mumbai 439,000, Pune 346,000, Nashik 257,000. Mumbai has 439,000 ÷ 1,042,000 = 42.1% of the zone. Vidarbha has only Nagpur, 260,000.
Samjla ka? A hierarchy is a path to drill, a group is a column made by clicks. Aata pudhe jaauya: the DAX lab, where you write your first CALCULATE measure.