Labs · Power BI
Lab: Build a 4-KPI Card Row for One Industry (Hospital) from Sample Data
Course: Power BI · Chapter 36: KPI in All Industries
Chapter 36 lists KPIs for many industries; this lab builds one industry's KPI row end to end.
Chala mitrano! Every industry has its own KPIs, but the card row is the same idea everywhere: four numbers that the boss reads first. Today we build the hospital row we planned in the last lab. Two small traps wait for us: blank wait times and a percentage that must divide correctly. Chaar cards, chaar uttara!
चला मित्रांनो! प्रत्येक industry चे स्वतःचे KPIs असतात, पण card row ची कल्पना सगळीकडे सारखीच: boss आधी वाचतो ते चार numbers. आज मागच्या lab मध्ये plan केलेली hospital row बनवू. दोन छोटे traps आपली वाट पाहतायत: blank wait times आणि बरोबर divide व्हायला हवी अशी percentage. चार cards, चार उत्तरं!
चलो दोस्तों! हर industry के अपने KPIs होते हैं, पर card row का idea हर जगह एक है: चार numbers जो boss सबसे पहले पढ़ता है। आज पिछले lab में plan की hospital row बनाएंगे। दो छोटे traps हमारा इंतज़ार कर रहे हैं: blank wait times और एक percentage जो सही divide होनी चाहिए। चार cards, चार जवाब!
Suppose we are…
Suppose we are building the "8 AM view" for the Pune multi-speciality hospital from Lab 35 (similar to Ruby Hall Clinic or Jehangir Hospital). The medical superintendent agreed to our plan: four KPI cards first. We have hospital_visits.csv with 40 visits from March 2026 (35 OPD, 5 IPD). All data is sample data made up for practice.
Goal of this lab
Build a row of 4 cards:
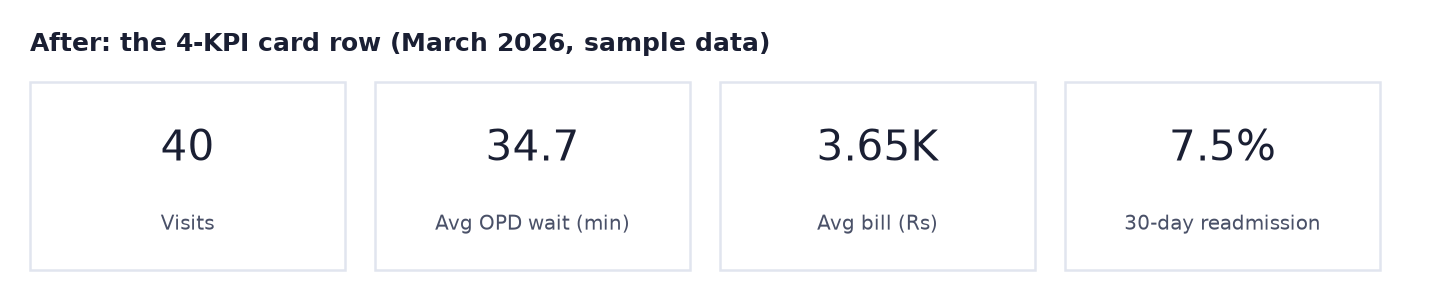
- Visits = 40
- Avg OPD wait (min) = 34.7
- Avg bill (Rs) = 3.65K
- 30-day readmission = 7.5%
Then add a Department slicer and check the cards change correctly.
What you need (all free)
- Power BI Desktop.
- Download hospital_visits.csv (40 visits, March 2026)
- 40 minutes.
The data: before and after
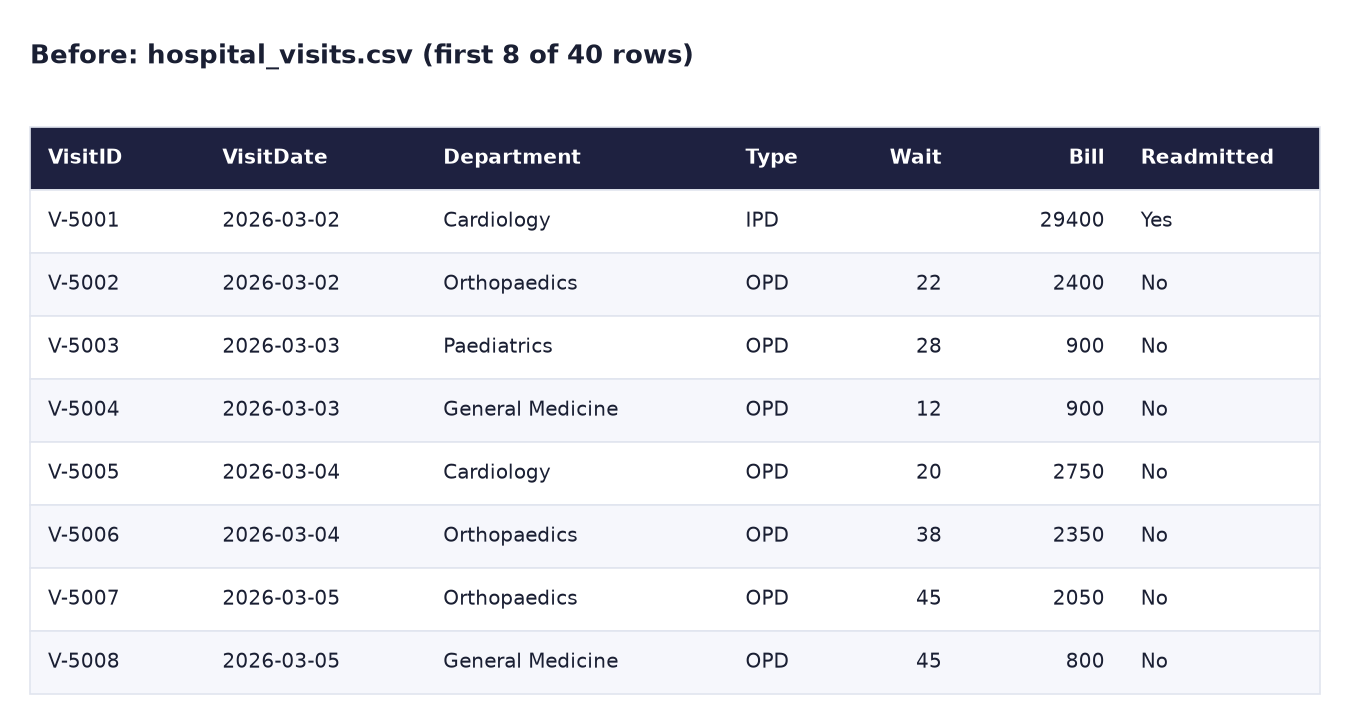
Before. The raw file. IPD rows have no wait time (blank), because admitted patients do not wait in the OPD queue.
After. The 4-KPI card row.
The formula
Visits = COUNTROWS ( hospital_visits )

Avg OPD Wait = AVERAGE ( hospital_visits[WaitMins] )

Avg Bill = AVERAGE ( hospital_visits[Bill] )

Readmission % =
DIVIDE (
    CALCULATE ( [Visits], hospital_visits[Readmitted30d] = "Yes" ),
    [Visits]
)
AVERAGEignores blanks, so the IPD rows (no wait) are left out: 1,213 minutes ÷ 35 OPD visits = 34.66. If the blanks became 0, it would wrongly divide by 40 and show 30.3.Readmission %= 3 readmitted ÷ 40 visits = 7.5%.CALCULATEkeeps only "Yes" rows for the top;DIVIDEavoids errors if Visits is 0.
Steps
- Open Power BI Desktop. Get data → Text/CSV → hospital_visits.csv → Transform Data.
-
In Power Query check the types: VisitDate = Date, WaitMins = Whole Number, Bill = Whole Number, the others = Text.
What you should see: WaitMins shows null on the IPD rows (V-5001, V-5010, …). Leave them as null. Do not use Replace Values to turn them into 0.
-
Click Close & Apply. In Table view check: 40 rows.
- Create the four measures above (right-click hospital_visits → New measure, one at a time).
- Format: Avg OPD Wait → Decimal, 1 decimal place. Avg Bill → Whole number (display units Thousands gives 3.65K in the card). Readmission % → Percentage, 1 decimal.
- Add 4 Card visuals (the new Card visual can hold several, or use 4 classic cards). Put them in one row at the top, same size.
-
Rename each card's label: Visits, Avg OPD wait (min), Avg bill (Rs), 30-day readmission. (Double-click the field name in the Fields well to rename it for this visual.)
What you should see: 40 | 34.7 | 3.65K | 7.5%, as in the after image.
-
Add a slicer with Department and click Orthopaedics.
What you should see: Visits 12, Avg OPD wait 41.2, Avg bill 4.05K (4,050), Readmission 8.3% (1 of 12). Orthopaedics has the longest queue.
-
Clear the slicer. Add a title text box:
Pune hospital – March 2026 (sample data). Save asLab-36-hospital-kpis.
Ravindra Bagale's Tip
A card without context is just a number. Is 34.7 minutes good? Add the target in the label or a subtitle ("target 30 min"), or use the new Card visual's reference label. And always write the unit: minutes, rupees, percent. Number + unit + target = KPI!
Ravindra Bagale's Tip – मराठी
Context शिवाय card म्हणजे फक्त एक number. 34.7 मिनिटं चांगलं की वाईट? Label किंवा subtitle मध्ये target लिहा ("target 30 min"), किंवा नव्या Card visual चं reference label वापरा. आणि unit नेहमी लिहा: minutes, rupees, percent. Number + unit + target = KPI!
Ravindra Bagale's Tip – हिंदी
Context के बिना card बस एक number है। 34.7 मिनट अच्छा है या बुरा? Label या subtitle में target लिखो ("target 30 min"), या नए Card visual का reference label इस्तेमाल करो। और unit हमेशा लिखो: minutes, rupees, percent। Number + unit + target = KPI!
Common mistakes
| Mistake | What happens | Fix |
|---|---|---|
| Replacing null WaitMins with 0 | Avg wait shows 30.3 instead of 34.7 | Keep null; AVERAGE ignores blanks |
| Dragging WaitMins into a card | Shows Sum of WaitMins (1,213) | Use the Avg OPD Wait measure |
| Readmission as a count only | "3" means nothing without the base | Divide by Visits: 7.5% |
COUNT ( hospital_visits[Readmitted30d] ) on top |
Counts all 40 (Yes and No) → 100% | CALCULATE ( [Visits], … = "Yes" ) |
| No units in labels | "3.65K" of what? | Avg bill (Rs), Avg OPD wait (min) |
Self-check checklist
0 of 5 done
Try-at-home challenge
Switch industry. Make a 4-KPI row for a school with a tiny table you type yourself (Home → Enter data): 10 students with columns Student, Class, DaysPresent (out of 20), Marks (out of 100), FeePaid (Yes/No). Choose KPIs: Students, Attendance %, Average marks, Fee collection %. Write the DAX for Attendance % and Fee collection %.
Check your answer
Students = COUNTROWS ( School )
Attendance % = DIVIDE ( SUM ( School[DaysPresent] ), [Students] * 20 )
Avg Marks = AVERAGE ( School[Marks] )
Fee Collection % = DIVIDE ( CALCULATE ( [Students], School[FeePaid] = "Yes" ), [Students] )
Attendance % divides total days present by total possible days (students × 20), not by the number of students. Fee collection % uses the same CALCULATE + DIVIDE pattern as the readmission card. Check one number by hand: for example, if the DaysPresent total is 172, attendance = 172 ÷ 200 = 86%.
Samjla ka? COUNTROWS, AVERAGE that skips blanks, and CALCULATE + DIVIDE for a percentage: four cards for any industry. Aata pudhe jaauya: take this row to your own industry and data.