Labs · Power BI
Lab: Create a Report-Page Tooltip That Shows the Product Split When You Hover over a City
Course: Power BI · Chapter 18: Tooltips
Chapter 18 covers tooltips; this lab builds a report-page tooltip, the kind managers remember.
Download pbi_sales.csv (24 orders) Download pbi_products.csv Download pbi_cities.csv
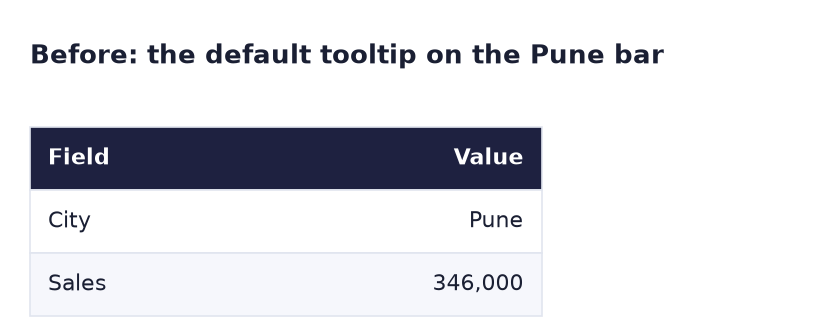
Chala mitrano! A normal tooltip says "City: Pune, Sales: 346,000". Useful, but boring. A report-page tooltip shows a small chart inside the hover box: what Pune sold, product by product. No click, no new page, just hover. Managers love this one. Hover kara, uttar milava!
चला मित्रांनो! साधा tooltip सांगतो "City: Pune, Sales: 346,000". उपयोगी, पण कंटाळवाणा. Report-page tooltip hover box मध्ये एक छोटा chart दाखवतो: Pune ने काय विकलं, product नुसार. Click नाही, नवीन page नाही, फक्त hover. Managers ना हे खूप आवडतं. Hover करा, उत्तर मिळवा!
चलो दोस्तों! साधारण tooltip कहता है "City: Pune, Sales: 346,000"। काम का, लेकिन बोरिंग। Report-page tooltip hover box के अंदर एक छोटा chart दिखाता है: Pune ने क्या बेचा, product के हिसाब से। कोई click नहीं, कोई नया page नहीं, बस hover। Managers को यह बहुत पसंद आता है। Hover करो, जवाब पाओ!
Suppose we are…
Suppose the Croma regional manager uses our overview on her laptop during a review. She hovers over each city bar and asks "what is inside this number?" Drill through (Lab 17) works, but it leaves the page. She wants the answer in the hover box itself. We build a report-page tooltip: a tiny report page that appears as the tooltip. The numbers are sample data made up for practice.
Goal of this lab
By the end you will have:
- A hidden, tooltip-sized page Tooltip Products with a bar chart of sales by product.
- The city bar chart on Overview using that page as its tooltip.
- Hovered over Pune and Mumbai and read their product splits.
What you need (all free)
- Power BI Desktop and your
Lab-17-drill-through.pbix(or any file with the star schema and Total Sales). - Sample data if you need to rebuild: Download pbi_sales.csv (24 orders) Download pbi_products.csv Download pbi_cities.csv
- 25 minutes.
The data: before and after
Before. The default tooltip on the Pune bar: two lines of text.
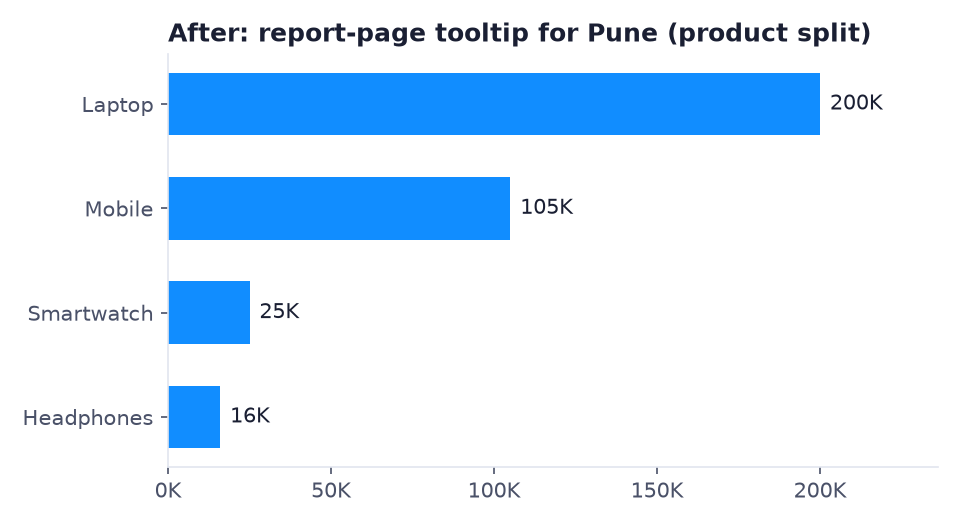
After. The report-page tooltip on the Pune bar: a small chart with the product split.
The formula
No new DAX: the tooltip chart uses Total Sales. The trick is the filter. When you hover over the Pune bar, Power BI passes City = Pune to the tooltip page, just like drill through does, and the tooltip chart calculates Total Sales by Product for Pune only:
| Hover over | Filter passed | Tooltip chart shows |
|---|---|---|
| Pune | City = Pune | Laptop 200K, Mobile 105K, Smartwatch 25K, Headphones 16K (= 346K) |
| Mumbai | City = Mumbai | Laptop 250K, Mobile 135K, Smartwatch 30K, Headphones 24K (= 439K) |
Steps
- Open your Lab 17 file and Save as
Lab-18-tooltip. - Add a new page and rename it Tooltip Products.
- Click empty canvas on that page. In Visualizations → Format page (the paint-brush icon with no visual selected), open Page information and switch on Allow use as tooltip.
-
Still in Format page, open Canvas settings and set Type to Tooltip.
What you should see: the page shrinks to a small rectangle (320 × 240 pixels).
-
On this small page, add a Clustered bar chart: Y-axis pbi_products[Product], X-axis Total Sales, sorted descending, data labels on. Turn the X-axis off and set the Title to
Product split. Make the chart fill the page. - Right-click the Tooltip Products page tab → Hide page.
- Go to Overview and select the Sales by City bar chart. Open Format visual → General → Tooltips. Set Type to Report page and Page to Tooltip Products.
-
Hover over the Pune bar.
What you should see: a small chart in the hover box: Laptop 200K, Mobile 105K, Smartwatch 25K, Headphones 16K.
-
Hover over Mumbai.
What you should see: Laptop 250K, Mobile 135K, Smartwatch 30K, Headphones 24K.
-
Save.
Ravindra Bagale's Tip
Keep tooltip pages tiny: one chart or a few numbers, big fonts, no title bar clutter. A tooltip is read in two seconds while the mouse is moving. If it needs scrolling or explaining, it belongs on a drill-through page, not in a tooltip. Chhota tooltip, motha parinaam!
Ravindra Bagale's Tip – मराठी
Tooltip pages छोटी ठेवा: एक chart किंवा काही numbers, मोठे fonts, title चा पसारा नको. Mouse फिरत असताना tooltip दोन सेकंदात वाचला जातो. त्याला scroll किंवा समजावणं लागत असेल, तर ते drill-through page वर हवं, tooltip मध्ये नाही. छोटा tooltip, मोठा परिणाम!
Ravindra Bagale's Tip – हिंदी
Tooltip pages छोटे रखो: एक chart या कुछ numbers, बड़े fonts, title का झंझट नहीं। Mouse चलते हुए tooltip दो सेकंड में पढ़ा जाता है। अगर उसे scroll या समझाना पड़े, तो वह drill-through page पर होना चाहिए, tooltip में नहीं। छोटा tooltip, बड़ा असर!
Common mistakes
| Mistake | What happens | Fix |
|---|---|---|
| Allow use as tooltip left off | The page does not appear in the Tooltips → Page list | Format page → Page information → Allow use as tooltip |
| Canvas left at 16:9 | A huge tooltip covers the whole report | Canvas settings → Type → Tooltip |
| The tooltip chart uses pbi_sales[City] while the main chart uses pbi_cities[City] | It still works (filters pass through the model), but it is confusing to maintain | Use dimension columns everywhere |
| Tooltip page not hidden | Users click it and see a tiny page with all products | Hide the page |
| Product sorted A–Z in the tooltip | Hard to read quickly | Sort by Total Sales, descending |
Self-check checklist
0 of 4 done
Try-at-home challenge
Add a Card with Orders (COUNTROWS ( pbi_sales )) at the top of the tooltip page, above the chart. Hover over each city. Which city has the fewest orders, and does the tooltip still fit?
Check your answer
Every city shows 6 orders in the sample data, so the order count alone does not separate them; the product split does. If the card pushes the chart off the 320 × 240 canvas, make the card shorter (small callout font) and the chart a bit smaller. A tooltip page must fit without scrolling.
Samjla ka? A tooltip page is a tiny report page that receives the filter of the bar under the mouse. Aata pudhe jaauya: switch between a chart and a table with bookmarks and buttons.