Labs · Power BI
Lab: Timed Practice – Build a 3-Visual Report from a New Dataset in 45 Minutes
Course: Power BI · Chapter 29: Practice Exercises and Final Assignment
Chapter 29 has practice exercises and the final assignment; this lab is a timed warm-up with an answer key.
Chala mitrano! Knowing is one thing; doing it under a clock is another. Many interviews give 45 minutes and a file you have never seen. Today we rehearse that pressure. Start the timer, no peeking at answers, and then score yourself honestly. Ghadyal chalu, ghabru naka!
चला मित्रांनो! माहीत असणं एक, आणि घड्याळ चालू असताना करणं दुसरं. बऱ्याच interviews मध्ये 45 मिनिटं आणि कधी न पाहिलेली file देतात. आज तो दबाव practice करू. Timer चालू करा, answers कडे डोकावू नका, आणि मग प्रामाणिकपणे स्वतःला marks द्या. घड्याळ चालू, घाबरू नका!
चलो दोस्तों! जानना एक बात है; घड़ी चलते हुए करना दूसरी। बहुत से interviews में 45 मिनट और एक अनदेखी file मिलती है। आज वही दबाव practice करेंगे। Timer शुरू करो, answers मत देखो, और फिर ईमानदारी से खुद को marks दो। घड़ी चालू, घबराना नहीं!
Suppose we are…
Suppose we are in the second round of an interview for a junior analyst role at Zomato. The interviewer emails a CSV of 40 food orders from Mumbai, Pune, Bengaluru and Delhi (April 2026) and says: "You have 45 minutes. Build a one-page report with three visuals that tell me total order value, which city orders most, and which cuisine sells most. Then share your screen." The data is sample data made up for practice, not real Zomato figures.
Goal of this lab
Within 45 minutes:
- Load and check
zomato_orders.csv(40 rows). - Build: (1) a Card with total order value, (2) a bar chart by City, (3) a column chart by Cuisine.
- Add titles, sort, labels; save.
- Score yourself with the answer key (out of 10).
What you need (all free)
- Power BI Desktop and a timer (your phone is fine).
- Download zomato_orders.csv (40 orders, 4 cities)
- 45 minutes, without interruptions.
The data: before and after
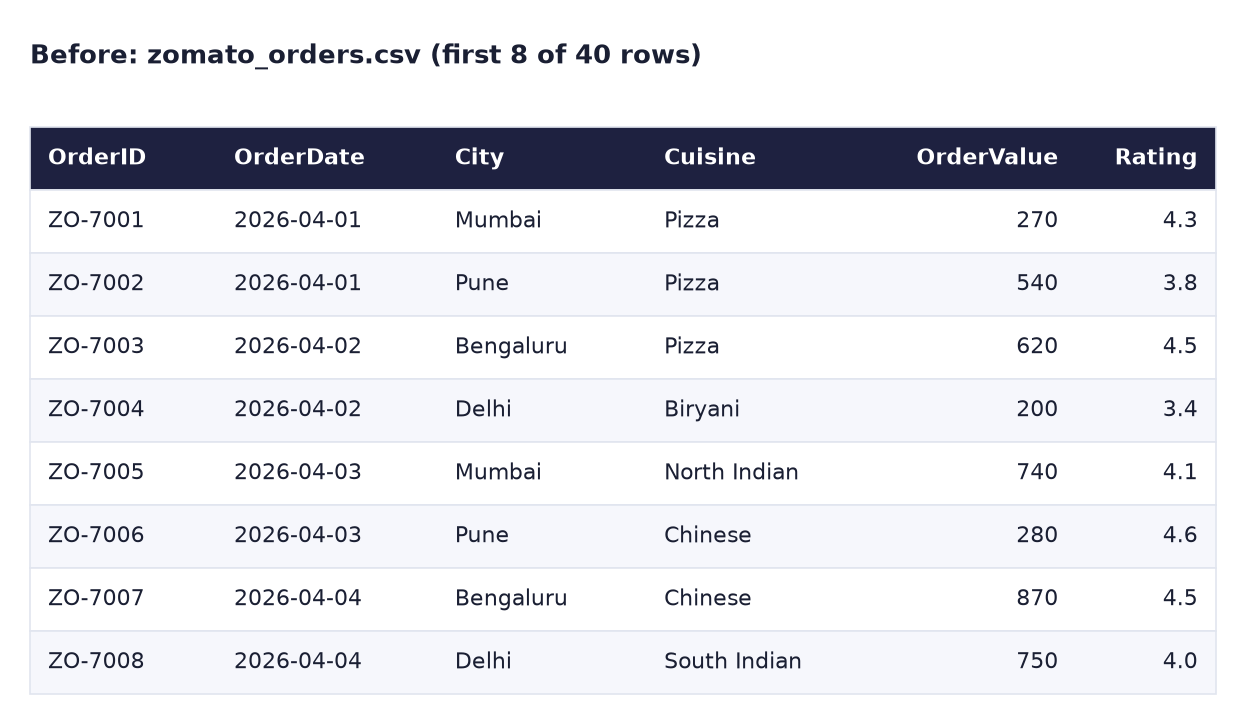
Before. The new file: 40 rows, 6 columns.
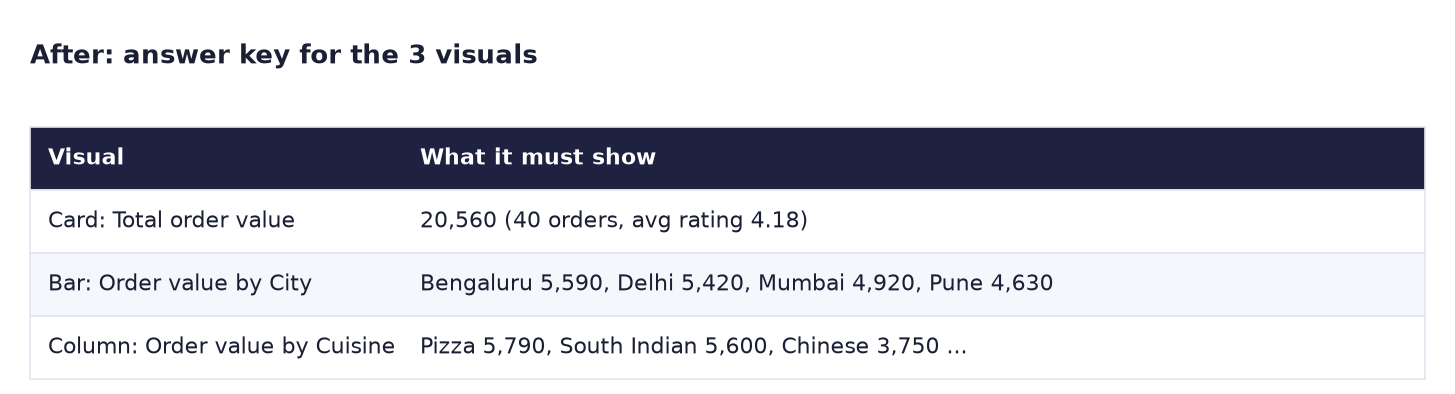
After. The answer key: what each visual must show. Look at it only after the timer ends.
The formula
Keep it simple and use measures:
Order Value = SUM ( zomato_orders[OrderValue] )
Orders      = COUNTROWS ( zomato_orders )
Avg Rating  = AVERAGE ( zomato_orders[Rating] )
A suggested time plan:
| Minutes | Do this |
|---|---|
| 0–5 | Load, check 40 rows and data types |
| 5–12 | Write the 3 measures |
| 12–32 | Build the 3 visuals |
| 32–40 | Titles, sorting, labels, alignment |
| 40–45 | Check numbers, save, prepare one spoken sentence |
Steps
- Start the timer: 45:00.
-
Get data → Text/CSV → zomato_orders.csv → Transform Data. Check: OrderDate = Date, OrderValue = Whole Number, Rating = Decimal Number. Close & Apply.
What you should see: 40 rows in Table view.
-
Create the three measures (Order Value, Orders, Avg Rating). Format Avg Rating with 2 decimals.
- Visual 1: a Card with Order Value. (Optional: a second card with Orders and a third with Avg Rating.)
- Visual 2: a Clustered bar chart, Y-axis City, X-axis Order Value, sorted descending, data labels on, title
Order value by city. - Visual 3: a Clustered column chart, X-axis Cuisine, Y-axis Order Value, sorted descending, data labels on, title
Order value by cuisine. - Add a page title:
Food orders – April 2026 (sample data). Align the visuals. - Prepare one sentence you would say to the interviewer, for example about the top city or cuisine.
- Save as
Lab-29-timed. Stop the timer. Note your time. - Now open the answer key image and the box below, and score yourself.
Answer key and scoring (out of 10)
- Card: Order Value 20,560 (shows 20.56K). Orders 40. Avg Rating 4.18. (2 points)
- City bar: Bengaluru 5,590, Delhi 5,420, Mumbai 4,920, Pune 4,630, sorted with Bengaluru on top. (2 points)
- Cuisine column: Pizza 5,790, South Indian 5,600, Chinese 3,750, Biryani 2,780, North Indian 2,640, sorted. (2 points)
- Titles that say what the chart shows, data labels, "sample data" note. (2 points)
- Finished within 45 minutes. (1 point)
- A spoken sentence with a number, e.g. "Bengaluru leads with 5,590, but all four cities are within 1,000 of each other; Pizza and South Indian make up more than half of the value." (1 point)
8 or more: interview-ready for this level. 5–7: repeat the lab next week with the timer at 35 minutes. Below 5: redo Labs C, D and 14, then try again.
Ravindra Bagale's Tip
Under time pressure, finish first and polish later. A plain report with correct numbers in 40 minutes beats a beautiful half-report at 45. Do not spend 15 minutes choosing colours. And always say one sentence with a number at the end; interviewers remember that. Aadhi barobar, mag sundar!
Ravindra Bagale's Tip – मराठी
वेळेच्या दबावाखाली आधी पूर्ण करा, नंतर सजवा. 40 मिनिटांत बरोबर numbers असलेला साधा report, 45 मिनिटांच्या सुंदर अर्ध्या report पेक्षा चांगला. रंग निवडण्यात 15 मिनिटं घालवू नका. आणि शेवटी नेहमी number असलेलं एक वाक्य बोला; interviewers ते लक्षात ठेवतात. आधी बरोबर, मग सुंदर!
Ravindra Bagale's Tip – हिंदी
समय के दबाव में पहले पूरा करो, बाद में सजाओ। 40 मिनट में सही numbers वाला सादा report, 45 मिनट के सुंदर आधे report से बेहतर है। रंग चुनने में 15 मिनट मत लगाओ। और आखिर में हमेशा number वाला एक वाक्य बोलो; interviewers वही याद रखते हैं। पहले सही, फिर सुंदर!
Common mistakes
| Mistake | What happens | Fix |
|---|---|---|
| Rating loaded as Whole Number | 4.3 becomes 4; average is wrong | Set Rating to Decimal Number |
| Using "Sum of Rating" in a card | Shows 167.3, meaningless | Use the Avg Rating measure |
| Pie chart for 5 cuisines | Hard to compare slices | Sorted column chart |
| Spending the first 15 minutes on themes | Visuals unfinished at 45:00 | Follow the time plan |
| No check of the row count | A loading problem goes unnoticed | Table view: 40 rows |
Self-check checklist
0 of 5 done
Try-at-home challenge
Add a fourth visual in 10 extra minutes: order value by week (1–7 April, 8–14, 15–20). Hint: add a column Week = "Week " & ROUNDUP ( DAY ( zomato_orders[OrderDate] ) / 7, 0 ).
Check your answer
Week 1 8,750, Week 2 6,120, Week 3 5,690 (Week 3 has only 6 days, 15–20 April, so compare per day: 1,250, 874 and 948 a day). Order value fell after the first week. A line or column chart works; say "Week 3 is a partial week" in the title or a note, so nobody reads it as a crash.
Samjla ka? Plan the minutes, use measures, finish first, polish later, end with a number. Aata pudhe jaauya: explain CALCULATE and filter context aloud in 2 minutes.