Labs · Power BI
Lab: Load a Public Web Table and a Published Google Sheet into Power BI, Then Refresh Both
Course: Power BI · Chapter 5: Web Data, APIs and Google Sheets
Chapter 5 covers web data, APIs and Google Sheets; this lab loads one of each kind and refreshes them.
Chala mitrano! Not all data sits in a file on your laptop. A lot of it lives on a web page or in a Google Sheet that your manager keeps updating. Today we pull both into Power BI, and then we prove that one click on Refresh brings in the latest numbers. No copy-paste, never again!
चला मित्रांनो! सगळा data तुमच्या laptop वरच्या file मध्ये नसतो. बराचसा data web page वर किंवा manager सतत update करतो त्या Google Sheet मध्ये असतो. आज दोन्ही Power BI मध्ये आणू, आणि मग सिद्ध करू की Refresh वर एक click केला की latest numbers येतात. Copy-paste नाही, पुन्हा कधीच नाही!
चलो दोस्तों! सारा data आपके laptop की file में नहीं होता। बहुत सा data web page पर या उस Google Sheet में होता है जिसे manager बार-बार update करता है। आज दोनों को Power BI में लाएंगे, और फिर साबित करेंगे कि Refresh पर एक click से latest numbers आ जाते हैं। Copy-paste नहीं, फिर कभी नहीं!
Suppose we are…
Suppose we work for a Tata Motors dealer network planning team in Maharashtra. Two pieces of data live outside our laptop:
- The list of districts with their population. It is on the public Wikipedia page "List of districts of Maharashtra". We want it in Power BI to plan where to open showrooms.
- Monthly city targets. Our manager keeps them in a Google Sheet and changes them often. She is tired of emailing Excel files.
We will load both, then change one target in the Sheet and see it arrive in Power BI with Refresh. The targets are sample numbers made up for practice.
Goal of this lab
By the end you will have:
- A query Districts with 36 rows from a Wikipedia table, with the state-total row removed.
- A query Targets with 4 rows from your own Google Sheet, published as CSV.
- Changed Pune's target in the Sheet and seen it in Power BI after Refresh.
What you need (all free)
- Power BI Desktop and an internet connection.
- A Google account (for Google Sheets).
- The targets file: Download gsheet_targets.csv (4 city targets)
- 35 minutes.
The data: before and after
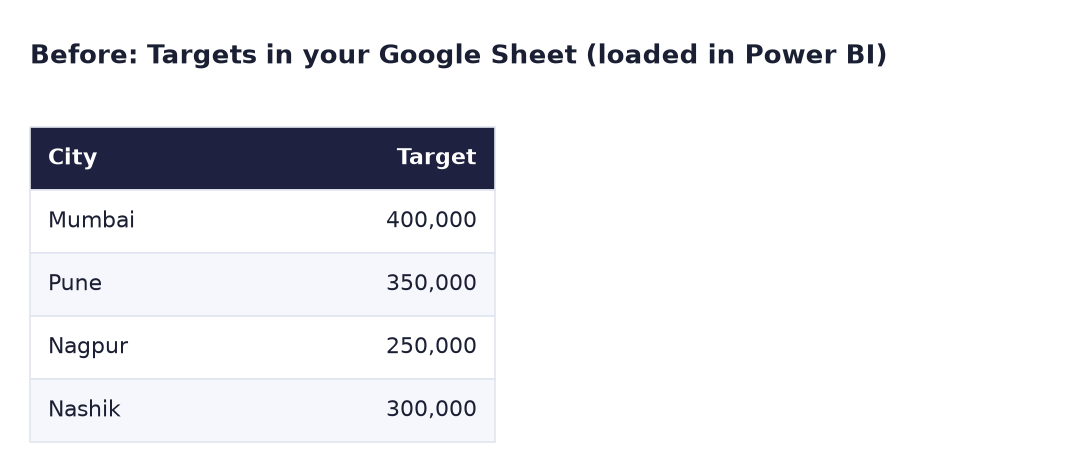
Before. The Targets as they first load from the Google Sheet.
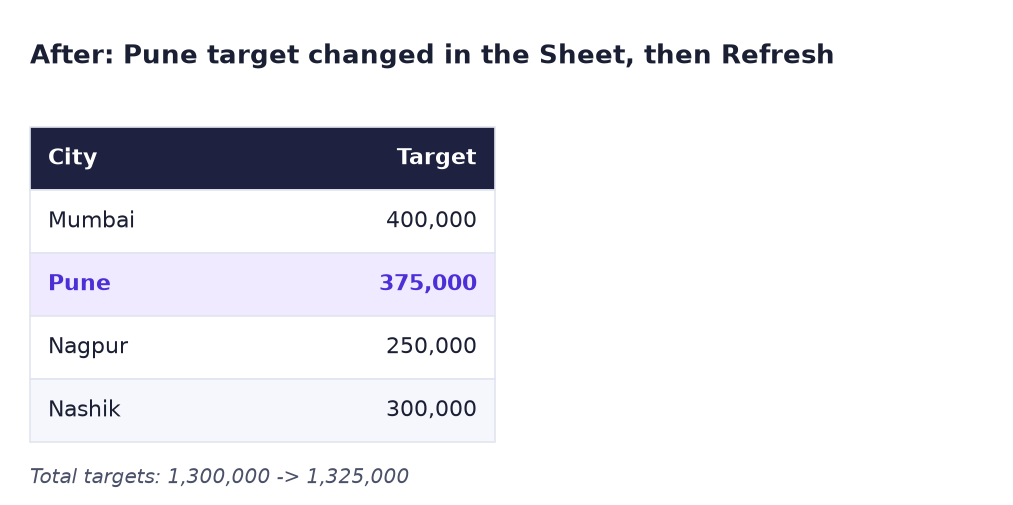
After. We change Pune to 375,000 in the Sheet only, then click Refresh in Power BI. The total goes from 1,300,000 to 1,325,000.
The formula
Power Query writes one Source step for each query in its own language, M. You do not type these, but you should be able to read them in the formula bar:
Targets:   = Csv.Document(Web.Contents("https://docs.google.com/spreadsheets/d/e/…/pub?gid=0&single=true&output=csv"), [Delimiter=",", Columns=2, Encoding=65001])
Districts: = Web.BrowserContents("https://en.wikipedia.org/wiki/List_of_districts_of_Maharashtra")
Web.Contentsdownloads whatever the link returns. Because the Google link ends withoutput=csv, the result is a CSV file, soCsv.Documentreads it like any CSV.Web.BrowserContentsopens the page like a browser, and the next step (Html.Table) cuts out the table you picked.- Refresh simply runs these steps again, so it always fetches the current page and the current Sheet.
Steps
Part A: a public web table
- In Power BI Desktop, click Blank report, then Home → Get data → Web.
-
Paste
https://en.wikipedia.org/wiki/List_of_districts_of_Maharashtrainto the URL box and click OK. If asked how to connect, choose Anonymous → Connect.What you should see: the Navigator with a list of tables (names such as "Table 1", "Table 2" or "Districts") and some "Suggested tables".
-
Click each table name and look at the preview on the right. Pick the one whose columns start with No, Name, Code, Formed, Headquarters. Click Transform Data.
What you should see: the Power Query Editor with 37 rows. The last row has Name = Maharashtra: it is the state total, not a district.
-
Click the drop-down arrow on the Name column header, untick Maharashtra and click OK.
What you should see: 36 rows (the status bar at the bottom says 36 rows).
-
Hold Ctrl and click the headers Name, Administrative division and Population (2011 Census). Right-click one of them and choose Remove Other Columns.
-
Double-click each header to rename it: District, Division, Population. Then click the ABC icon at the left of the Population header and choose Whole Number.
What you should see: Population values aligned to the right, with no Error cells. Pune shows 9,429,408.
-
In Query Settings on the right, rename the query from its table name to Districts. Click Home → Close & Apply.
-
In Report view, make a Table visual with Division, Count of District (tick District, then in the Columns box click its arrow and choose Count) and Population.
What you should see: 6 divisions: Aurangabad 8, Konkan 7, Nagpur 6, Amravati 5, Nashik 5, Pune 5 districts. Total 36 districts and 112,374,333 people. (Wikipedia can be edited, so names or numbers may change a little over time.)
Part B: a published Google Sheet
-
Open
https://sheets.newto create a new Google Sheet. Click File → Import → Upload, choosegsheet_targets.csv, select Replace current sheet and click Import data. Name the spreadsheet Targets 2026.What you should see: columns City and Target with 4 rows.
-
Click File → Share → Publish to web. On the Link tab, choose the sheet name (not "Entire document") and Comma-separated values (.csv). Click Publish → OK and copy the link.
What you should see: a long link that ends with
output=csv. -
Back in Power BI, click Get data → Web, paste the link and click OK (choose Anonymous if asked).
What you should see: a preview with City and Target and 4 rows. Click Load, then rename the new query Targets (right-click it in the Data pane → Rename).
-
Make a Table visual with City and Target.
What you should see: Mumbai 400,000, Pune 350,000, Nagpur 250,000, Nashik 300,000, Total 1,300,000.
Part C: change and refresh
- In the Google Sheet, change Pune's target to 375000 and press Enter. Wait about 5 minutes: Google republishes the CSV a few minutes after each change.
-
In Power BI, click Home → Refresh.
What you should see: Pune 375,000 and Total 1,325,000. The Districts table refreshes too (same 36 rows).
-
Save the file as
Lab-05-web-and-sheets.
Publish to web means public
Anyone who has the published link can read that sheet, and you cannot limit it to your team. Publish only sample or public data like this lab. For private company data, use Get data → Google Sheets (it signs in with your Google account) or a company file share.
Ravindra Bagale's Tip
Refreshed and the number did not change? Do not panic. Google takes a few minutes to republish the CSV. Open the published link in your browser: if the browser still shows 350000, Google has not updated yet. Wait two minutes and refresh again. Thoda dhir dhara!
Ravindra Bagale's Tip – मराठी
Refresh केलं आणि number बदलला नाही? घाबरू नका. Google ला CSV पुन्हा publish करायला काही मिनिटं लागतात. Published link browser मध्ये उघडा: browser मध्ये अजून 350000 दिसत असेल, तर Google ने अजून update केलं नाही. दोन मिनिटं थांबा आणि परत refresh करा. थोडा धीर धरा!
Ravindra Bagale's Tip – हिंदी
Refresh किया और number नहीं बदला? घबराओ मत। Google को CSV दोबारा publish करने में कुछ मिनट लगते हैं। Published link browser में खोलो: अगर browser में अभी भी 350000 दिख रहा है, तो Google ने अभी update नहीं किया। दो मिनट रुको और फिर refresh करो। थोड़ा धीरज रखो!
Common mistakes
| Mistake | What happens | Fix |
|---|---|---|
| Keeping the "Maharashtra" total row | Population doubles to 224,748,666 | Filter it out in Power Query (step 4) |
| Choosing Entire document when publishing | The link gives a web page, not a CSV | Choose the sheet name and Comma-separated values (.csv) |
Pasting the normal "Share" link (/edit…) |
Power BI gets an HTML login page | Use the Publish to web link that ends with output=csv |
| Refreshing straight after the edit | Old target still shows | Wait about 5 minutes, then refresh |
| Population left as text | Sum is not offered; the column shows ABC | Change the type to Whole Number |
| Publishing real salary or customer data | It becomes public on the internet | Publish sample data only; use the Google Sheets connector for private data |
Self-check checklist
0 of 5 done
Try-at-home challenge
Add a fifth row to your Google Sheet: Aurangabad, 150000. Refresh Power BI. Does the new city appear in the Targets table? Now look at the Districts table: can you find "Aurangabad" there? What does that tell you about joining these two tables later?
Check your answer
Yes: after Google republishes and you refresh, Targets has 5 rows and the total is 1,475,000. No new steps are needed, because Power Query reads the whole sheet every time. In Districts, the District column lists Aurangabad today (population 3,701,282), so the names match. But the district was officially renamed Chhatrapati Sambhajinagar in 2023, and if Wikipedia or your manager starts using the new name in only one of the two places, a relationship between the tables will find no match. Lesson: before joining tables, make sure the key text is spelled the same in both.
Samjla ka? Web.Contents + output=csv = a live Google Sheet; Refresh just runs the steps again. Aata pudhe jaauya: clean a really messy sales file in Power Query.