Labs · Power BI
Lab: Write Your First CALCULATE Measure – Total Sales for Mumbai Only
Course: Power BI · Chapter 13: DAX: Data Analysis Expressions
Chapter 13 teaches DAX; this lab is your first CALCULATE.
Chala mitrano! CALCULATE is the most important DAX function, and many students fear it. Today we use it for one small job: total sales for Mumbai only. First we see the data before and after with our own eyes, then the formula, then the clicks. Ghabru naka, it is just one line.
चला मित्रांनो! CALCULATE हे DAX मधलं सगळ्यात महत्त्वाचं function आहे, आणि बरेच students त्याला घाबरतात. आज आपण ते एका छोट्या कामासाठी वापरणार: फक्त Mumbai चे total sales. आधी data before आणि after स्वतःच्या डोळ्यांनी बघू, मग formula, मग clicks. घाबरू नका, फक्त एक line आहे.
चलो दोस्तों! CALCULATE, DAX का सबसे ज़रूरी function है, और बहुत से students उससे डरते हैं। आज हम उसे एक छोटे काम के लिए इस्तेमाल करेंगे: सिर्फ Mumbai के total sales। पहले data का before और after अपनी आँखों से देखेंगे, फिर formula, फिर clicks। घबराओ मत, बस एक line है।
Suppose we are…
Suppose we are still the junior analyst at Flipkart from Lab C. Now the Mumbai regional head asks for one number on her page: "Mumbai sales". It must stay Mumbai even when someone clicks Pune or Nagpur on another chart of the report. A normal chart sum changes with every click, so we need a measure (a saved DAX formula that calculates a number whenever a visual needs it) that always applies the Mumbai filter itself.
As in Lab C, the numbers are sample data made up for practice, not real Flipkart figures.
Goal of this lab
By the end you will have:
- Written a base measure
Total SaleswithSUM. - Written your first
CALCULATEmeasure,Mumbai Sales. - Shown it in a Card and in two Tables, and explained why it shows 147,000 on every city row.
What you need (all free)
- Power BI Desktop on Windows (free, Microsoft Store).
- Your file
Lab-C-city-sales.pbixfrom Lab C. No file yet? Do Lab C first (30 minutes), or load the same sample: Download city_sales.csv (12 rows) - 30 minutes.
The data: before and after
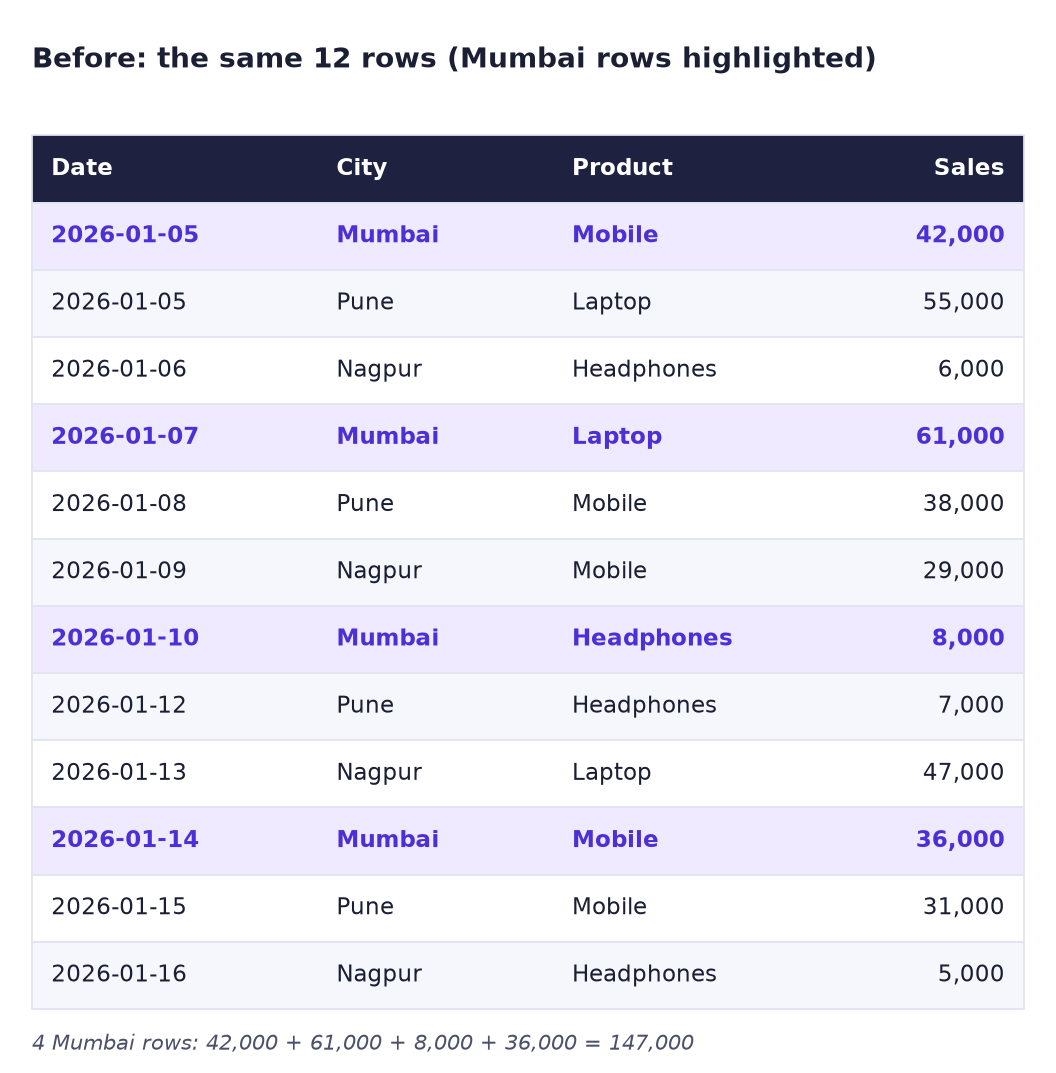
Before. These are the same 12 rows as Lab C. The 4 Mumbai rows are highlighted.
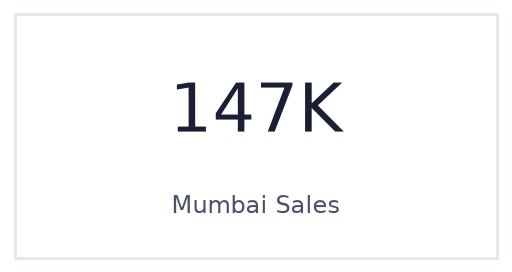
After. Our new measure Mumbai Sales gives 147,000 in a Card:
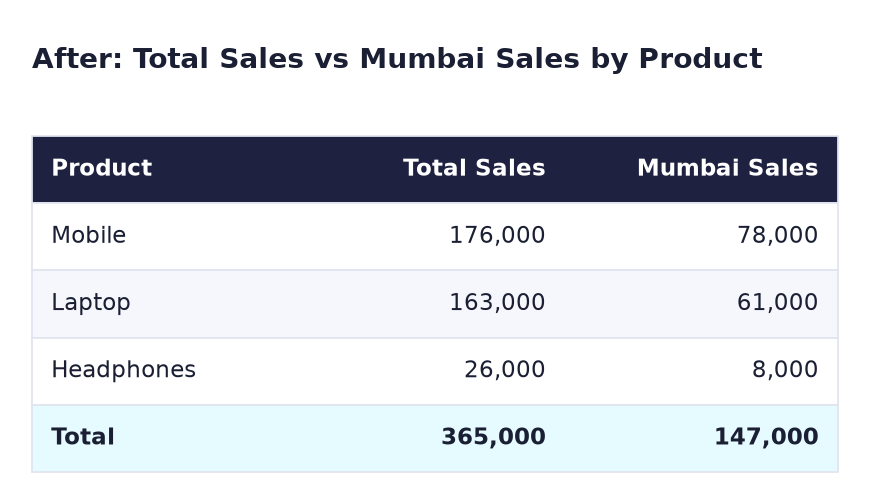
In a table by Product, it shows only the Mumbai part of each product, next to the all-city total:
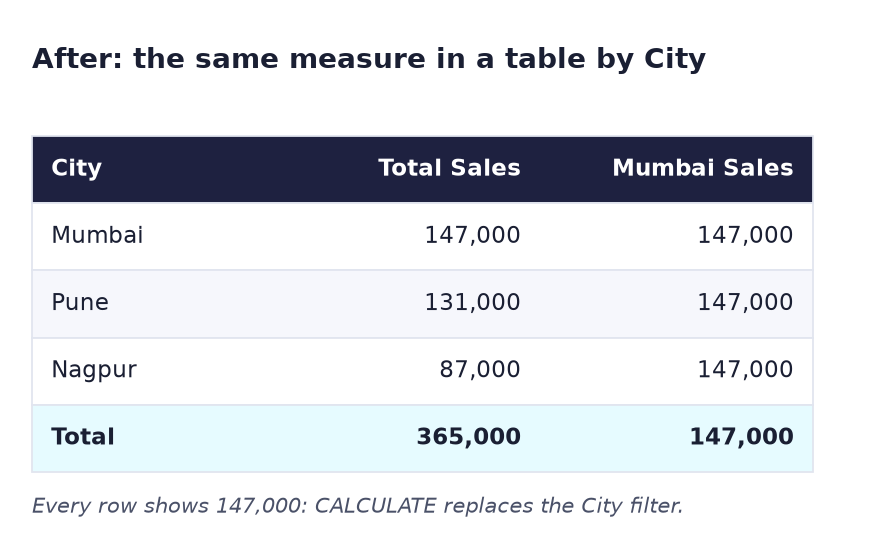
In a table by City, it shows 147,000 on every row, even on Pune and Nagpur:
The formula
We write two measures. The first adds up the Sales column:
Total Sales = SUM ( city_sales[Sales] )
city_sales is the table name (Power BI took it from the file name), and [Sales] is the column inside it.
The second one reuses the first, but with a filter:
Mumbai Sales = CALCULATE ( [Total Sales], city_sales[City] = "Mumbai" )
Read it like a sentence: "Calculate Total Sales, but first keep only the rows where City is Mumbai." CALCULATE takes two things:
- What to calculate:
[Total Sales]. - Which filter to apply first:
city_sales[City] = "Mumbai". Text always goes inside double quotes.
Why is it 147,000 on the Pune row of the city table? Each row of a visual sends its own filter to the measure (this is called filter context: the filters coming from the row, slicers and clicks). On the Pune row, the filter is City = Pune. CALCULATE replaces the City filter with City = Mumbai, so the answer is Mumbai's total. On the product table, the row filter is on Product, not City, so CALCULATE keeps it and adds City = Mumbai: Mobile in Mumbai = 42,000 + 36,000 = 78,000.
Steps
- Open
Lab-C-city-sales.pbixin Power BI Desktop (File → Open report → Browse reports). -
In the Data pane on the right, right-click the table city_sales and choose New measure.
What you should see: a formula bar above the canvas with the text
Measure =. -
Select all the text in the formula bar, type
Total Sales = SUM ( city_sales[Sales] )and press Enter.What you should see: Total Sales in the Data pane under city_sales, with a small calculator icon.
-
Right-click city_sales again and choose New measure.
- Type
Mumbai Sales = CALCULATE ( [Total Sales], city_sales[City] = "Mumbai" )and press Enter. - Click an empty part of the canvas so that no visual is selected.
-
In the Visualizations pane, click the Card icon. Drag Mumbai Sales into the card's field box (called Fields or Data, depending on your Power BI version).
What you should see: the card shows 147K and the label Mumbai Sales.
-
Click an empty part of the canvas again, click the Table icon in Visualizations, and drag Product, Total Sales and Mumbai Sales into its Columns box.
What you should see: Mobile 176,000 and 78,000, Laptop 163,000 and 61,000, Headphones 26,000 and 8,000, and a total row of 365,000 and 147,000.
-
Make a second table with City, Total Sales and Mumbai Sales.
What you should see: Total Sales changes per city (147,000, 131,000, 87,000), but Mumbai Sales is 147,000 on every row.
-
Now click the Pune bar in your Lab C bar chart.
What you should see: the product table's Total Sales changes to Pune's numbers, but the card still shows 147K. Click the Pune bar again to clear the selection.
-
Click File → Save as and save the file as
Lab-D-calculate-mumbai.
Ravindra Bagale's Tip
Many students write 'Mumbai' in single quotes, the way Excel users sometimes do. In DAX, single quotes are for table names, so you get an error. Text values go in double quotes: "Mumbai". And if the card shows (Blank), check the spelling of the city. Dhyan rakho!
Ravindra Bagale's Tip – मराठी
बरेच students 'Mumbai' single quotes मध्ये लिहितात, जसं Excel वाले कधी कधी करतात. DAX मध्ये single quotes table names साठी असतात, म्हणून error येतो. Text values double quotes मध्ये लिहायच्या: "Mumbai". आणि card वर (Blank) दिसलं तर city चं spelling check करा. ध्यान रखो!
Ravindra Bagale's Tip – हिंदी
बहुत से students 'Mumbai' single quotes में लिखते हैं, जैसे Excel वाले कभी-कभी करते हैं। DAX में single quotes table names के लिए होते हैं, इसलिए error आता है। Text values double quotes में लिखो: "Mumbai"। और card पर (Blank) दिखे तो city की spelling check करो। ध्यान रखो!
Common mistakes
| Mistake | What happens | Fix |
|---|---|---|
'Mumbai' in single quotes |
Error: DAX reads it as a table name | Use double quotes: "Mumbai" |
| Clicked New column instead of New measure | You get a column with a value on every row, not one number | Delete it (right-click → Delete from model) and use New measure |
Spelling "Mumbia" or "Mumbai " with a space |
The card shows (Blank) because no row matches | Copy the city name exactly as it is in the data |
Typing the table name wrong, for example sales[Sales] |
Error: cannot find table | Use the name shown in the Data pane: city_sales |
Using SUM ( city_sales[City] ) |
Error: SUM needs a number column | SUM the Sales column |
| Expecting Mumbai Sales to change when you click Pune | It stays 147K and you think it is broken | That is the point of CALCULATE: it replaces the City filter |
Self-check checklist
0 of 6 done
Try-at-home challenge
Write these two measures yourself, then check your answers:
- Pune Laptop Sales: total sales for Pune and Laptop only. Hint: CALCULATE can take more than one filter, separated by a comma.
- Mumbai Share %: Mumbai Sales as a percentage of Total Sales. Hint: use
DIVIDEand set the format to Percentage on the Measure tools ribbon.
Check your answers
Pune Laptop Sales = CALCULATE ( [Total Sales], city_sales[City] = "Pune", city_sales[Product] = "Laptop" )
Mumbai Share % = DIVIDE ( [Mumbai Sales], [Total Sales] )
Pune Laptop Sales = 55,000 (one row: 2026-01-05). Mumbai Share % = 147,000 ÷ 365,000 = 40.27% in a card with no filters.
Samjla ka? CALCULATE = what to calculate + which filter to apply first. Aata pudhe jaauya: the next DAX labs build on this with ALL, FILTER and time intelligence.