This KPI Hub has moved to one shared hub for Excel and Power BI. Open the new KPI Hub →
Power BI KPI Hub
Every important KPI for each type of business, on one simple card: what it means, why it matters, the DAX measure and a tiny worked example in ₹ $ £ €.
23KPI cards on this page
2business sets here
9more live on the shared hub
No KPI found. Try another word.
KPIs by business
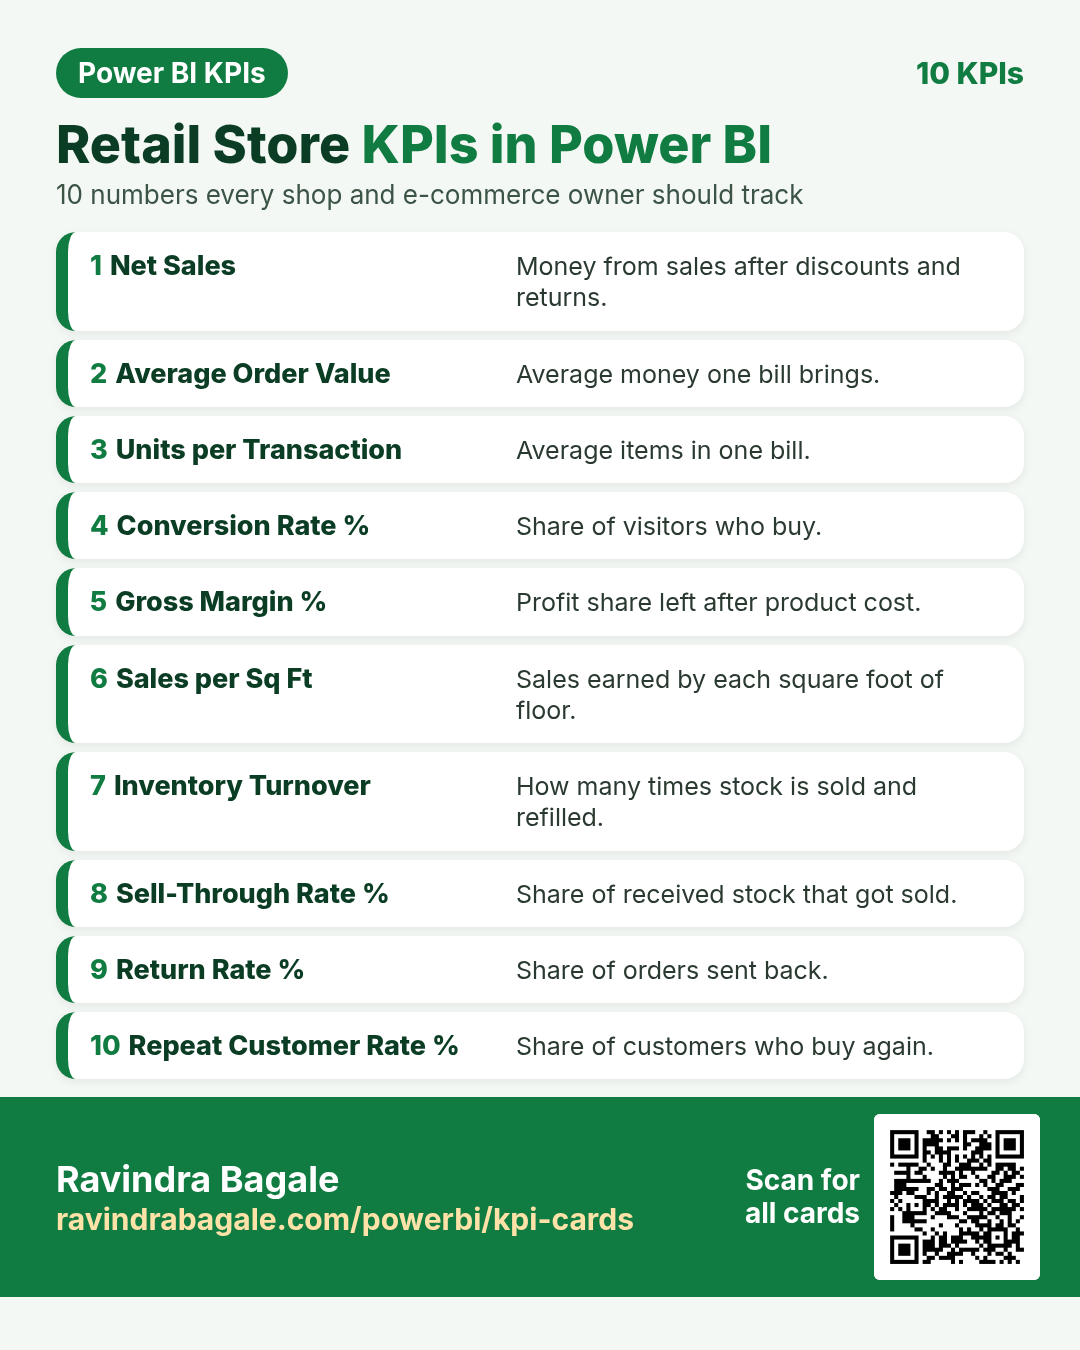 LiveRetail Store KPIs10 KPI cards + quiz
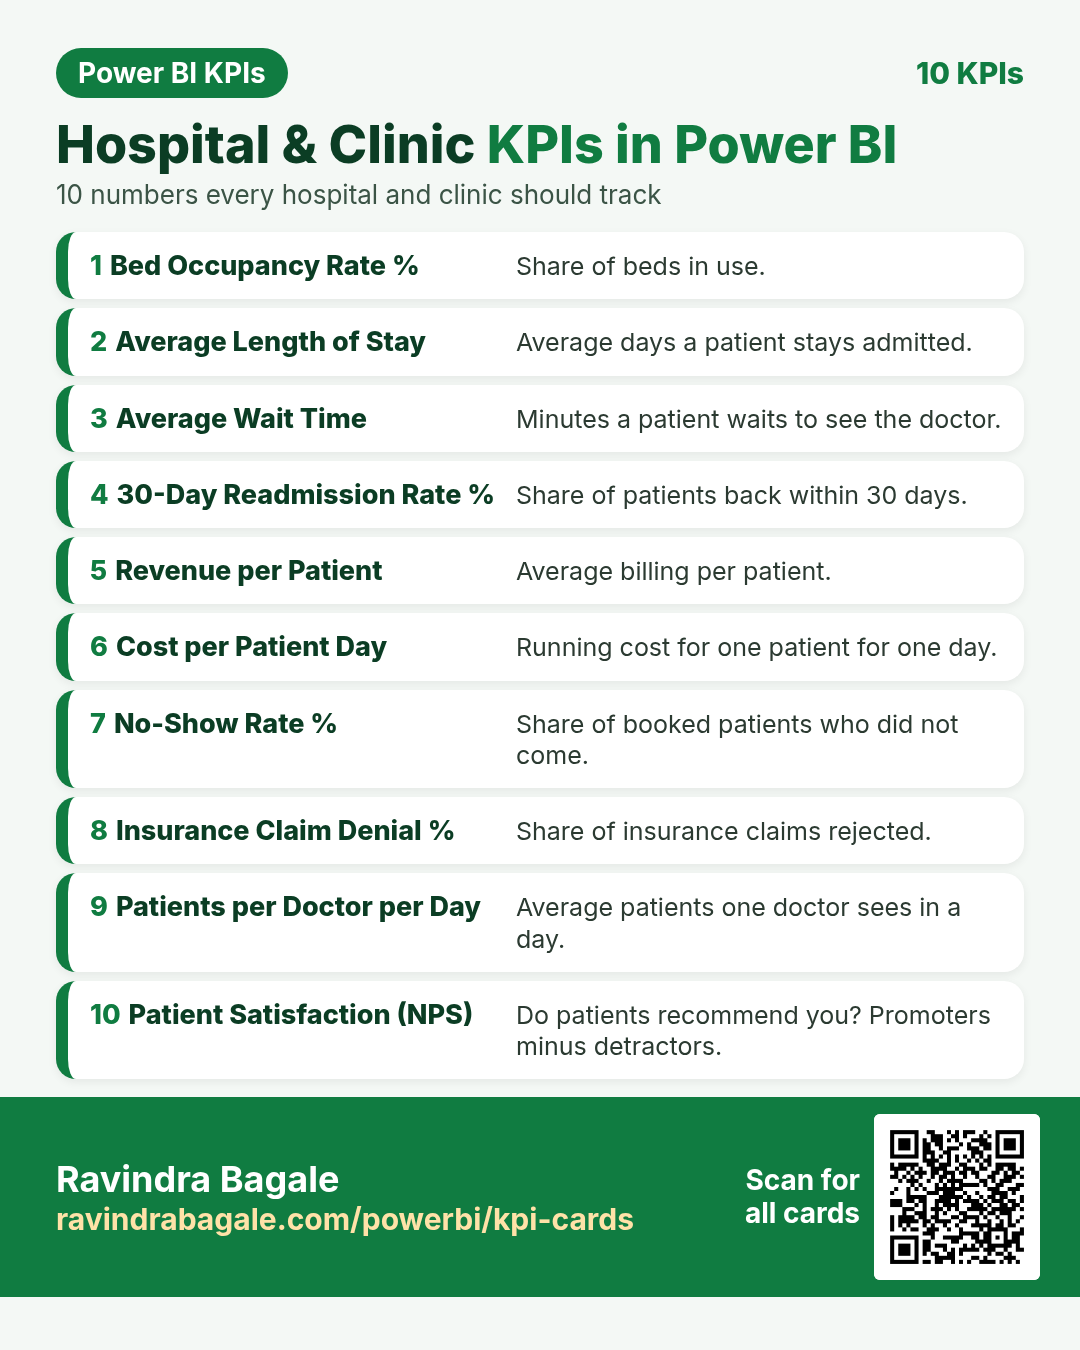 LiveHospital & Clinic KPIs10 KPI cards + quizChapterSales & Revenue KPIsChapter: Total Revenue, Gross Sales, Net Sales, AOV, Sales Growth % + 12 practice tasks
General KPI cards
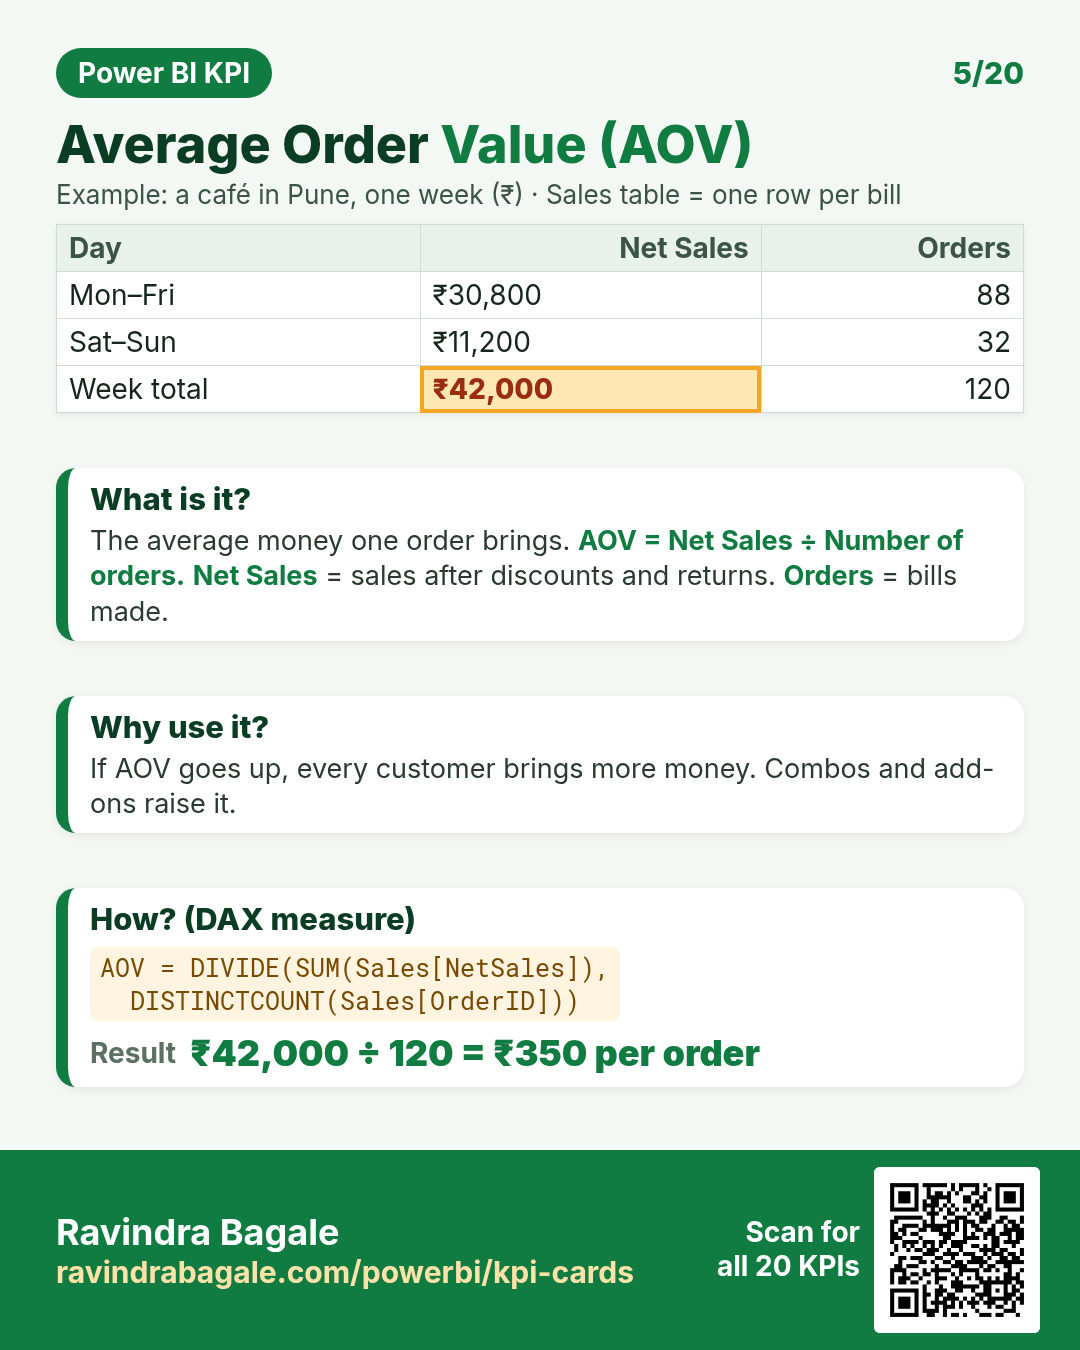 CardAverage Order Value (AOV)Average money one order brings.
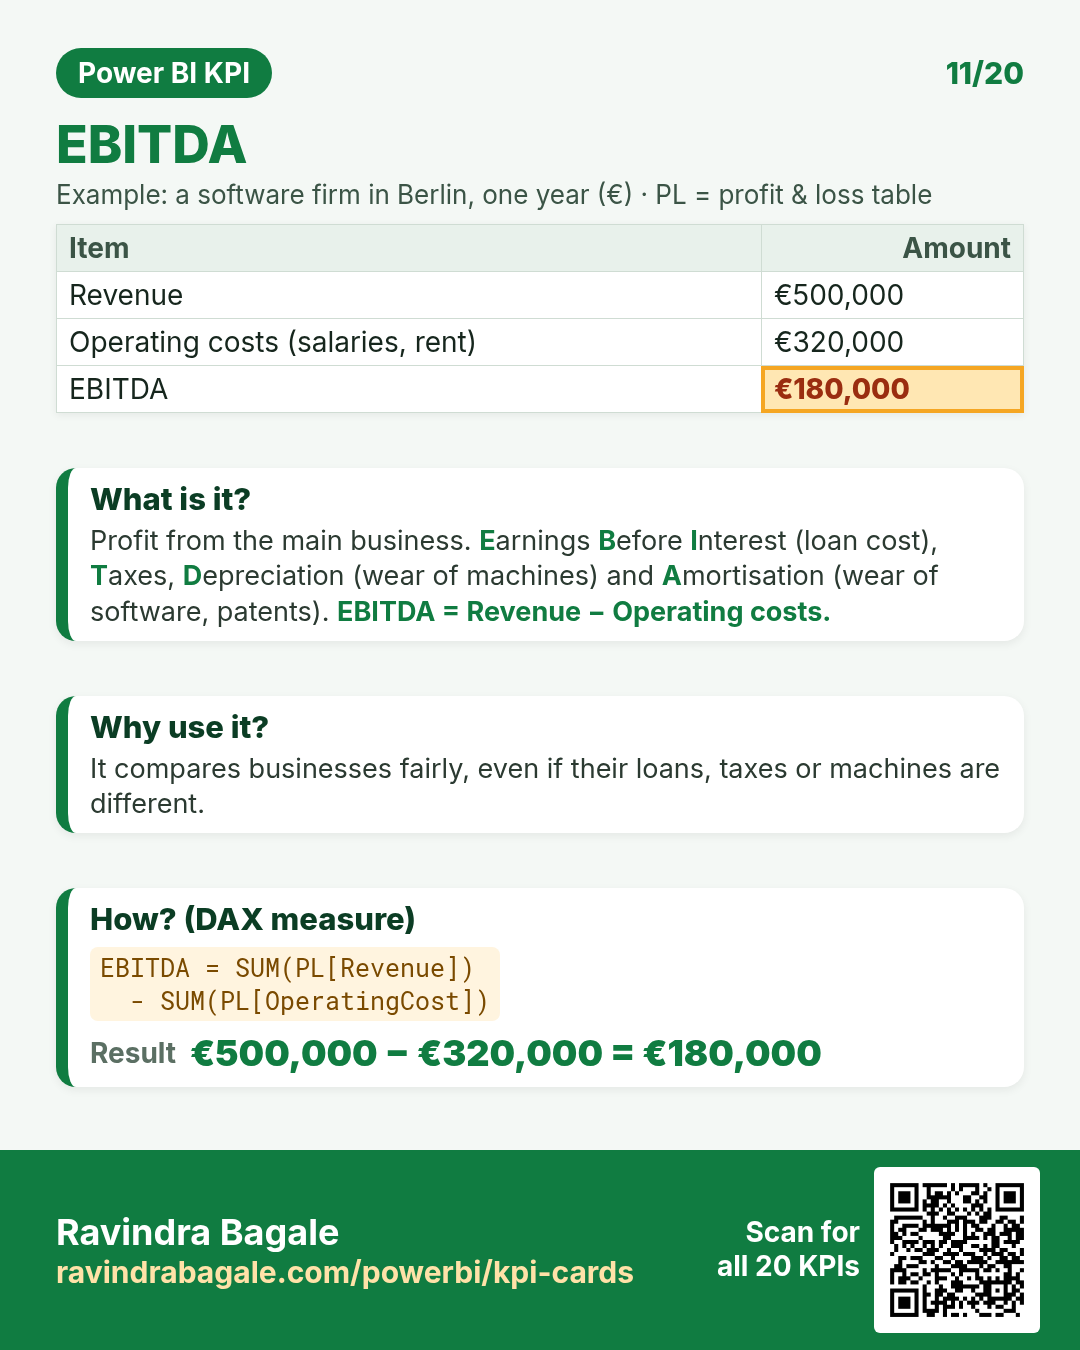 CardEBITDAProfit from the main business before interest, tax and wear.
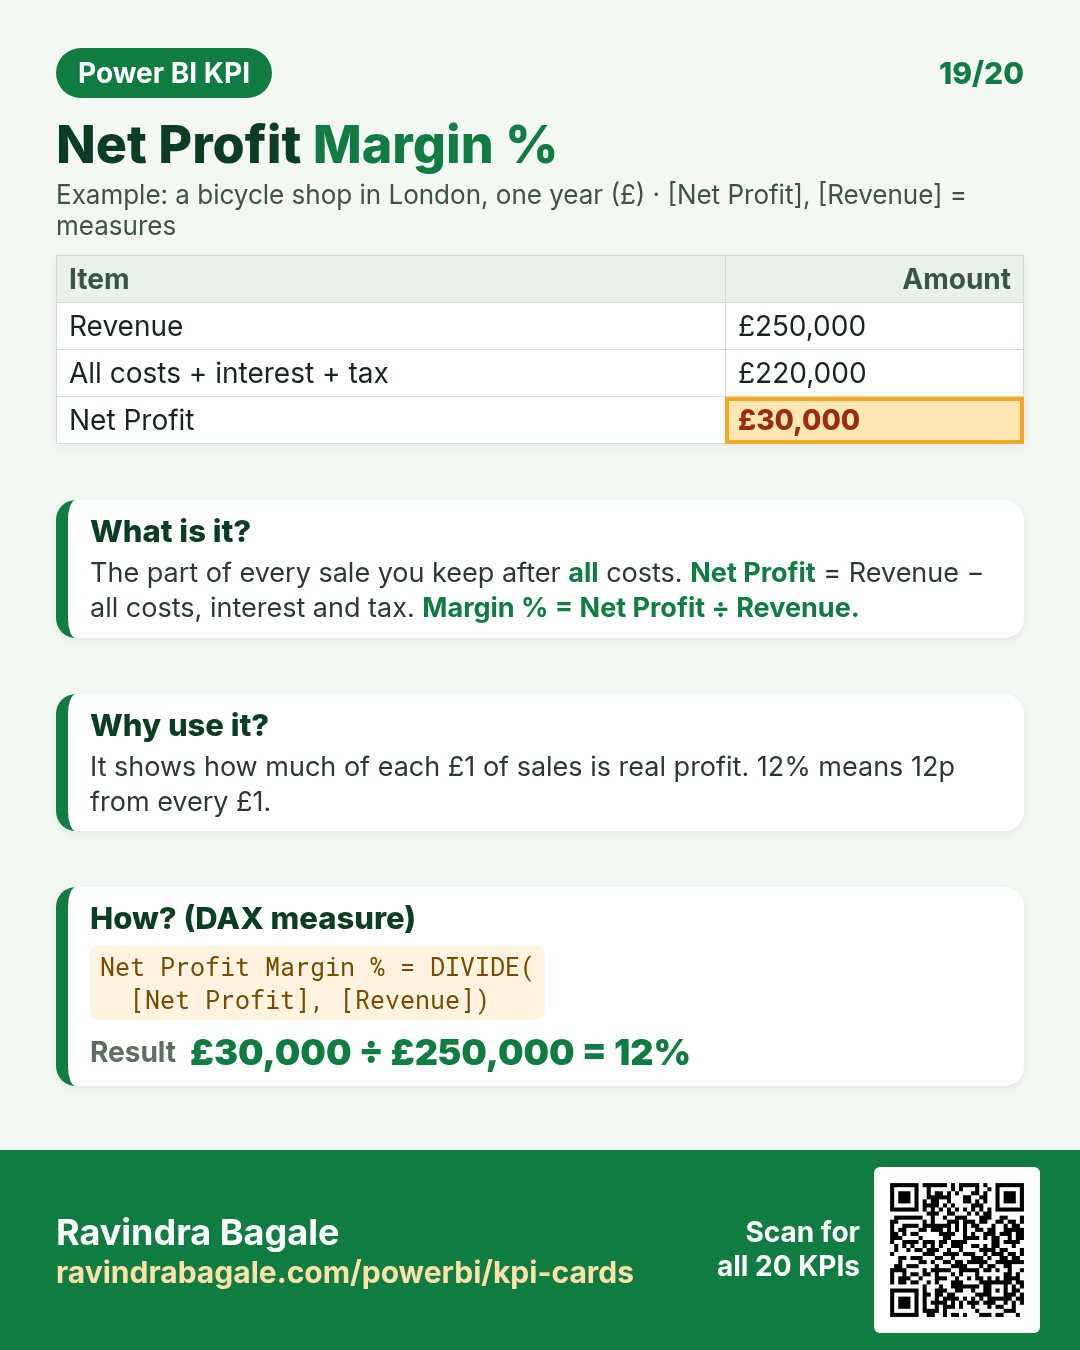 CardNet Profit Margin %Part of each sale kept after all costs.
Also live on the shared KPI Hub
These nine industry sets are already live on the shared Excel and Power BI KPI Hub. Open any tile below to study the cards there.
LiveBanking KPIsLive on the shared KPI HubLiveCafé & Restaurant KPIsLive on the shared KPI HubLiveIT / SaaS KPIsLive on the shared KPI HubLiveLogistics KPIsLive on the shared KPI HubLiveManufacturing KPIsLive on the shared KPI HubLiveInsurance KPIsLive on the shared KPI HubLiveEducation KPIsLive on the shared KPI HubLiveHotels KPIsLive on the shared KPI HubLiveTelecom KPIsLive on the shared KPI Hub
All KPIs A–Z
- Net Sales (Retail): Money from sales after discounts and returns.
- Average Order Value (Retail): Average money one bill brings.
- Units per Transaction (Retail): Average items in one bill.
- Conversion Rate % (Retail): Share of visitors who buy.
- Gross Margin % (Retail): Profit share left after product cost.
- Sales per Sq Ft (Retail): Sales earned by each square foot of floor.
- Inventory Turnover (Retail): How many times stock is sold and refilled.
- Sell-Through Rate % (Retail): Share of received stock that got sold.
- Return Rate % (Retail): Share of orders sent back.
- Repeat Customer Rate % (Retail): Share of customers who buy again.
- Bed Occupancy Rate % (Hospital): Share of beds in use.
- Average Length of Stay (Hospital): Average days a patient stays admitted.
- Average Wait Time (Hospital): Minutes a patient waits to see the doctor.
- 30-Day Readmission Rate % (Hospital): Share of patients back within 30 days.
- Revenue per Patient (Hospital): Average billing per patient.
- Cost per Patient Day (Hospital): Running cost for one patient for one day.
- No-Show Rate % (Hospital): Share of booked patients who did not come.
- Insurance Claim Denial % (Hospital): Share of insurance claims rejected.
- Patients per Doctor per Day (Hospital): Average patients one doctor sees in a day.
- Patient Satisfaction (NPS) (Hospital): Do patients recommend you? Promoters minus detractors.
About this data: All card examples use made-up teaching numbers for businesses in Indian and world cities (Mumbai, Pune, Nagpur, Leeds, New York, Dublin, Munich, Sydney and more) in ₹, $, £ and €. No real customer or patient data is used.