IT / SaaS KPIs in Excel and Power BI
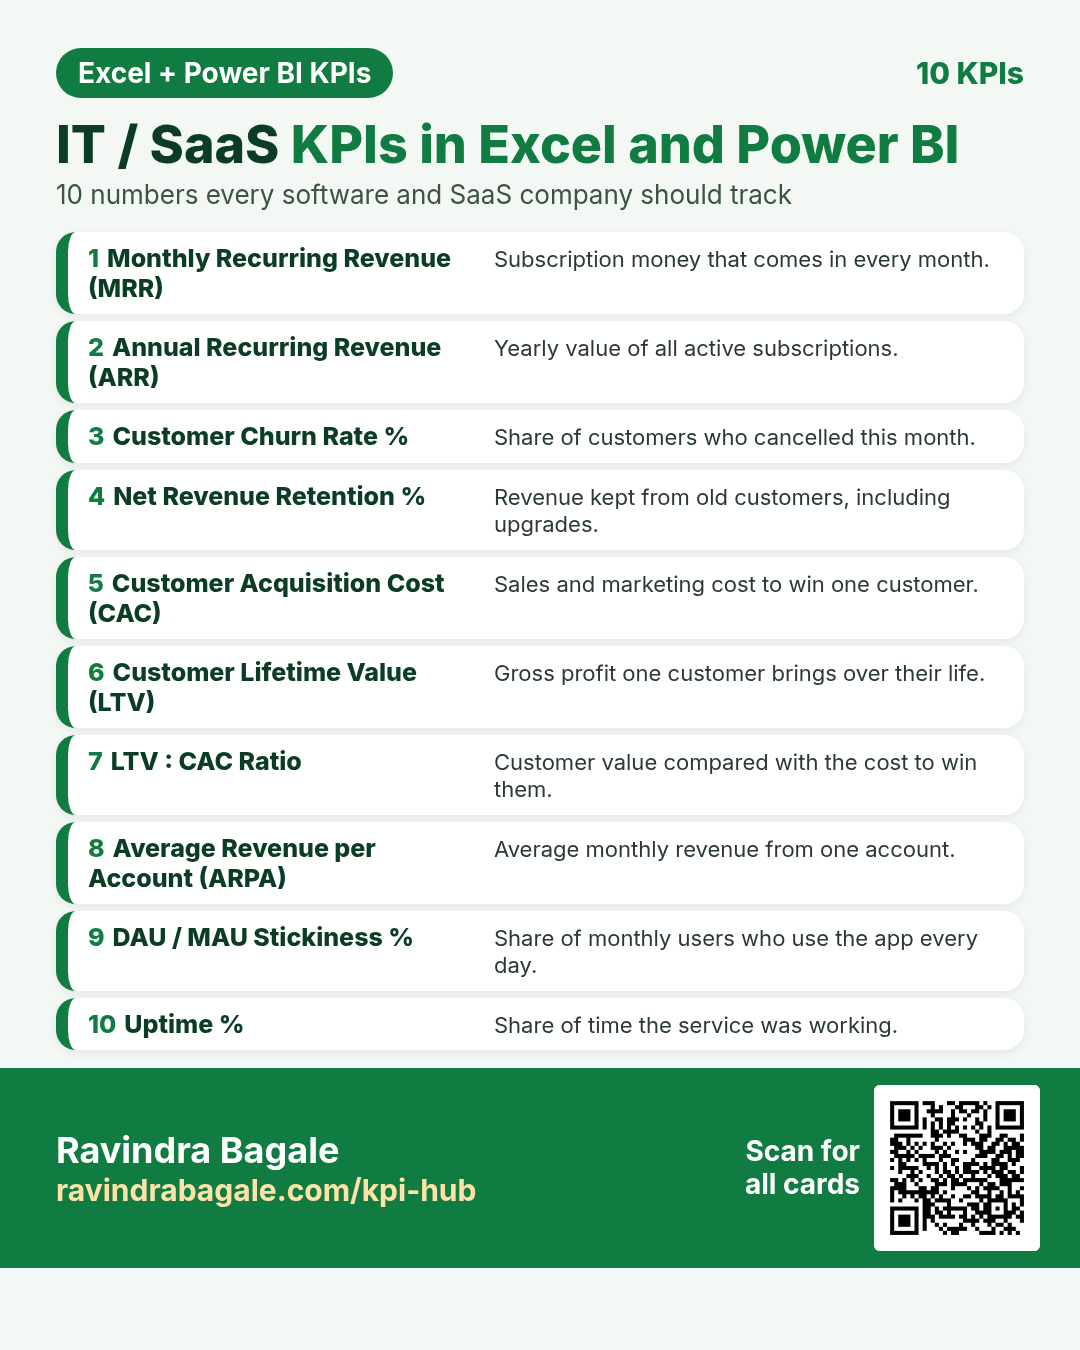
Ten important KPIs for software and SaaS company. Each card has what it is, why it matters, the Excel formula, the DAX measure and a tiny worked example. Every card shows the Excel formula next to the Power BI DAX measure. For Excel, put the card’s example table in cell A1 (labels in column A, numbers in column B).
About this data: All examples are made-up teaching numbers for software companies in Austin, Pune, London, Berlin, Chennai, Toronto, Dublin, Mumbai and Sydney, in $, ₹, £ and €. Table names (Subscriptions, Subs, Spend, Usage, Incidents) are sample names.
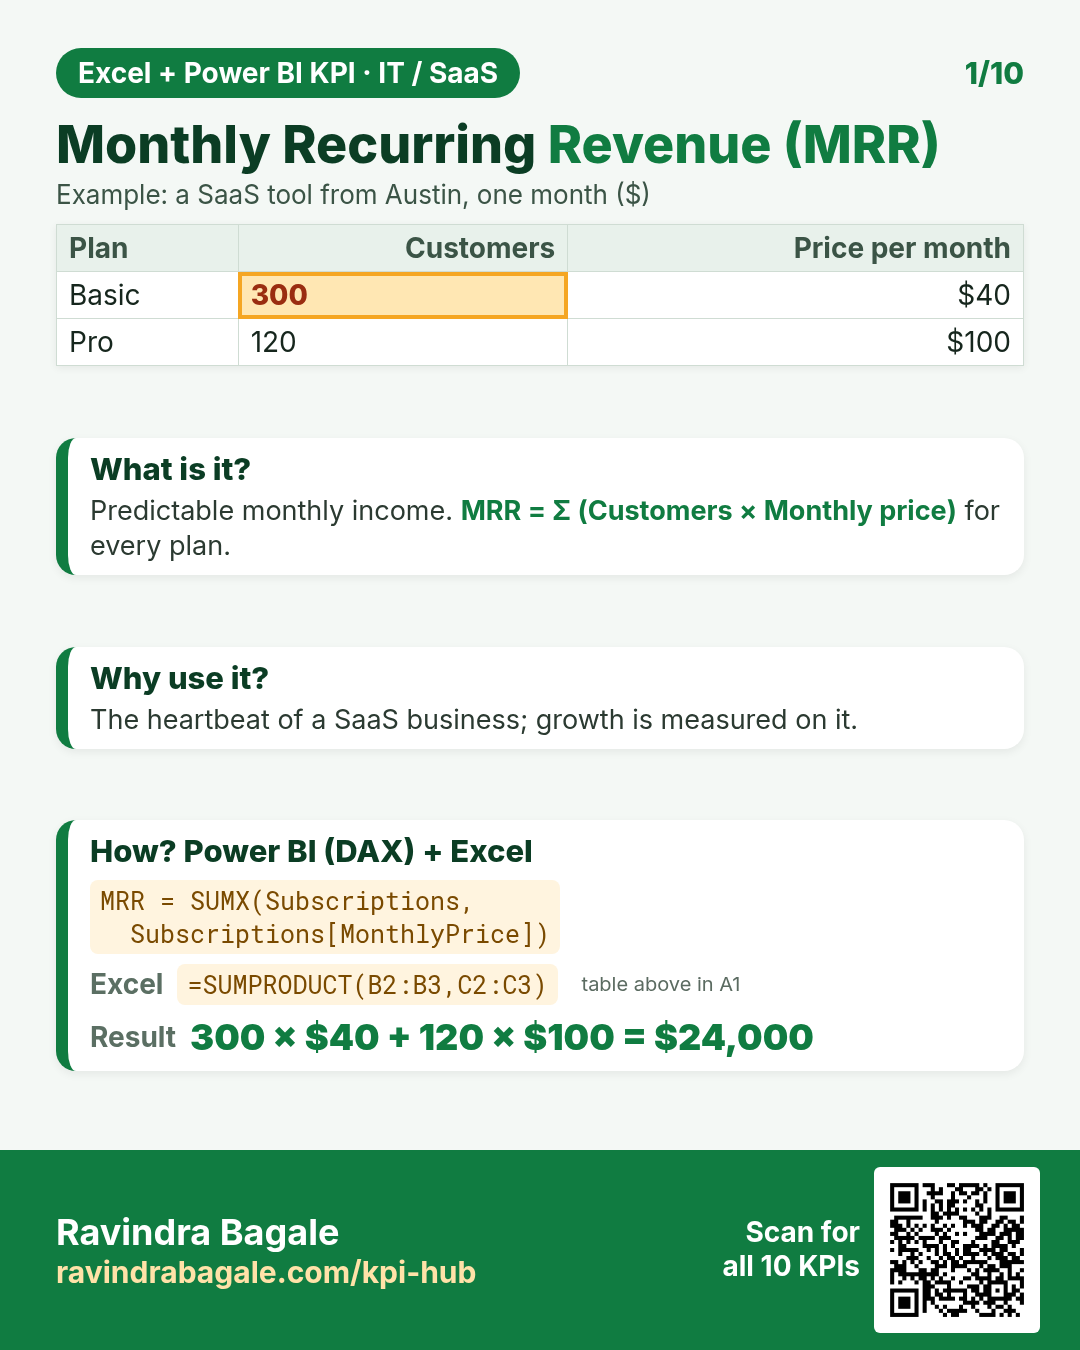
DAX: MRR = SUMX(Subscriptions, Subscriptions[MonthlyPrice])Excel: =SUMPRODUCT(B2:B3,C2:C3)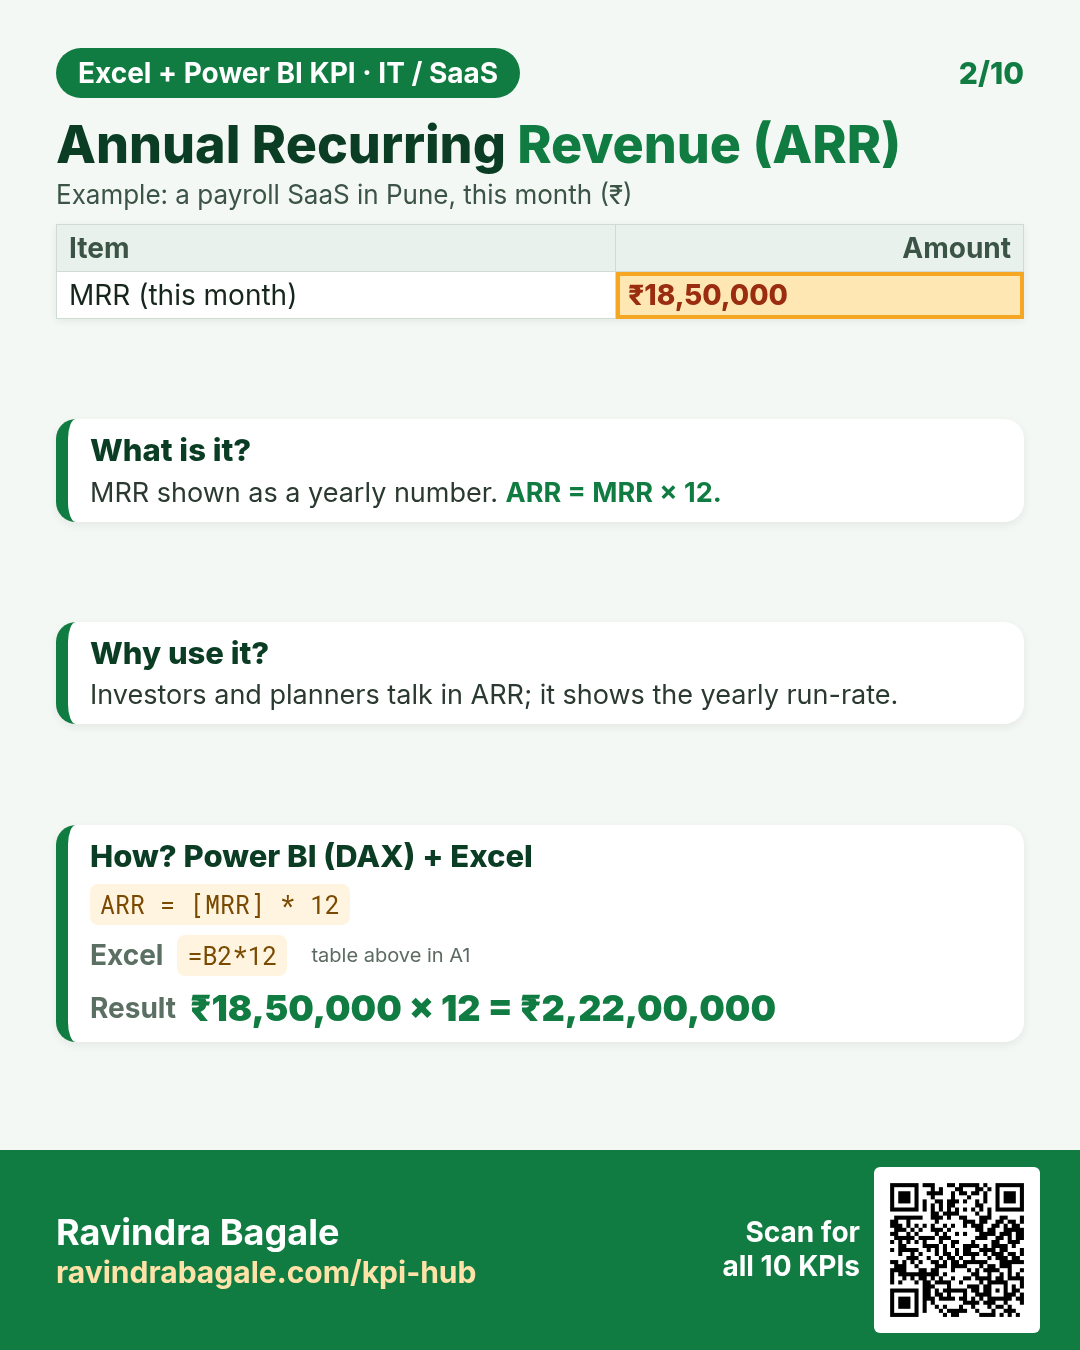
DAX: ARR = [MRR] * 12Excel: =B2*12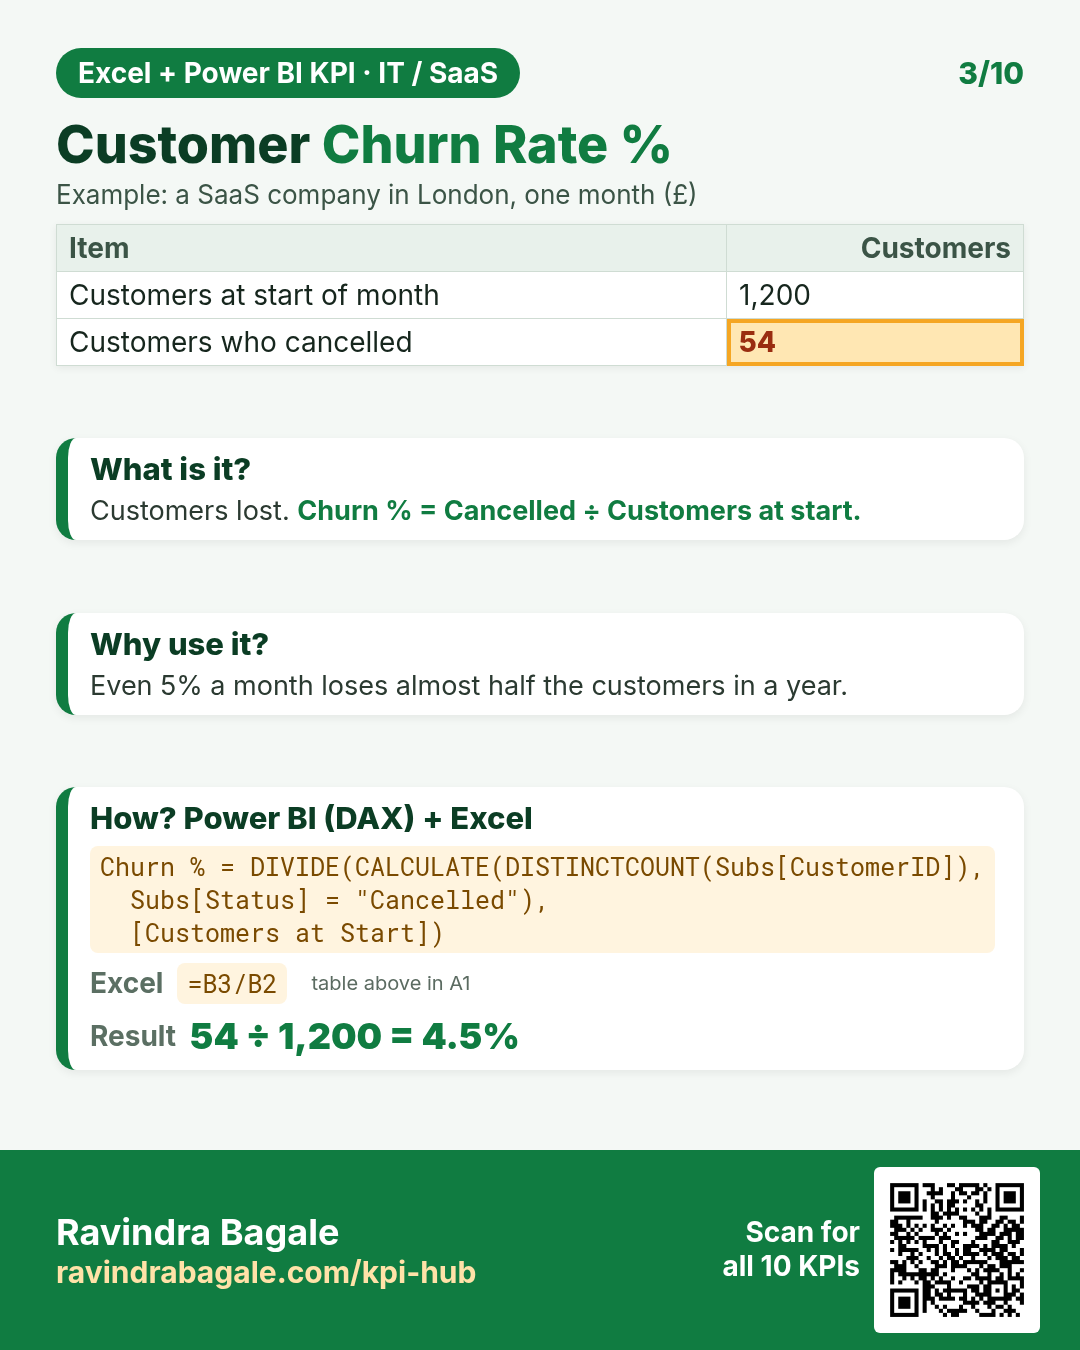
DAX: Churn % = DIVIDE(CALCULATE(DISTINCTCOUNT(Subs[CustomerID]), Subs[Status] = "Cancelled"), [Customers at Start])Excel: =B3/B2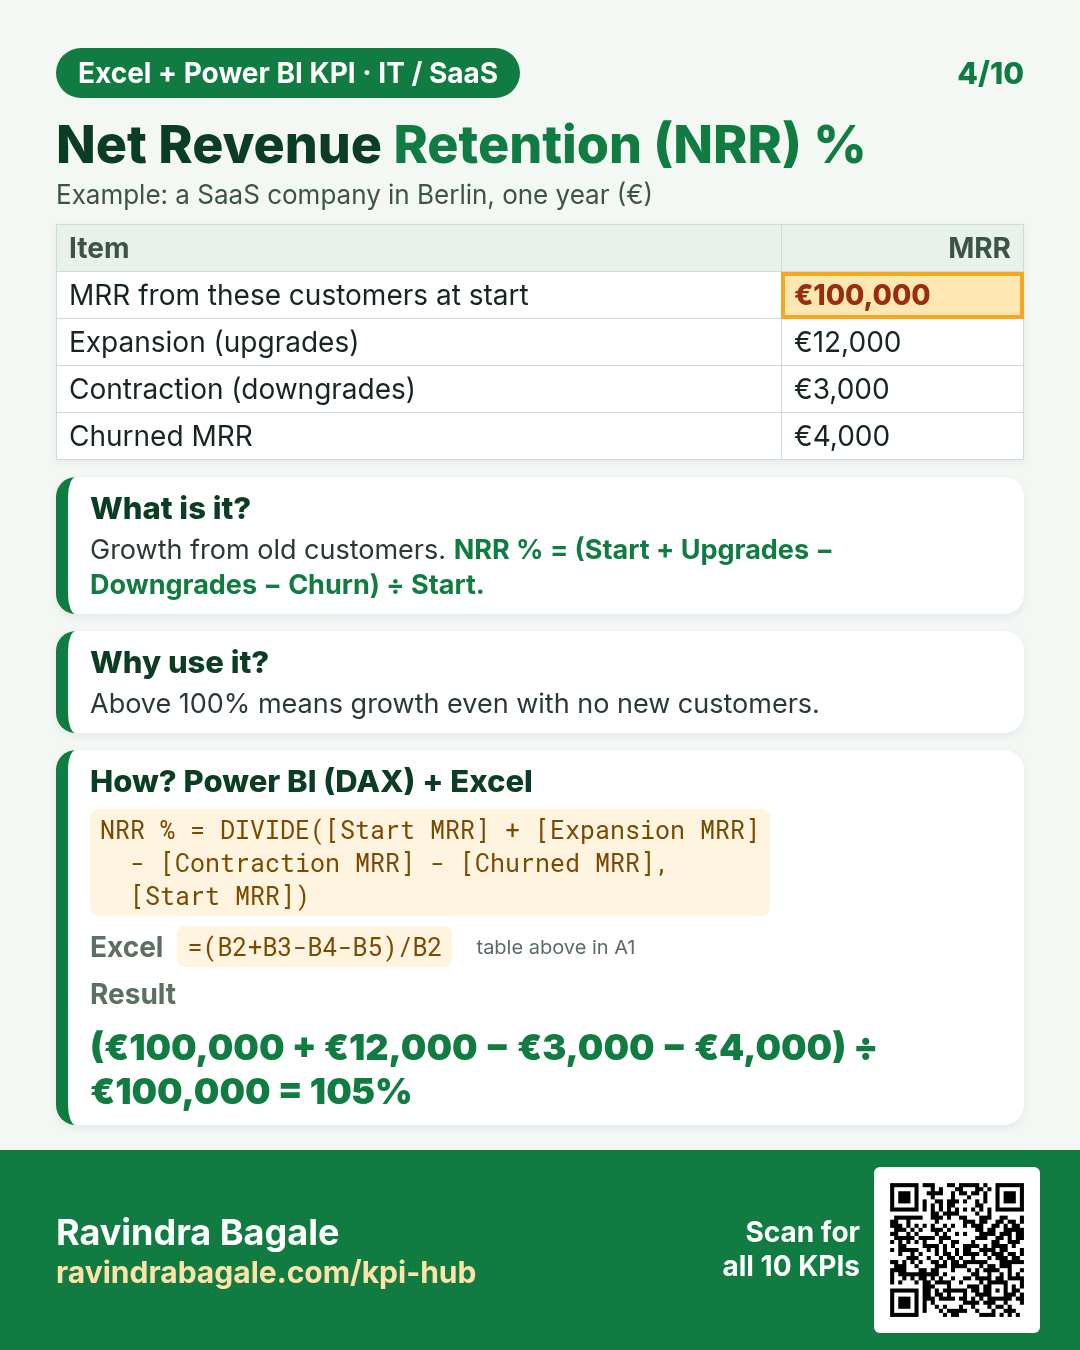
DAX: NRR % = DIVIDE([Start MRR] + [Expansion MRR] - [Contraction MRR] - [Churned MRR], [Start MRR])Excel: =(B2+B3-B4-B5)/B2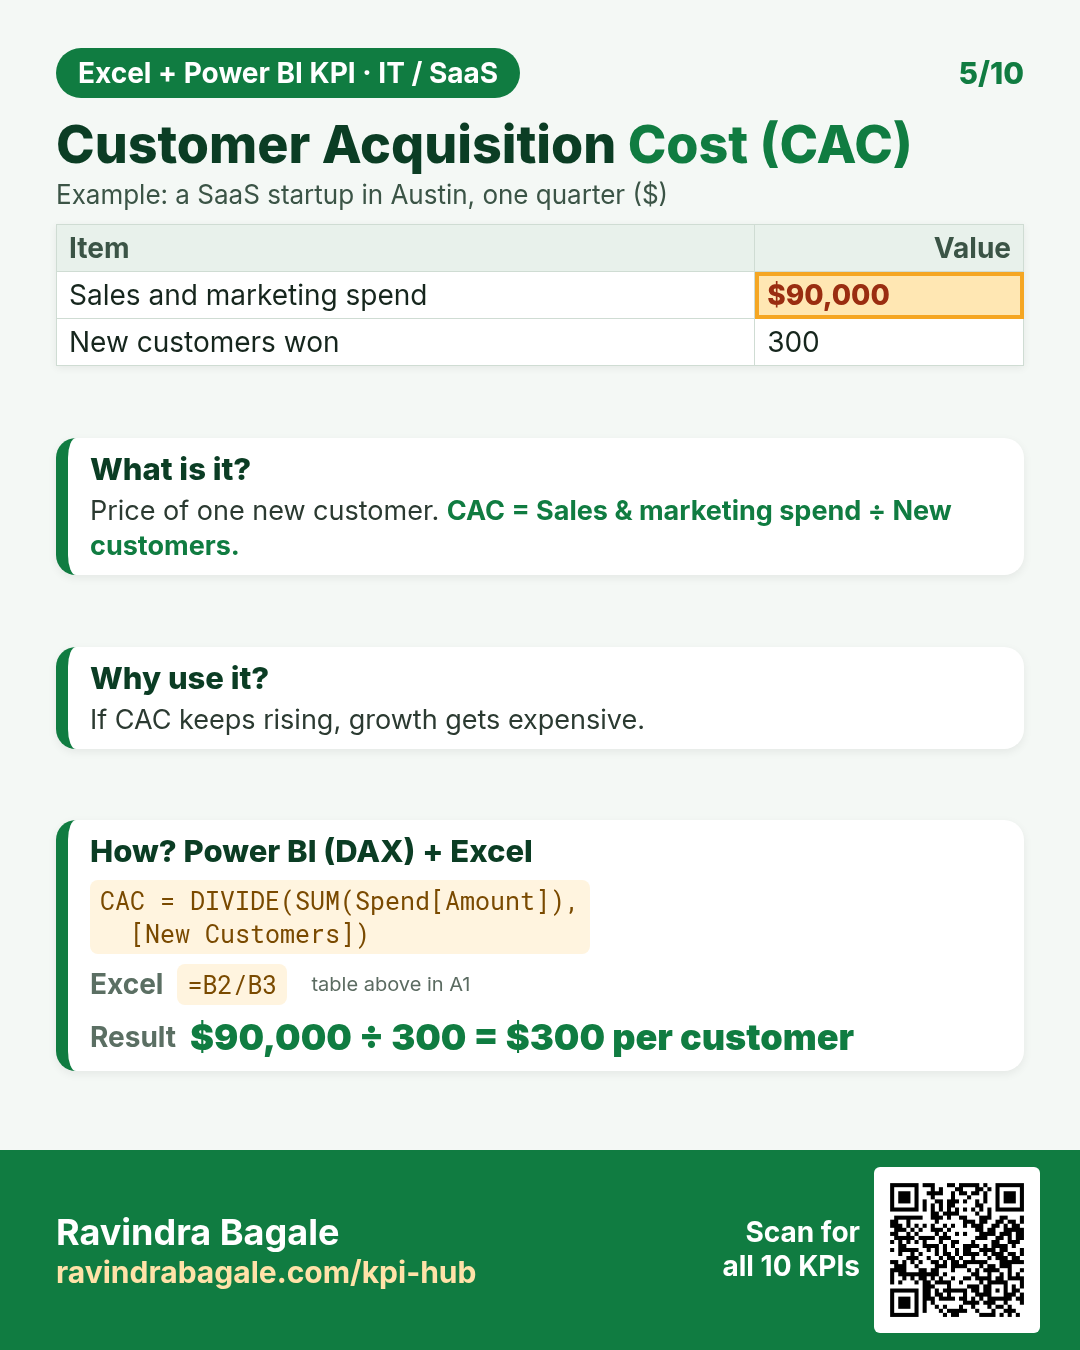
DAX: CAC = DIVIDE(SUM(Spend[Amount]), [New Customers])Excel: =B2/B3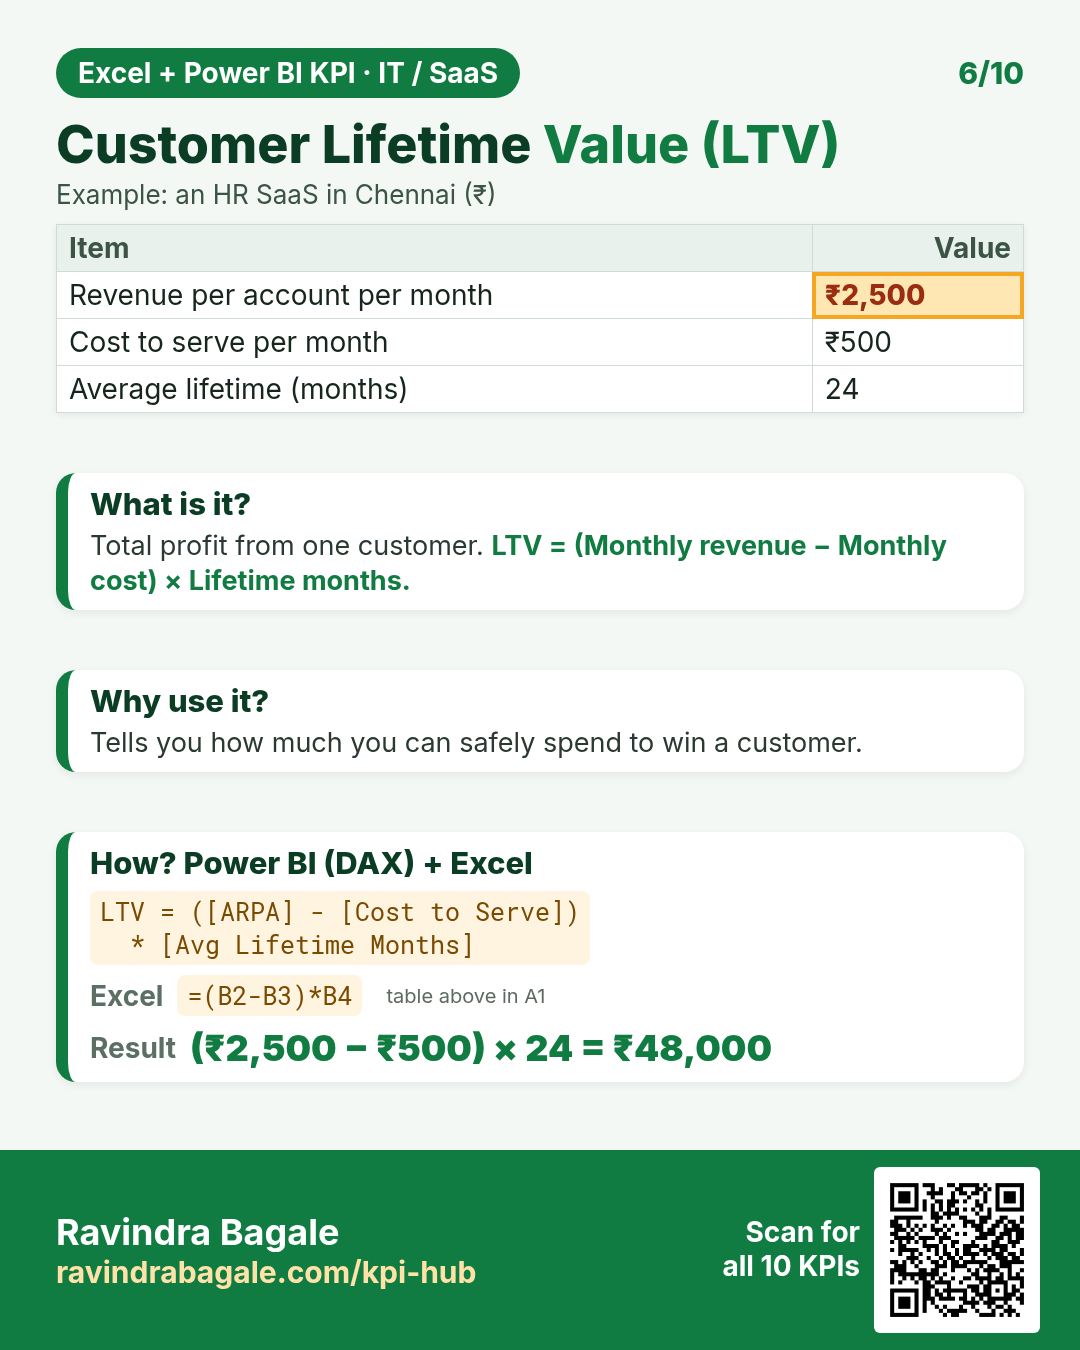
DAX: LTV = ([ARPA] - [Cost to Serve]) * [Avg Lifetime Months]Excel: =(B2-B3)*B4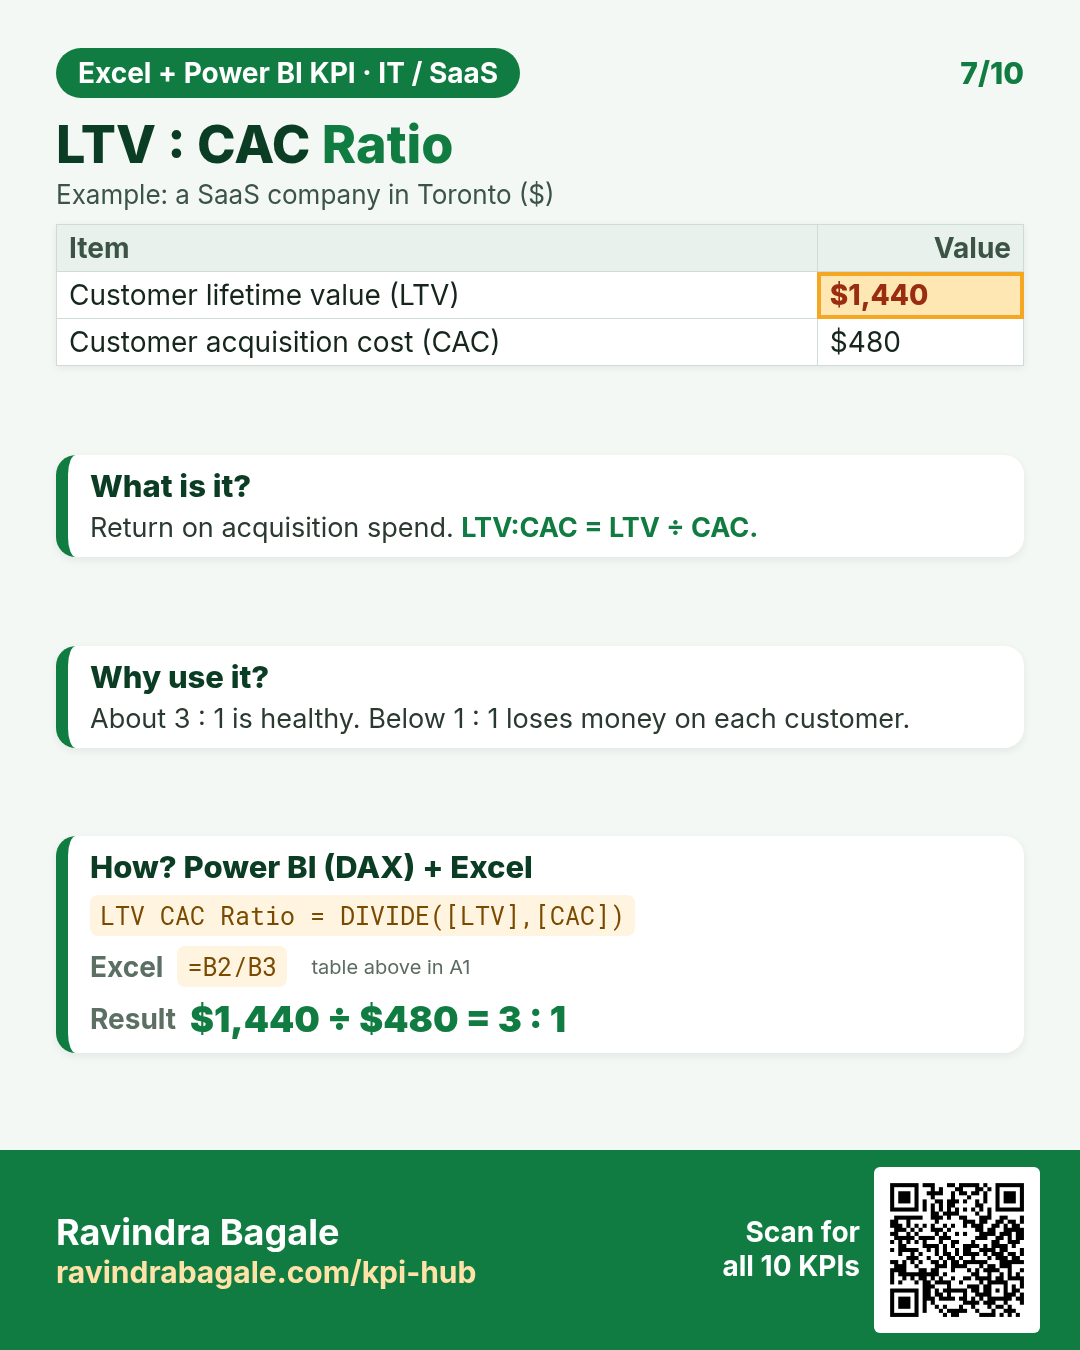
DAX: LTV CAC Ratio = DIVIDE([LTV],[CAC])Excel: =B2/B3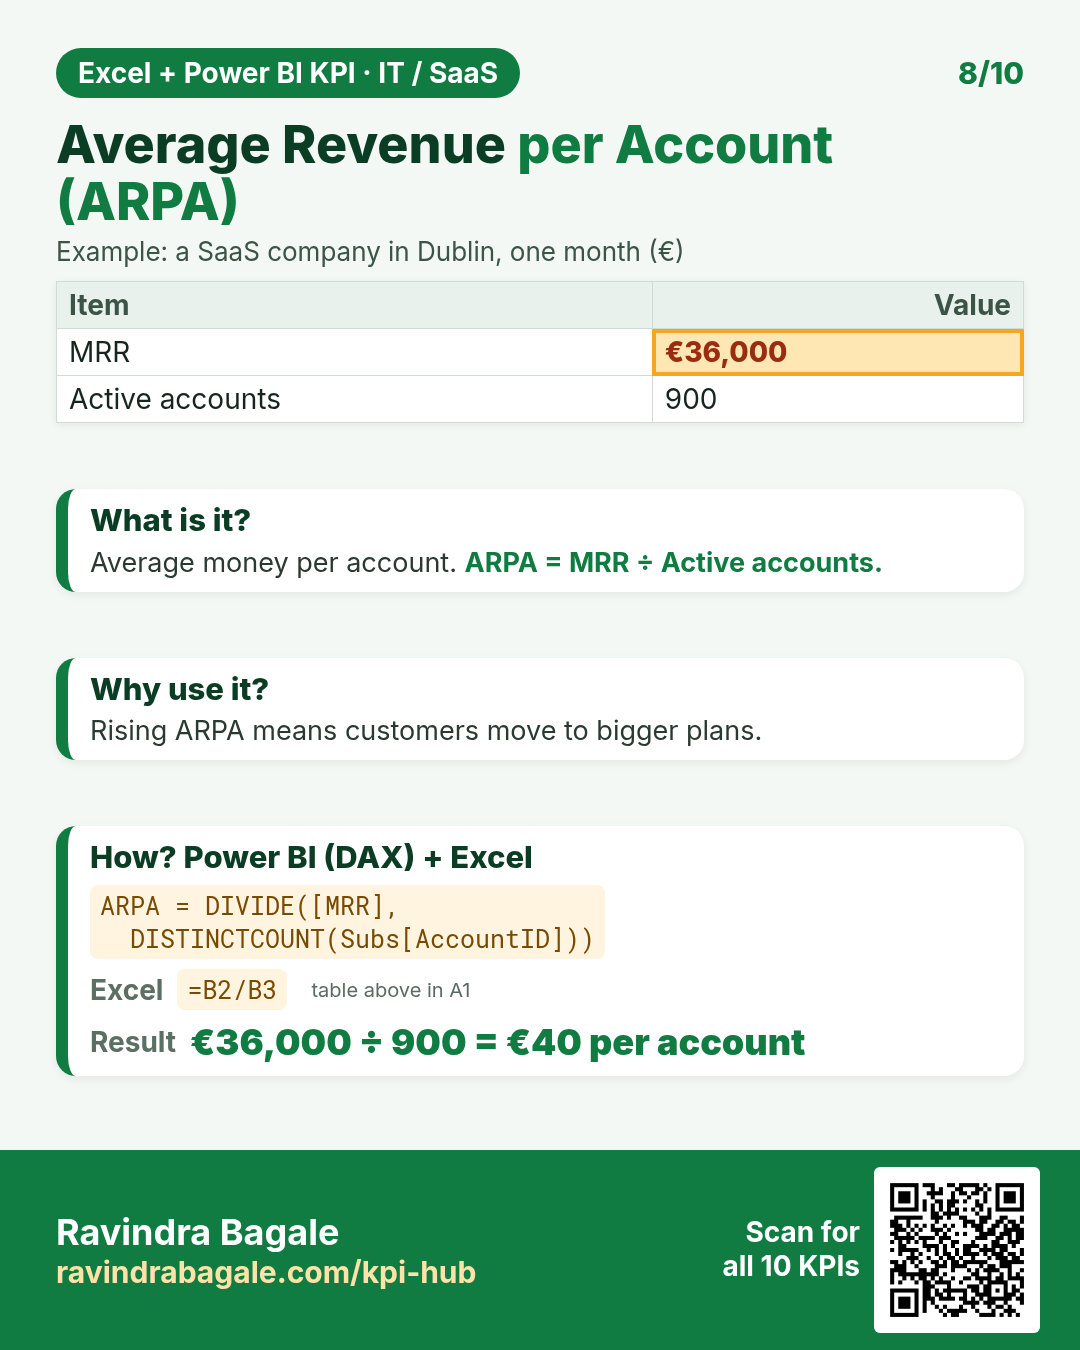
DAX: ARPA = DIVIDE([MRR], DISTINCTCOUNT(Subs[AccountID]))Excel: =B2/B3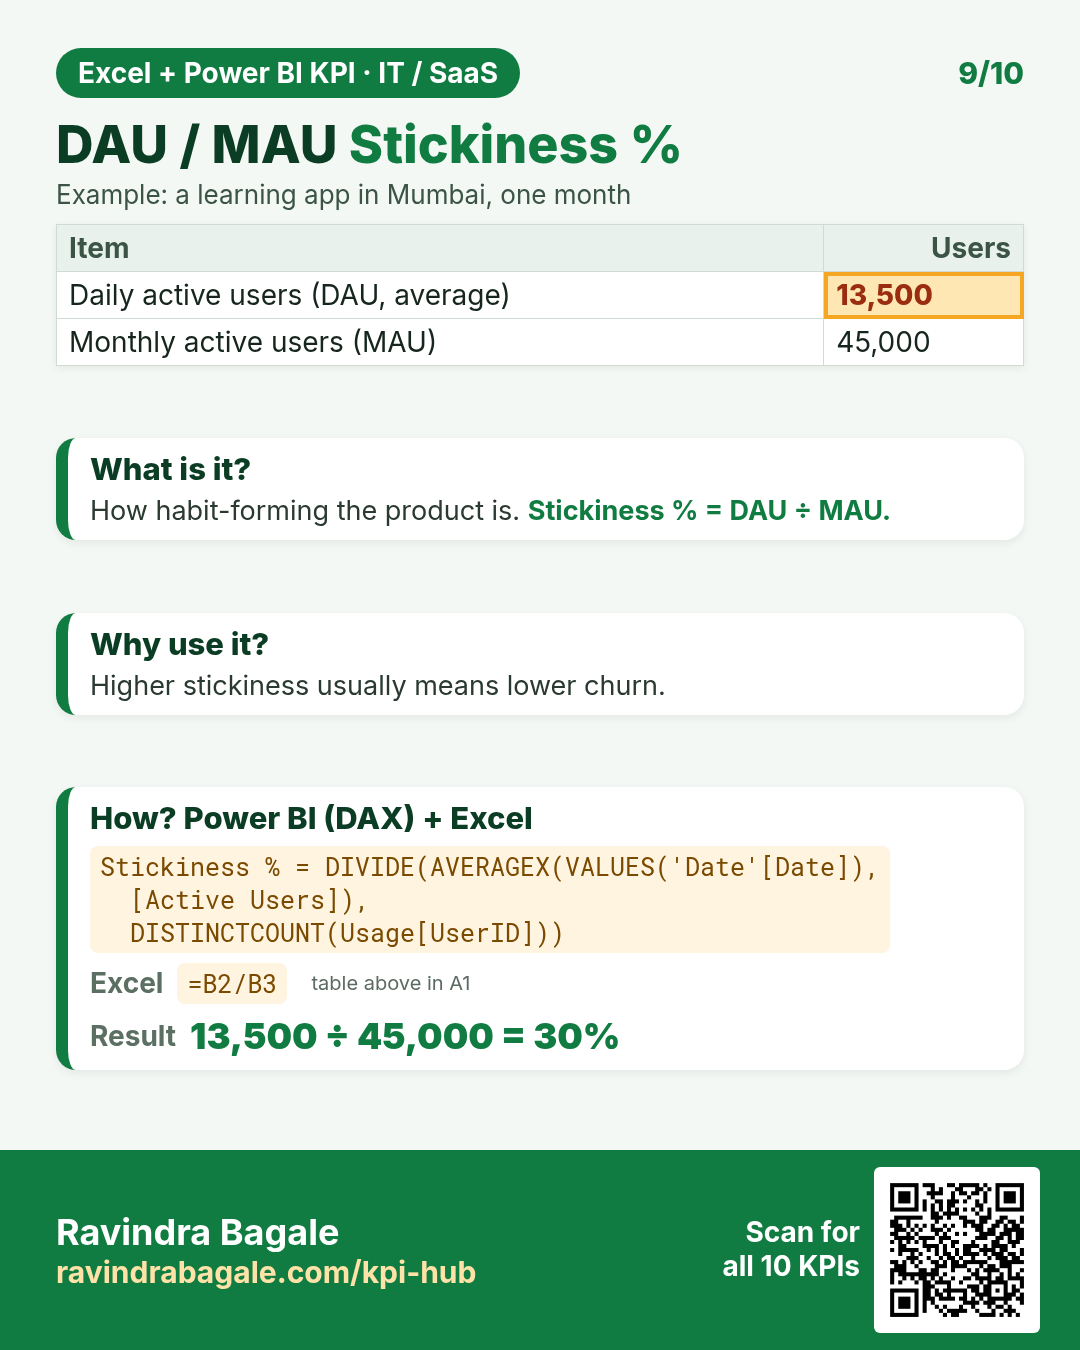
DAX: Stickiness % = DIVIDE(AVERAGEX(VALUES('Date'[Date]), [Active Users]), DISTINCTCOUNT(Usage[UserID]))Excel: =B2/B3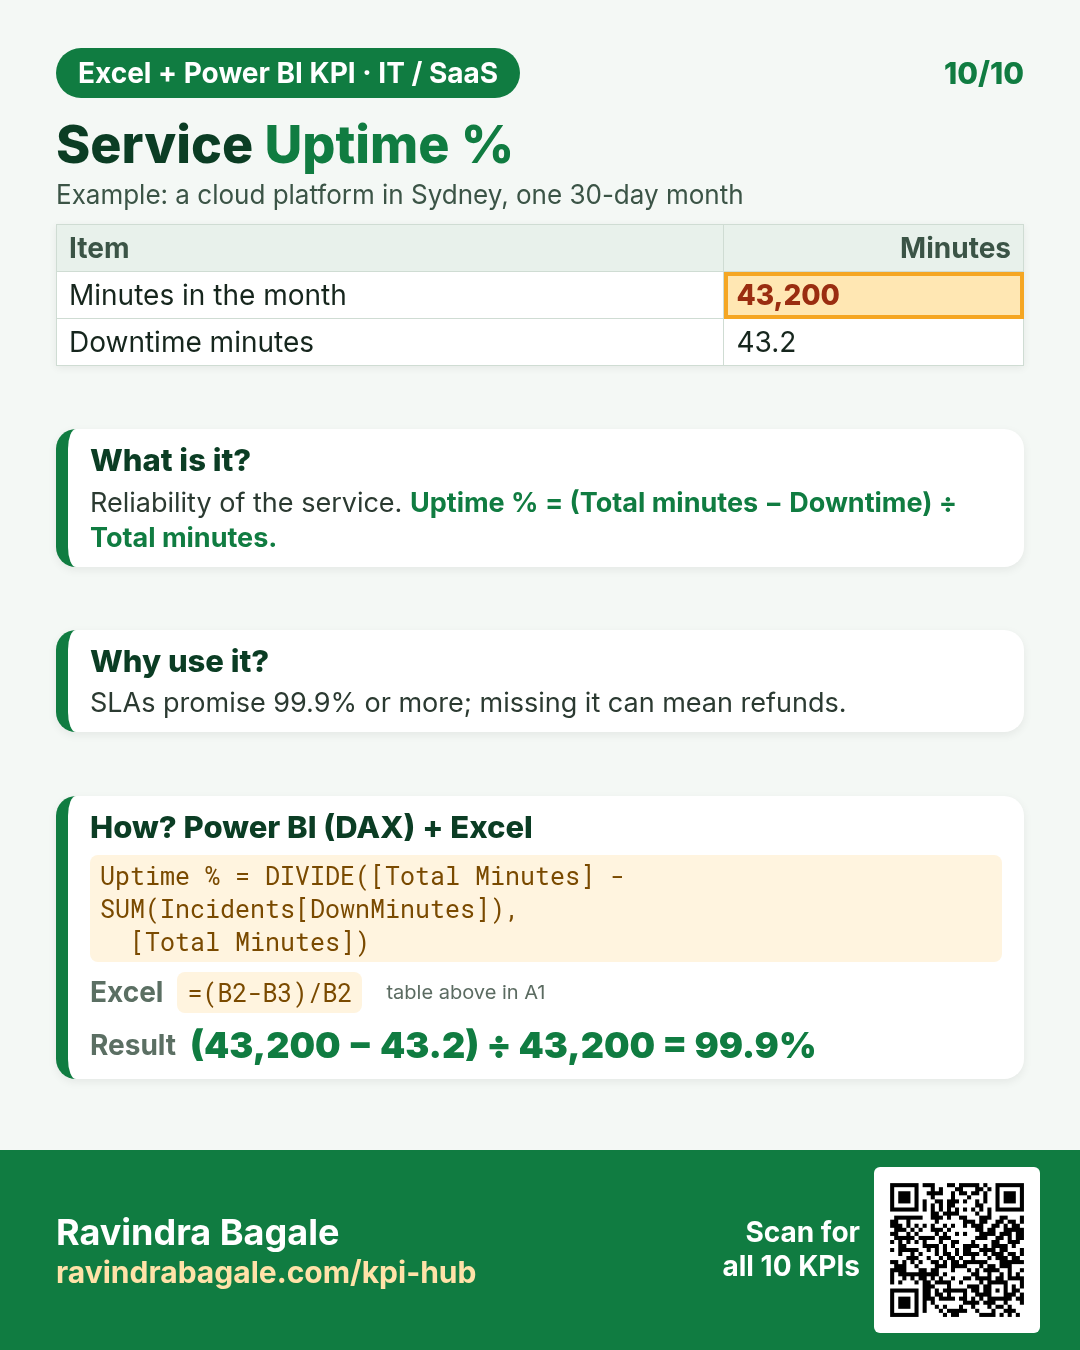
DAX: Uptime % = DIVIDE([Total Minutes] - SUM(Incidents[DownMinutes]), [Total Minutes])Excel: =(B2-B3)/B2Quick quiz
1. Monthly Recurring Revenue (MRR): Basic 300 × $40, Pro 120 × $100. The answer is…
2. Annual Recurring Revenue (ARR): MRR (this month) ₹18,50,000. The answer is…
3. Customer Churn Rate %: Customers at start of month 1,200, Customers who cancelled 54. The answer is…
4. Which KPI means: “Revenue kept from old customers, including upgrades.”