KPI Hub for Excel and Power BI
Every important KPI for each type of business, on one simple card: what it means, why it matters, the Excel formula, the Power BI DAX measure and a tiny worked example in ₹ $ £ €.
113KPI cards
11business sets live
0more coming
No KPI found. Try another word.
KPIs by business
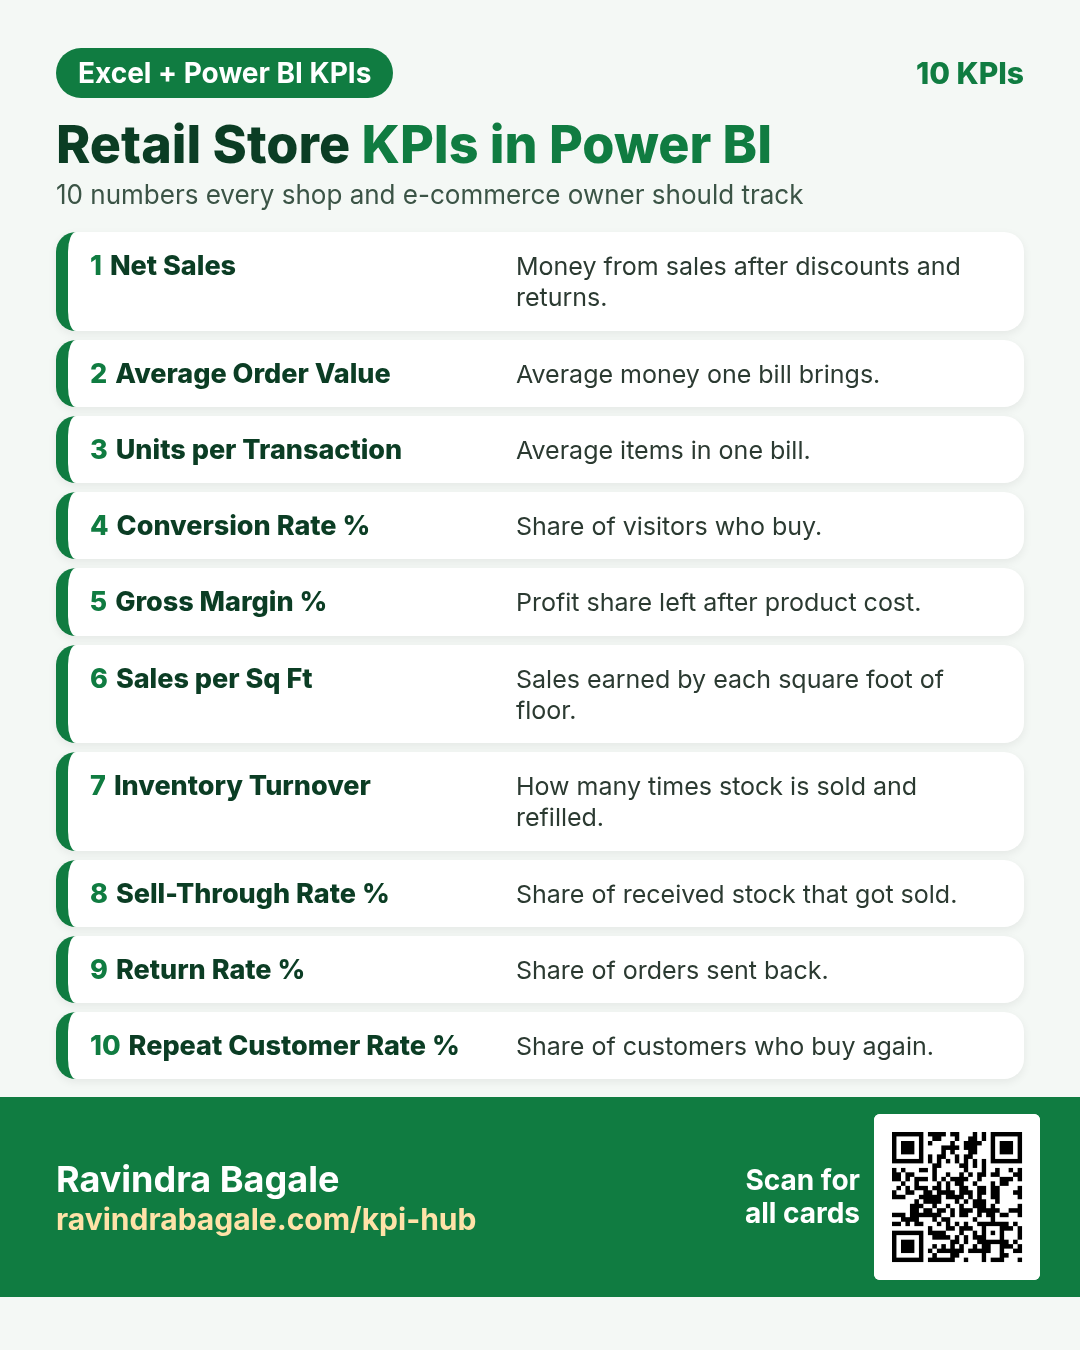 LiveRetail Store KPIs10 KPI cards + quiz
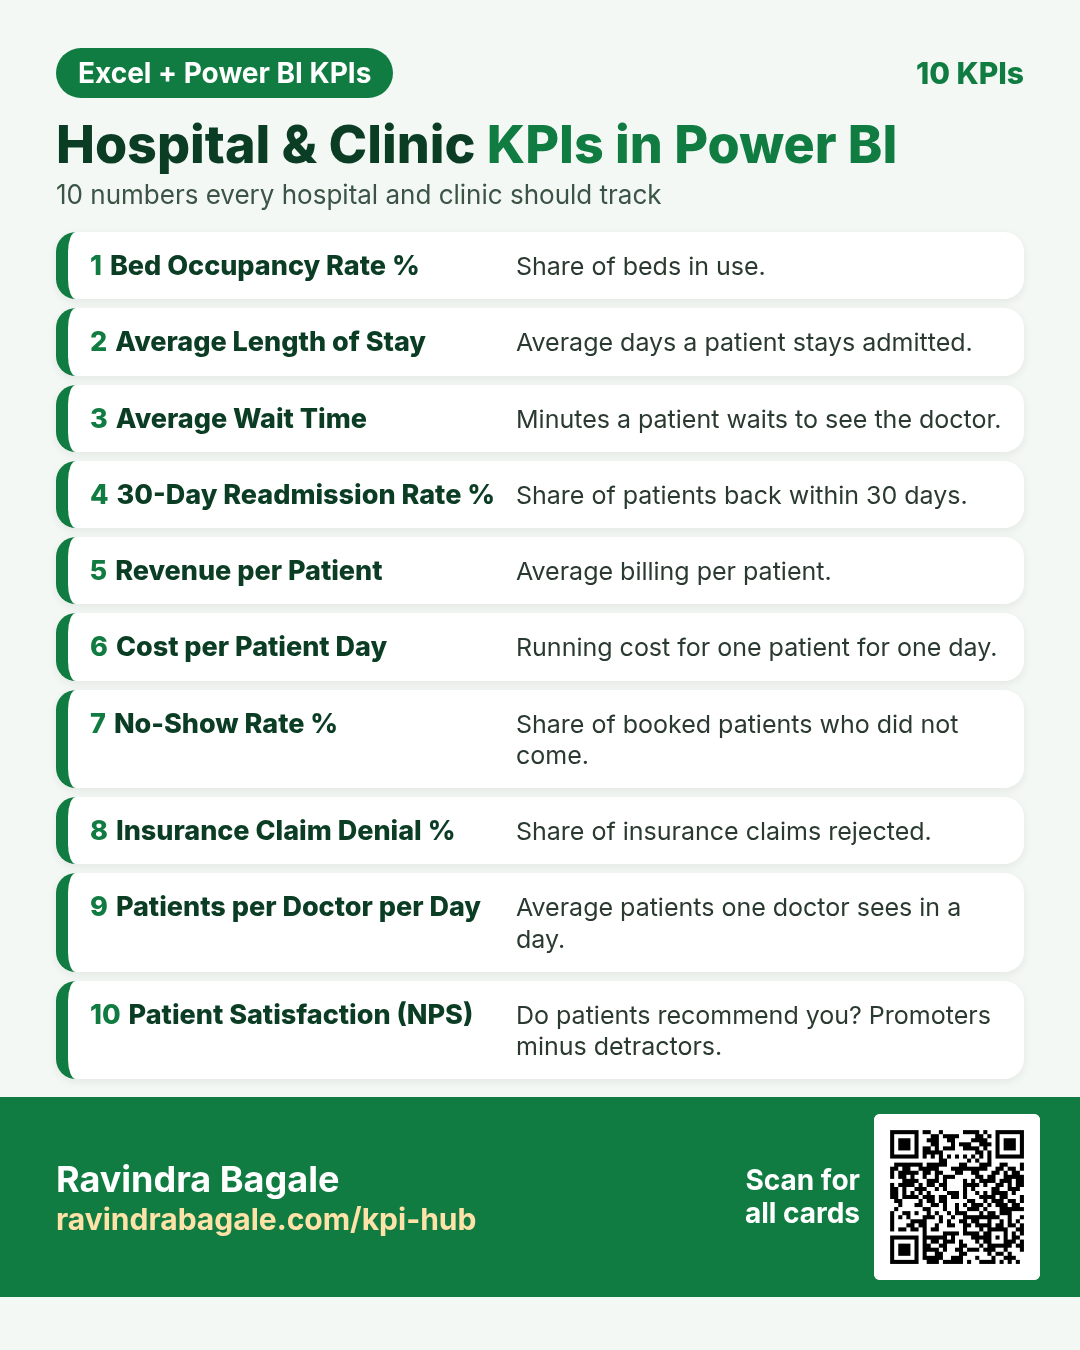 LiveHospital & Clinic KPIs10 KPI cards + quiz
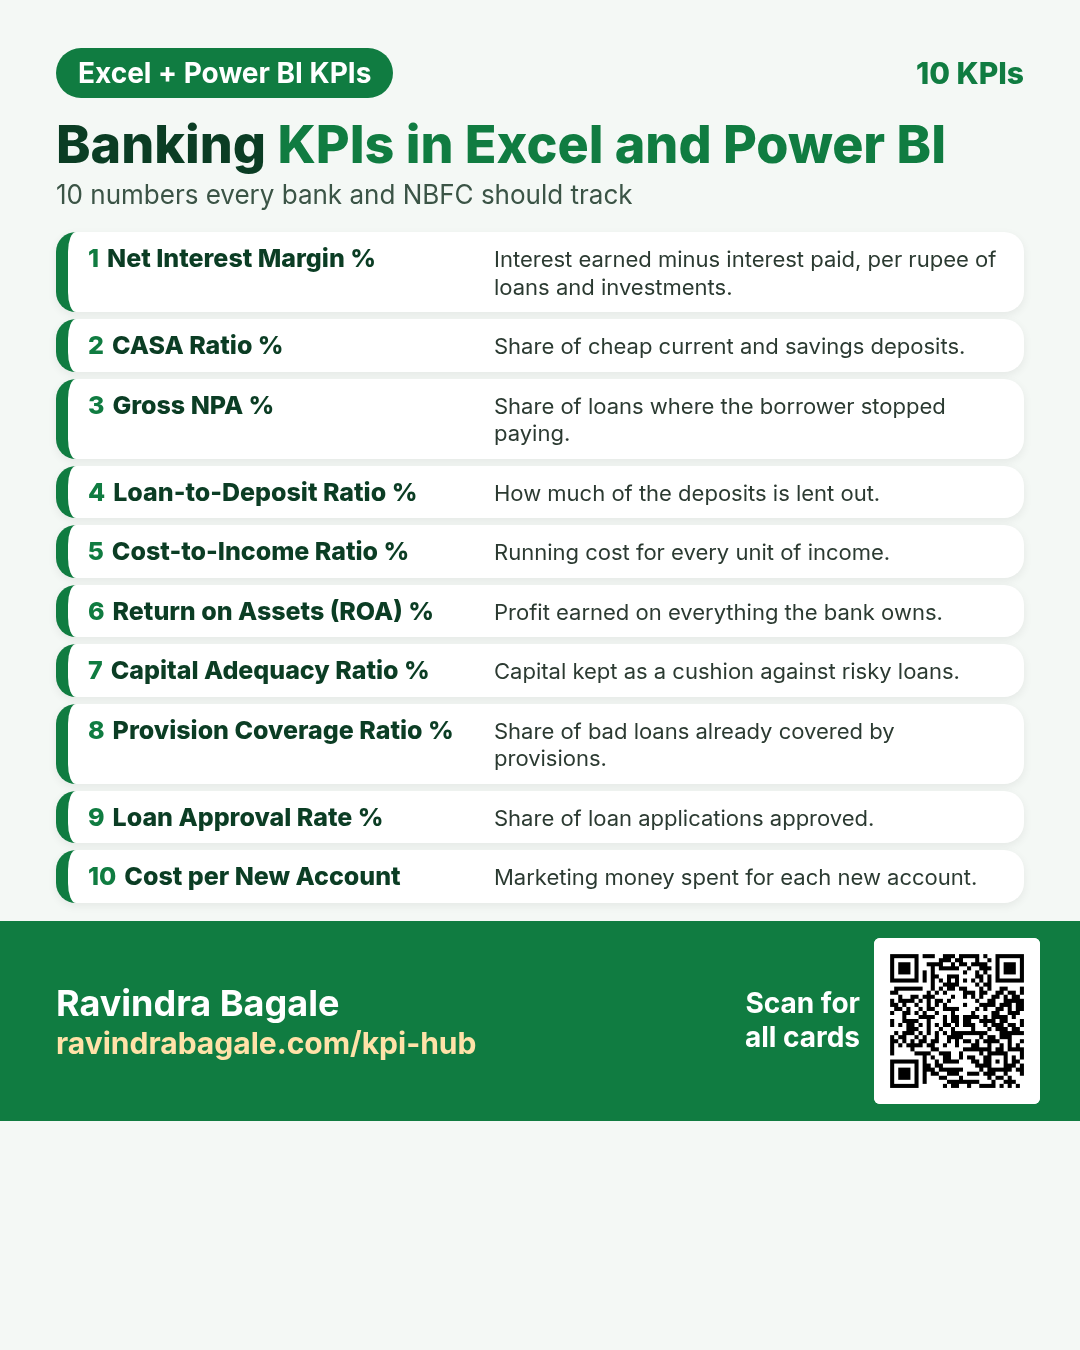 LiveBanking KPIs10 KPI cards + quiz
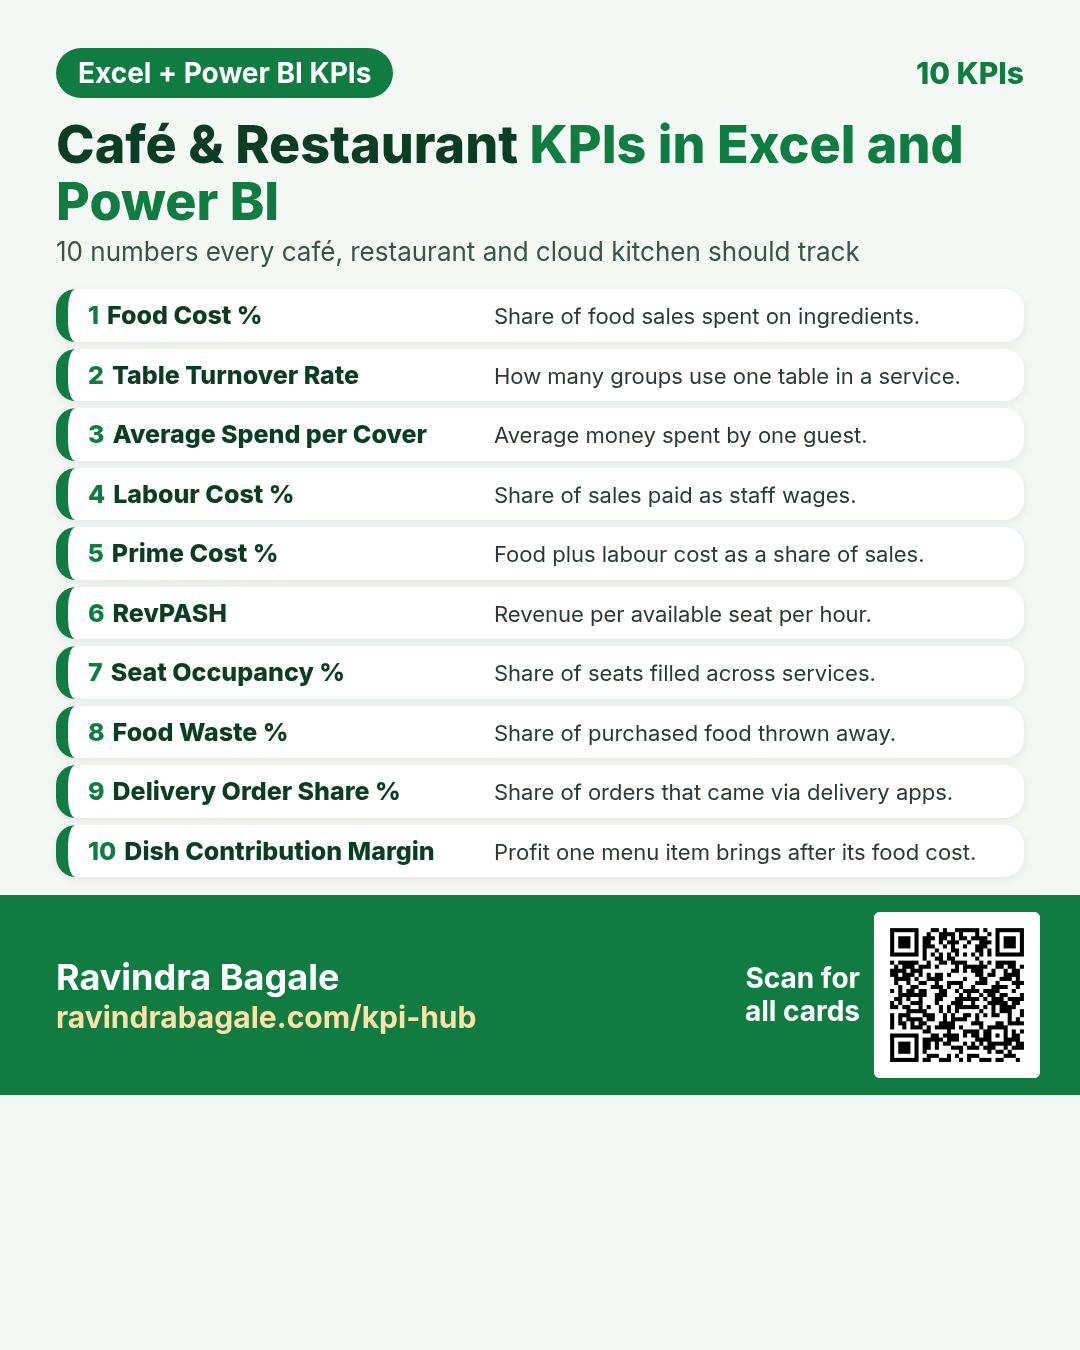 LiveCafé & Restaurant KPIs10 KPI cards + quiz
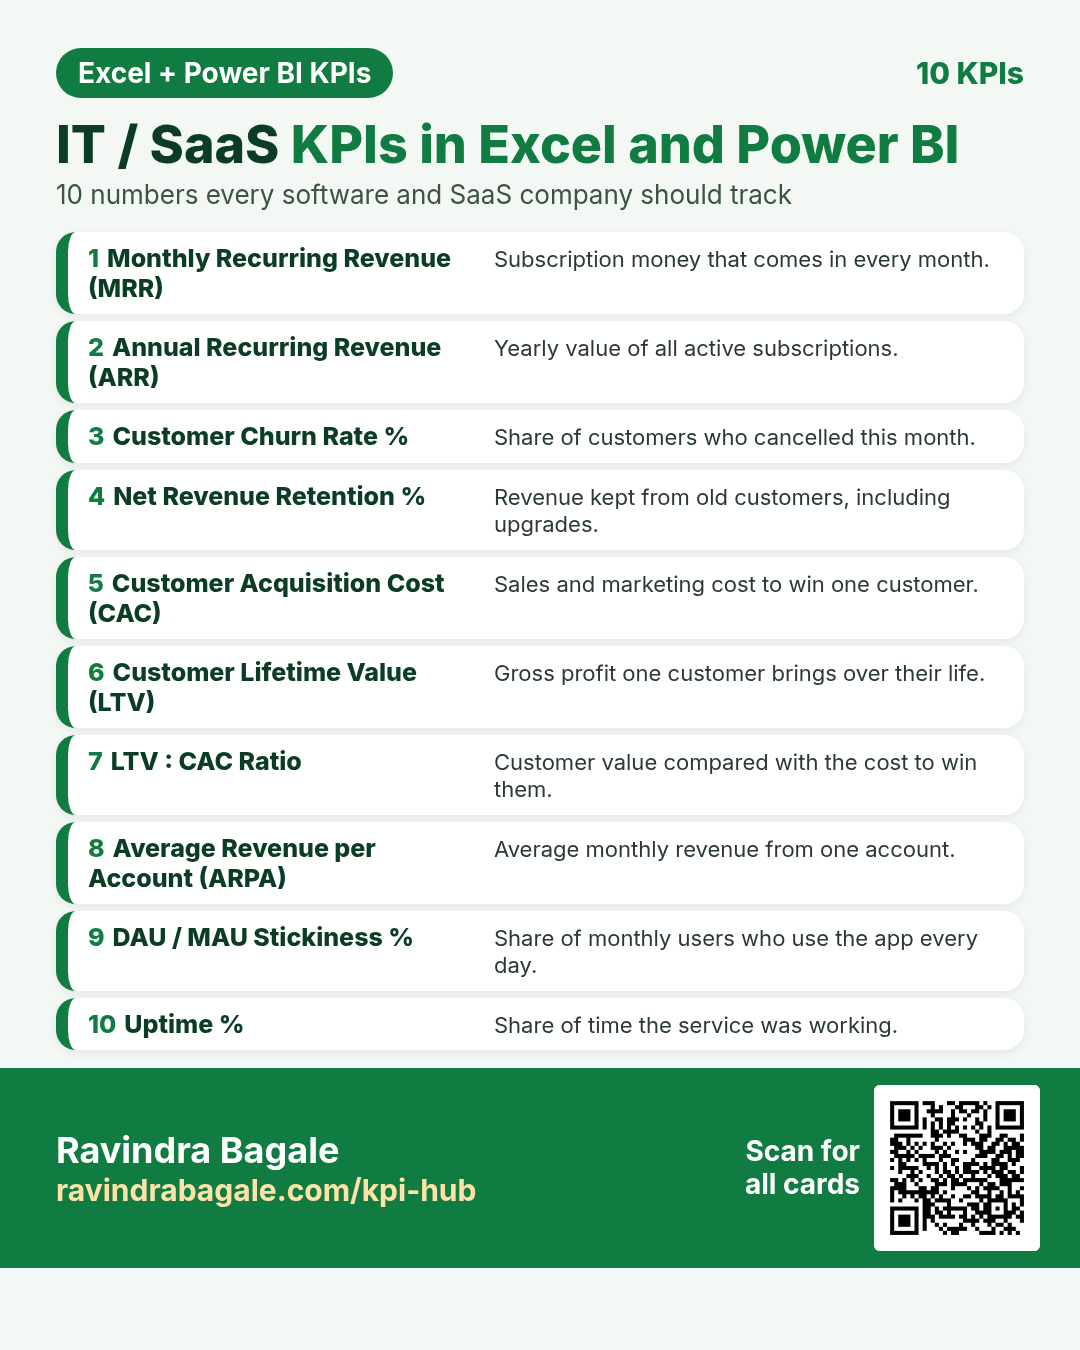 LiveIT / SaaS KPIs10 KPI cards + quiz
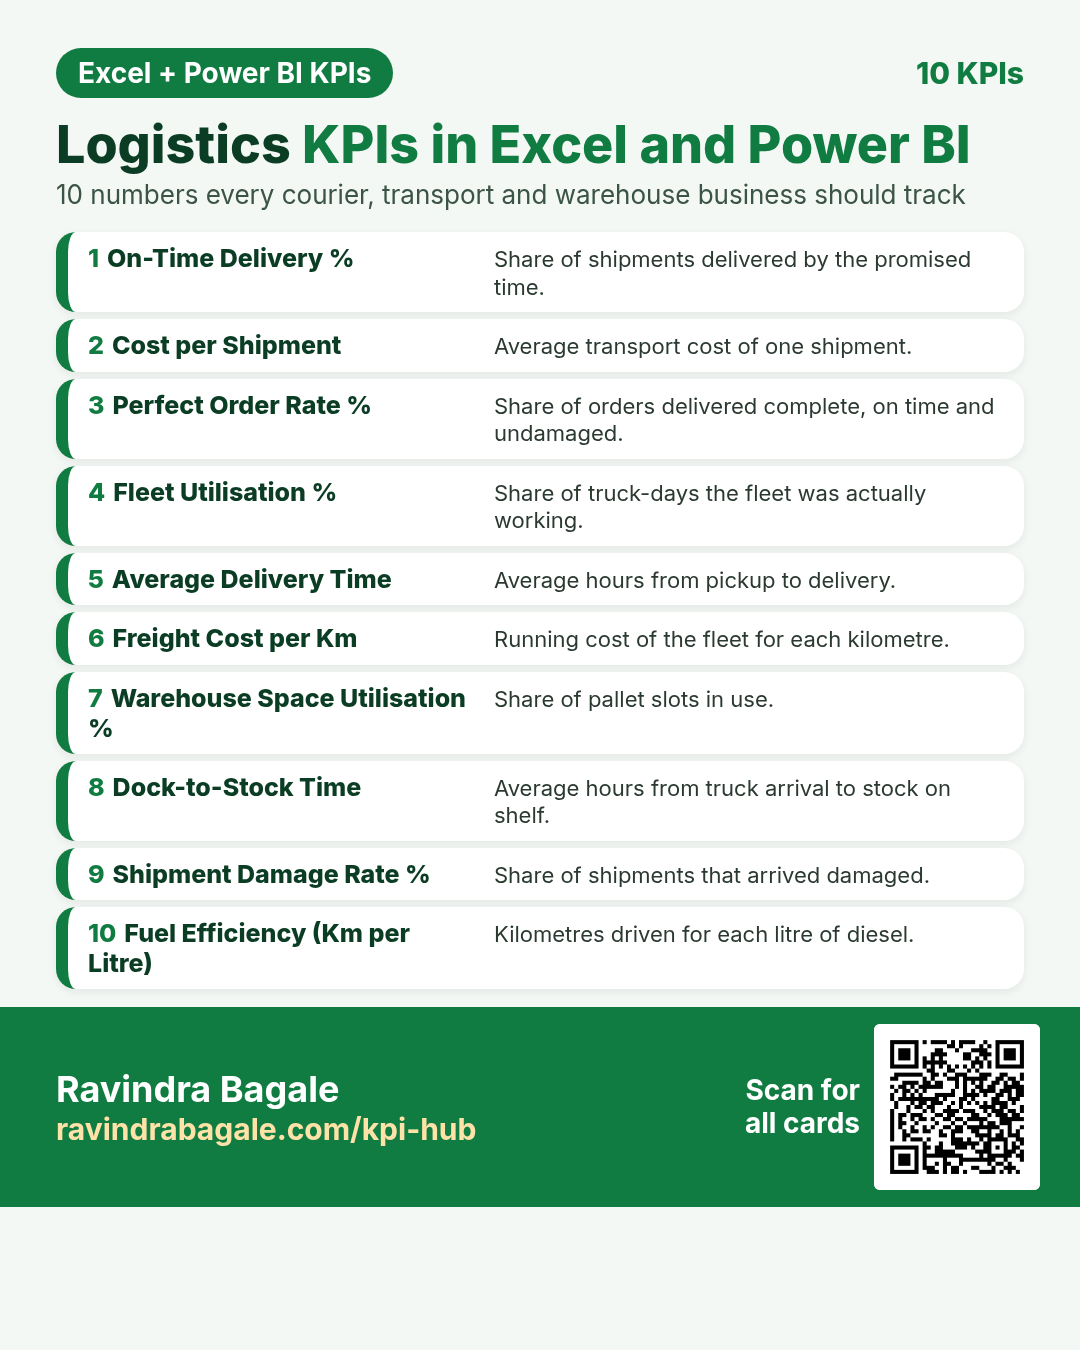 LiveLogistics KPIs10 KPI cards + quiz
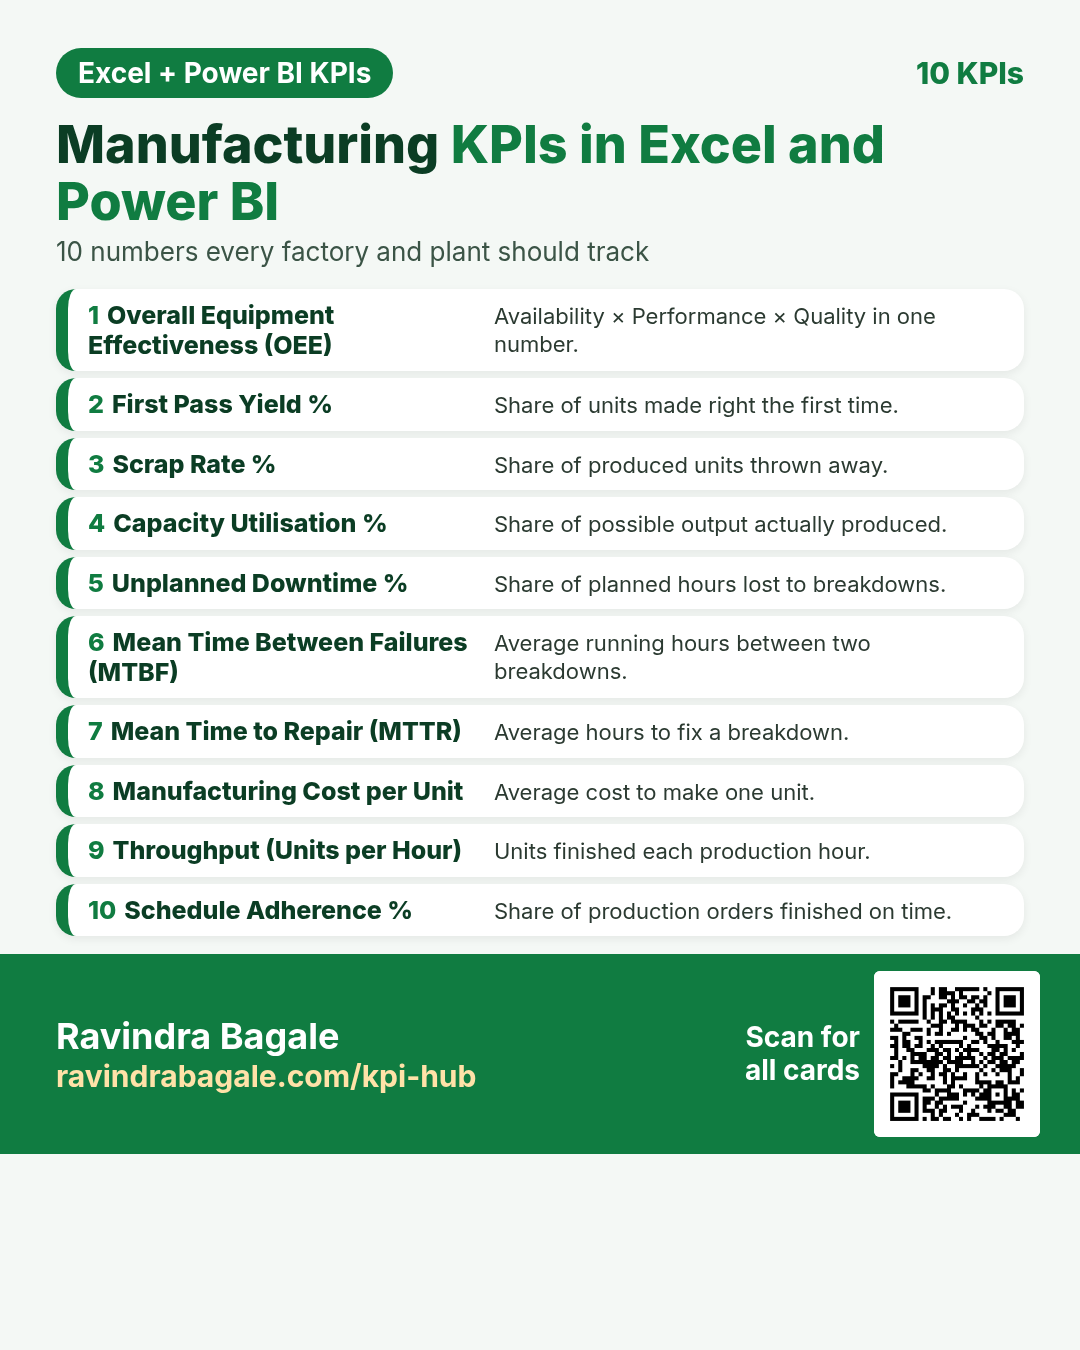 LiveManufacturing KPIs10 KPI cards + quiz
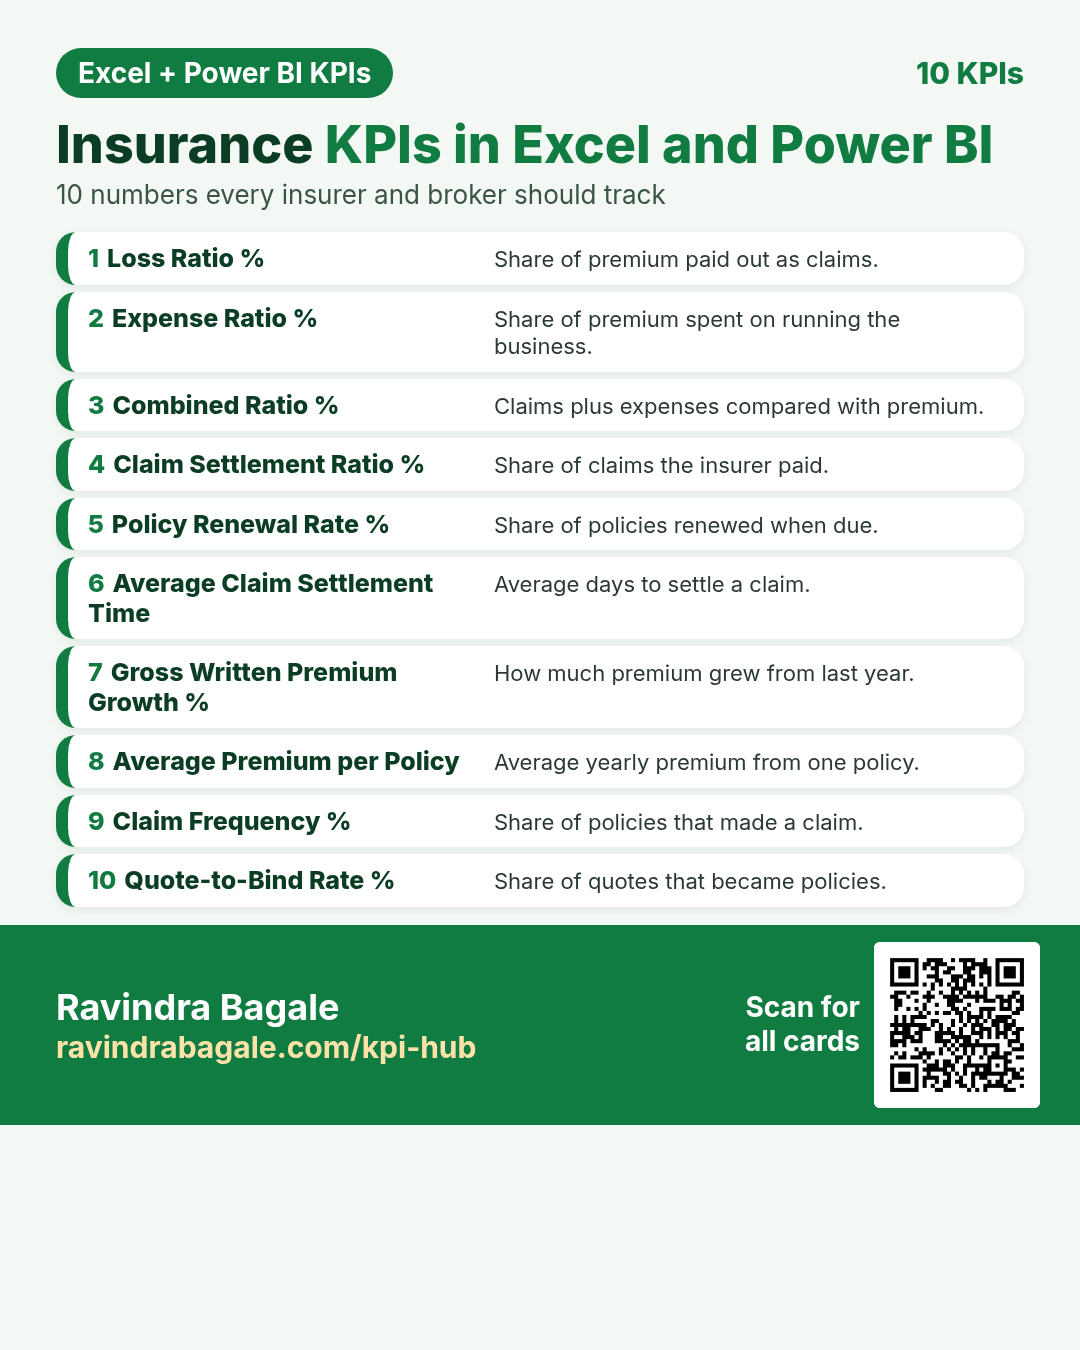 LiveInsurance KPIs10 KPI cards + quiz
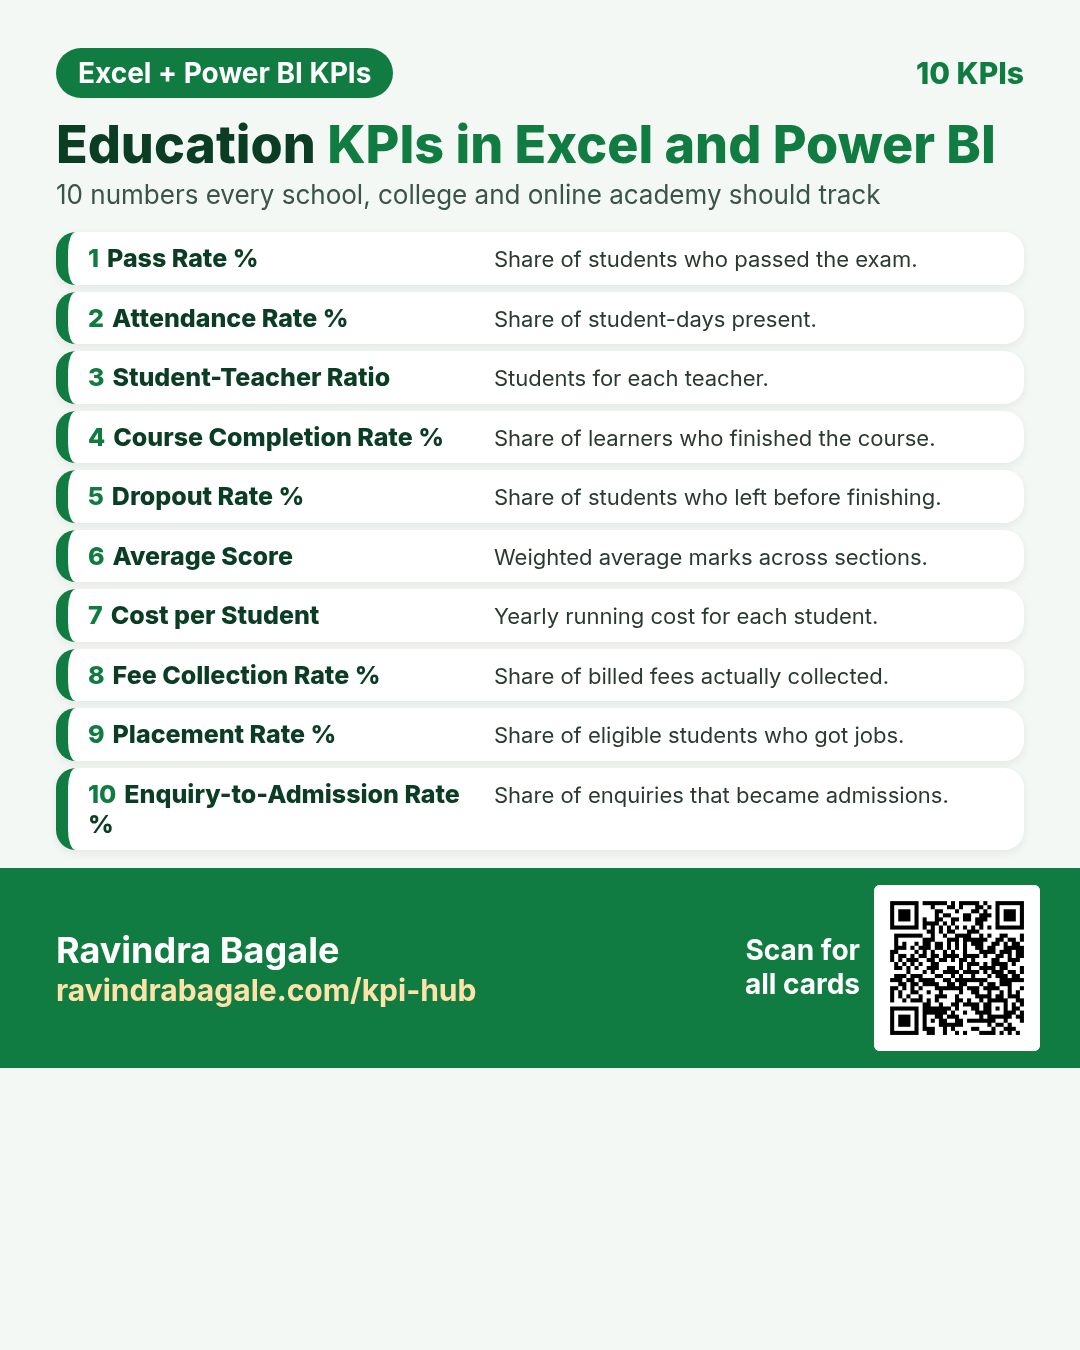 LiveEducation KPIs10 KPI cards + quiz
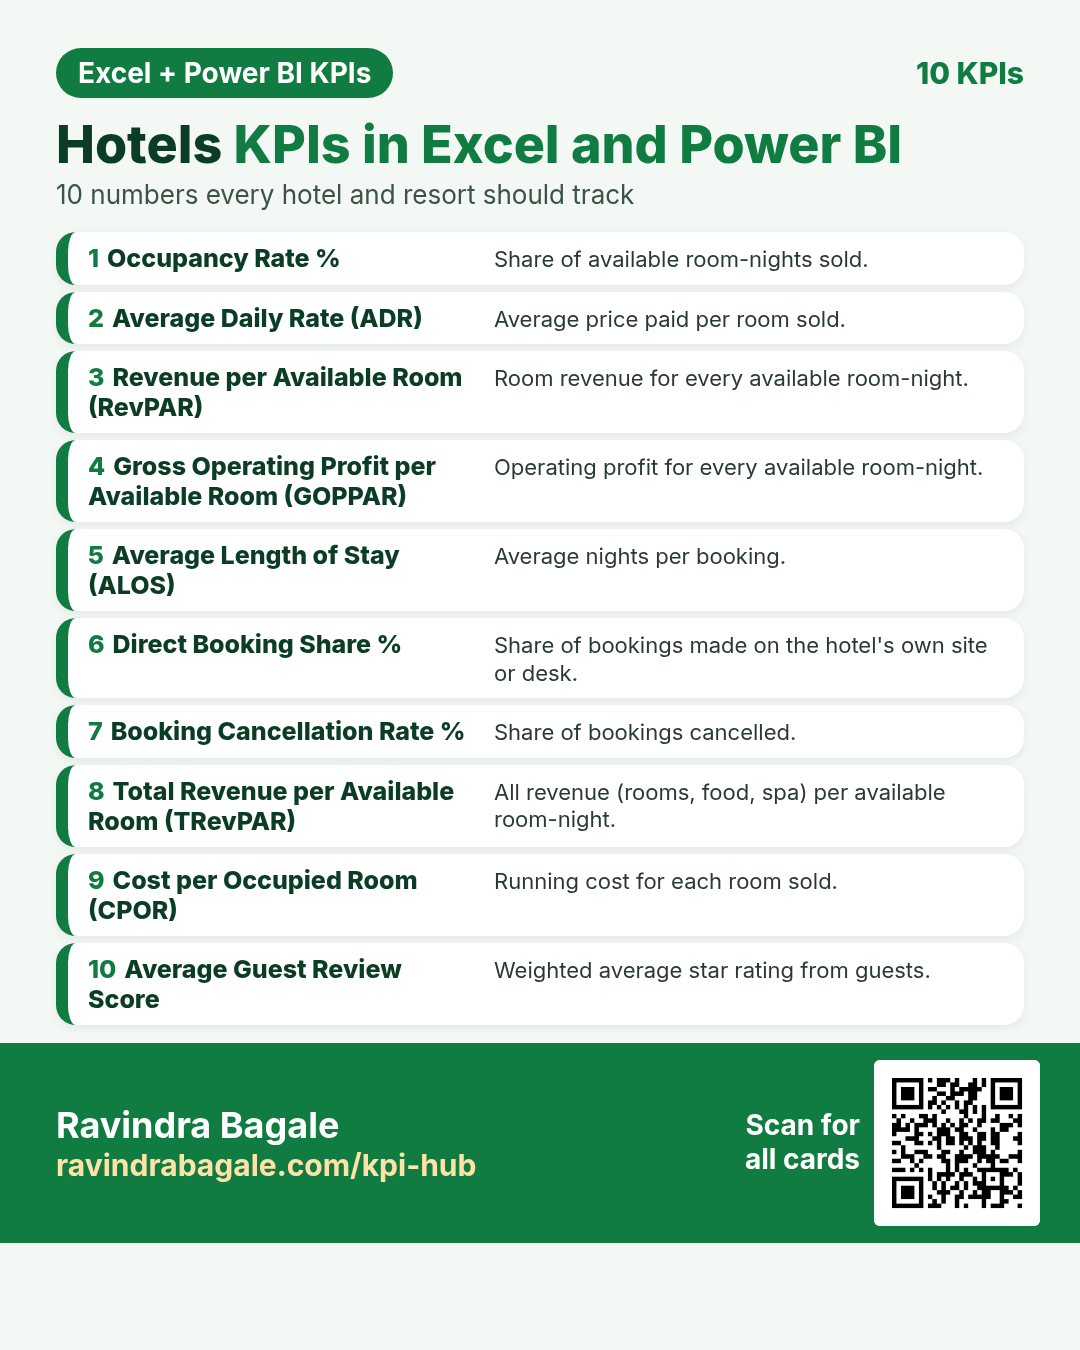 LiveHotels KPIs10 KPI cards + quiz
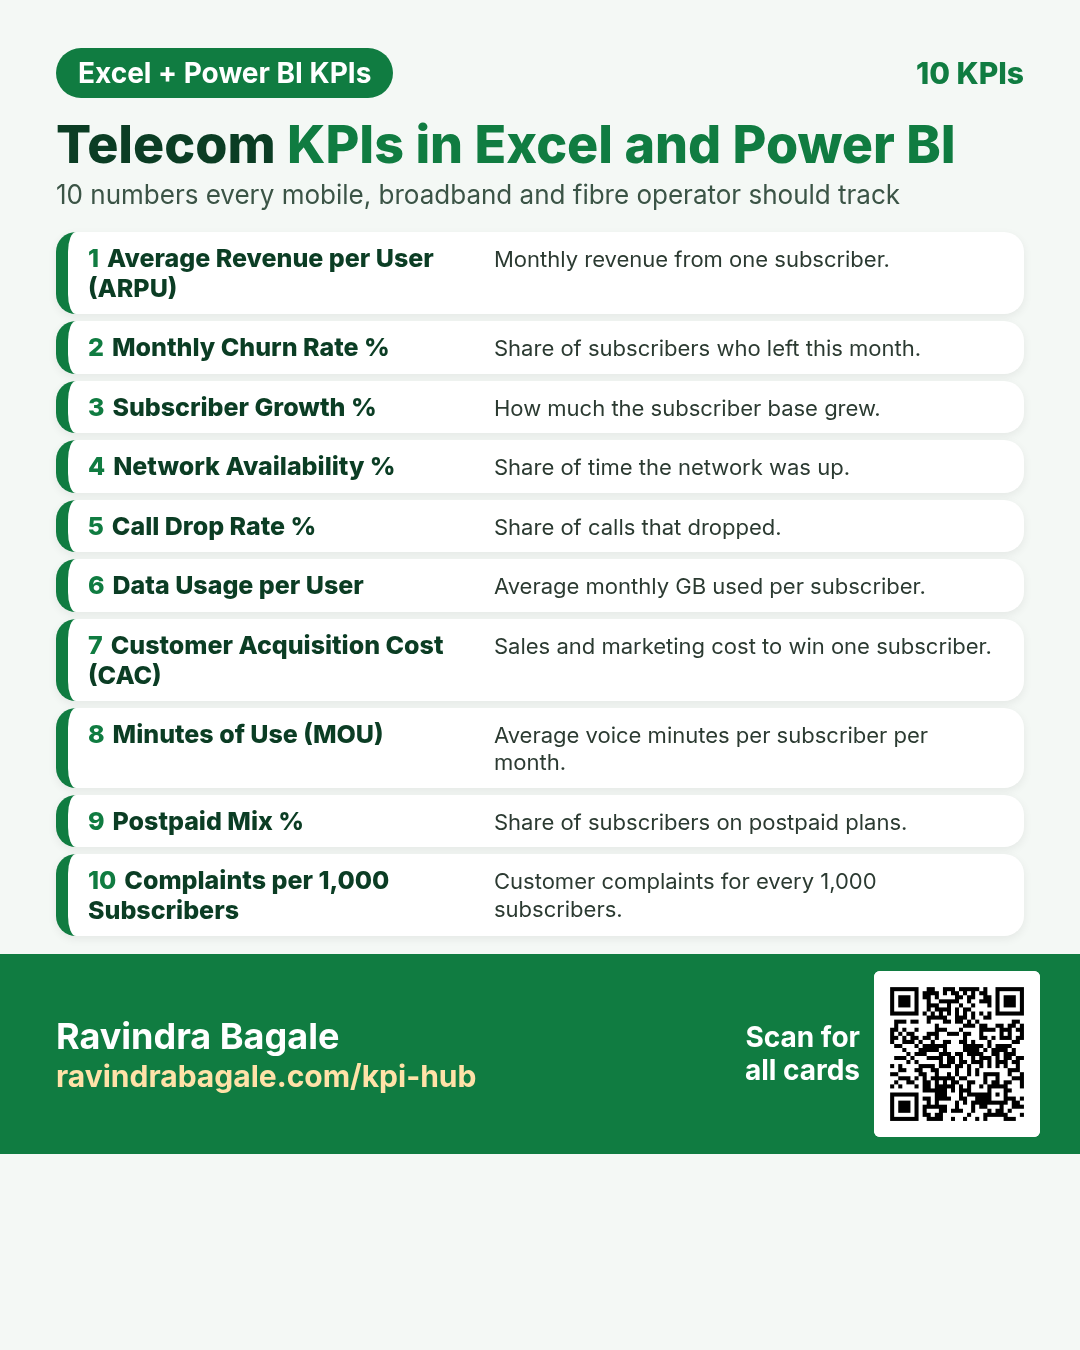 LiveTelecom KPIs10 KPI cards + quizChapterSales & Revenue KPIsChapter: Total Revenue, Gross Sales, Net Sales, AOV, Sales Growth % + 12 practice tasks
General KPI cards (Power BI)
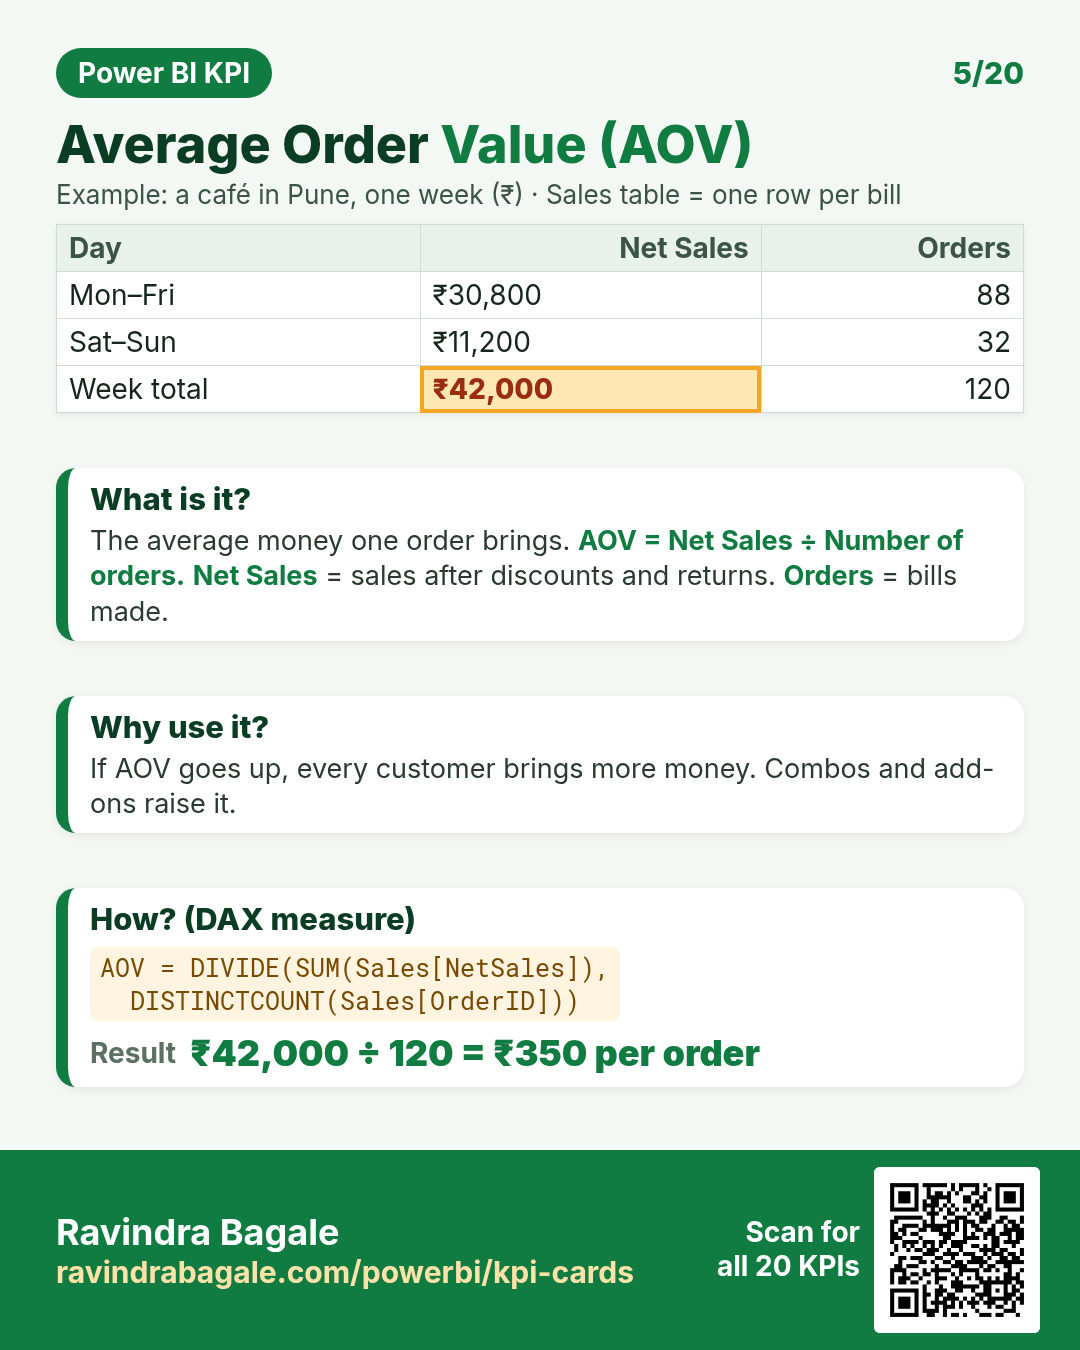 CardAverage Order Value (AOV)Average money one order brings.
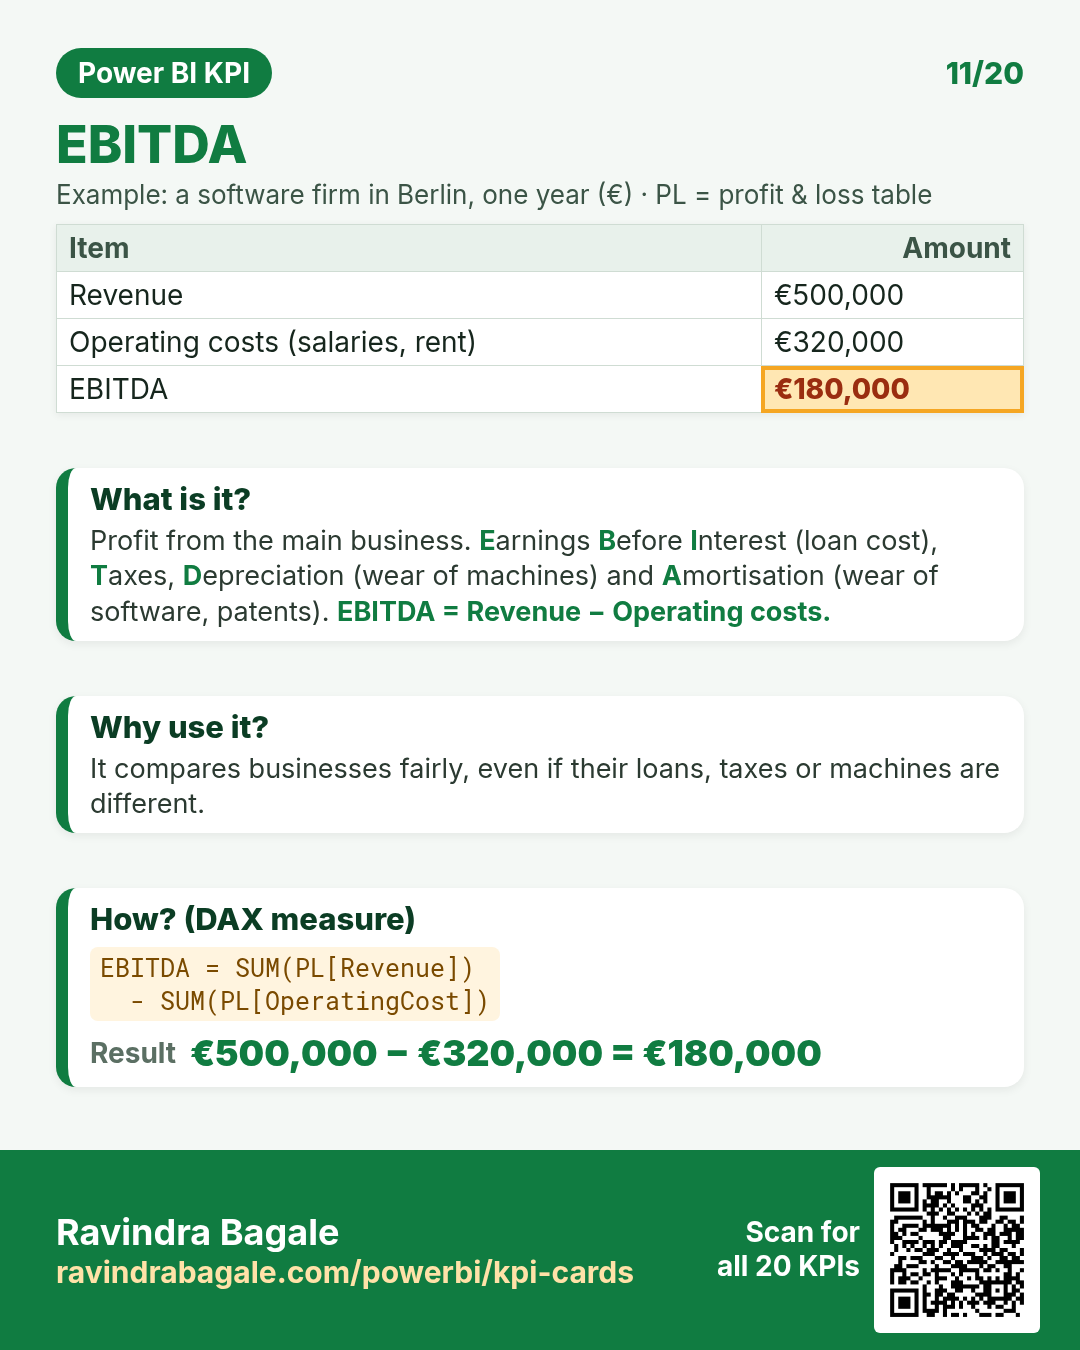 CardEBITDAProfit from the main business before interest, tax and wear.
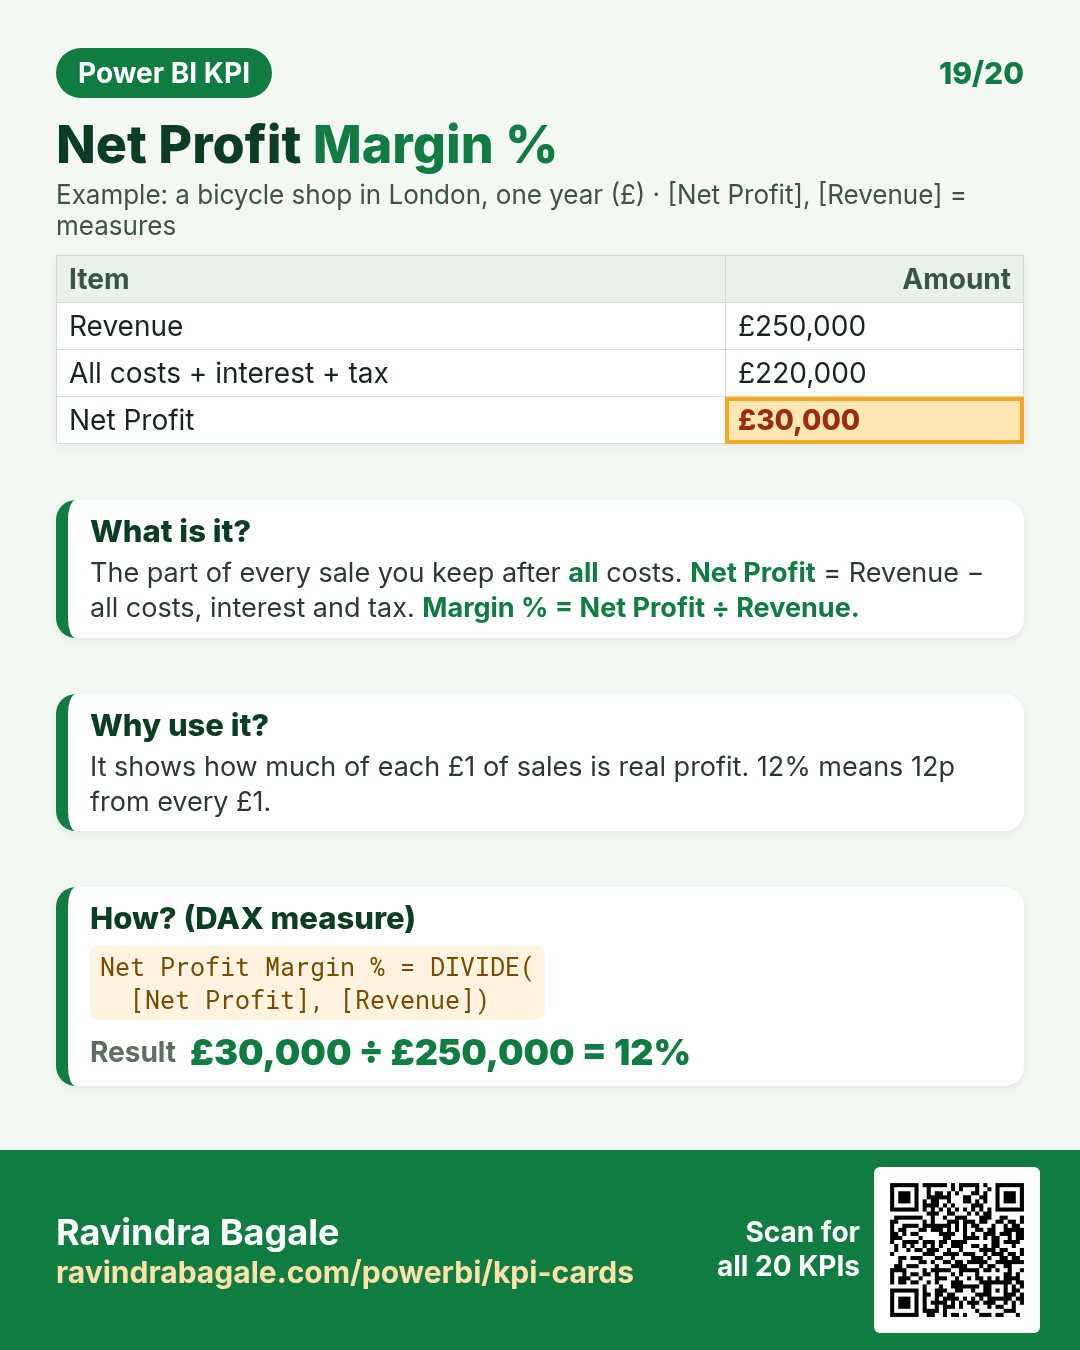 CardNet Profit Margin %Part of each sale kept after all costs.
All KPIs A–Z
- 30-Day Readmission Rate % (Hospital): Share of patients back within 30 days.
- Annual Recurring Revenue (ARR) (SaaS): Yearly value of all active subscriptions.
- Attendance Rate % (Education): Share of student-days present.
- Average Claim Settlement Time (Insurance): Average days to settle a claim.
- Average Daily Rate (ADR) (Hotels): Average price paid per room sold.
- Average Delivery Time (Logistics): Average hours from pickup to delivery.
- Average Guest Review Score (Hotels): Weighted average star rating from guests.
- Average Length of Stay (Hospital): Average days a patient stays admitted.
- Average Length of Stay (ALOS) (Hotels): Average nights per booking.
- Average Order Value (Retail): Average money one bill brings.
- Average Premium per Policy (Insurance): Average yearly premium from one policy.
- Average Revenue per Account (ARPA) (SaaS): Average monthly revenue from one account.
- Average Revenue per User (ARPU) (Telecom): Monthly revenue from one subscriber.
- Average Score (Education): Weighted average marks across sections.
- Average Spend per Cover (Café): Average money spent by one guest.
- Average Wait Time (Hospital): Minutes a patient waits to see the doctor.
- Bed Occupancy Rate % (Hospital): Share of beds in use.
- Booking Cancellation Rate % (Hotels): Share of bookings cancelled.
- Call Drop Rate % (Telecom): Share of calls that dropped.
- Capacity Utilisation % (Manufacturing): Share of possible output actually produced.
- Capital Adequacy Ratio % (Banking): Capital kept as a cushion against risky loans.
- CASA Ratio % (Banking): Share of cheap current and savings deposits.
- Claim Frequency % (Insurance): Share of policies that made a claim.
- Claim Settlement Ratio % (Insurance): Share of claims the insurer paid.
- Combined Ratio % (Insurance): Claims plus expenses compared with premium.
- Complaints per 1,000 Subscribers (Telecom): Customer complaints for every 1,000 subscribers.
- Conversion Rate % (Retail): Share of visitors who buy.
- Cost per New Account (Banking): Marketing money spent for each new account.
- Cost per Occupied Room (CPOR) (Hotels): Running cost for each room sold.
- Cost per Patient Day (Hospital): Running cost for one patient for one day.
- Cost per Shipment (Logistics): Average transport cost of one shipment.
- Cost per Student (Education): Yearly running cost for each student.
- Cost-to-Income Ratio % (Banking): Running cost for every unit of income.
- Course Completion Rate % (Education): Share of learners who finished the course.
- Customer Acquisition Cost (CAC) (SaaS): Sales and marketing cost to win one customer.
- Customer Acquisition Cost (CAC) (Telecom): Sales and marketing cost to win one subscriber.
- Customer Churn Rate % (SaaS): Share of customers who cancelled this month.
- Customer Lifetime Value (LTV) (SaaS): Gross profit one customer brings over their life.
- Data Usage per User (Telecom): Average monthly GB used per subscriber.
- DAU / MAU Stickiness % (SaaS): Share of monthly users who use the app every day.
- Delivery Order Share % (Café): Share of orders that came via delivery apps.
- Direct Booking Share % (Hotels): Share of bookings made on the hotel's own site or desk.
- Dish Contribution Margin (Café): Profit one menu item brings after its food cost.
- Dock-to-Stock Time (Logistics): Average hours from truck arrival to stock on shelf.
- Dropout Rate % (Education): Share of students who left before finishing.
- Enquiry-to-Admission Rate % (Education): Share of enquiries that became admissions.
- Expense Ratio % (Insurance): Share of premium spent on running the business.
- Fee Collection Rate % (Education): Share of billed fees actually collected.
- First Pass Yield % (Manufacturing): Share of units made right the first time.
- Fleet Utilisation % (Logistics): Share of truck-days the fleet was actually working.
- Food Cost % (Café): Share of food sales spent on ingredients.
- Food Waste % (Café): Share of purchased food thrown away.
- Freight Cost per Km (Logistics): Running cost of the fleet for each kilometre.
- Fuel Efficiency (Km per Litre) (Logistics): Kilometres driven for each litre of diesel.
- Gross Margin % (Retail): Profit share left after product cost.
- Gross NPA % (Banking): Share of loans where the borrower stopped paying.
- Gross Operating Profit per Available Room (GOPPAR) (Hotels): Operating profit for every available room-night.
- Gross Written Premium Growth % (Insurance): How much premium grew from last year.
- Insurance Claim Denial % (Hospital): Share of insurance claims rejected.
- Inventory Turnover (Retail): How many times stock is sold and refilled.
- Labour Cost % (Café): Share of sales paid as staff wages.
- Loan Approval Rate % (Banking): Share of loan applications approved.
- Loan-to-Deposit Ratio % (Banking): How much of the deposits is lent out.
- Loss Ratio % (Insurance): Share of premium paid out as claims.
- LTV : CAC Ratio (SaaS): Customer value compared with the cost to win them.
- Manufacturing Cost per Unit (Manufacturing): Average cost to make one unit.
- Mean Time Between Failures (MTBF) (Manufacturing): Average running hours between two breakdowns.
- Mean Time to Repair (MTTR) (Manufacturing): Average hours to fix a breakdown.
- Minutes of Use (MOU) (Telecom): Average voice minutes per subscriber per month.
- Monthly Churn Rate % (Telecom): Share of subscribers who left this month.
- Monthly Recurring Revenue (MRR) (SaaS): Subscription money that comes in every month.
- Net Interest Margin % (Banking): Interest earned minus interest paid, per rupee of loans and investments.
- Net Revenue Retention % (SaaS): Revenue kept from old customers, including upgrades.
- Net Sales (Retail): Money from sales after discounts and returns.
- Network Availability % (Telecom): Share of time the network was up.
- No-Show Rate % (Hospital): Share of booked patients who did not come.
- Occupancy Rate % (Hotels): Share of available room-nights sold.
- On-Time Delivery % (Logistics): Share of shipments delivered by the promised time.
- Overall Equipment Effectiveness (OEE) (Manufacturing): Availability × Performance × Quality in one number.
- Pass Rate % (Education): Share of students who passed the exam.
- Patient Satisfaction (NPS) (Hospital): Do patients recommend you? Promoters minus detractors.
- Patients per Doctor per Day (Hospital): Average patients one doctor sees in a day.
- Perfect Order Rate % (Logistics): Share of orders delivered complete, on time and undamaged.
- Placement Rate % (Education): Share of eligible students who got jobs.
- Policy Renewal Rate % (Insurance): Share of policies renewed when due.
- Postpaid Mix % (Telecom): Share of subscribers on postpaid plans.
- Prime Cost % (Café): Food plus labour cost as a share of sales.
- Provision Coverage Ratio % (Banking): Share of bad loans already covered by provisions.
- Quote-to-Bind Rate % (Insurance): Share of quotes that became policies.
- Repeat Customer Rate % (Retail): Share of customers who buy again.
- Return on Assets (ROA) % (Banking): Profit earned on everything the bank owns.
- Return Rate % (Retail): Share of orders sent back.
- Revenue per Available Room (RevPAR) (Hotels): Room revenue for every available room-night.
- Revenue per Patient (Hospital): Average billing per patient.
- RevPASH (Café): Revenue per available seat per hour.
- Sales per Sq Ft (Retail): Sales earned by each square foot of floor.
- Schedule Adherence % (Manufacturing): Share of production orders finished on time.
- Scrap Rate % (Manufacturing): Share of produced units thrown away.
- Seat Occupancy % (Café): Share of seats filled across services.
- Sell-Through Rate % (Retail): Share of received stock that got sold.
- Shipment Damage Rate % (Logistics): Share of shipments that arrived damaged.
- Student-Teacher Ratio (Education): Students for each teacher.
- Subscriber Growth % (Telecom): How much the subscriber base grew.
- Table Turnover Rate (Café): How many groups use one table in a service.
- Throughput (Units per Hour) (Manufacturing): Units finished each production hour.
- Total Revenue per Available Room (TRevPAR) (Hotels): All revenue (rooms, food, spa) per available room-night.
- Units per Transaction (Retail): Average items in one bill.
- Unplanned Downtime % (Manufacturing): Share of planned hours lost to breakdowns.
- Uptime % (SaaS): Share of time the service was working.
- Warehouse Space Utilisation % (Logistics): Share of pallet slots in use.
About this data: All card examples use made-up teaching numbers for businesses in Indian and world cities (Mumbai, Pune, Nagpur, Leeds, New York, Dublin, Munich, Sydney and more) in ₹, $, £ and €. No real customer or patient data is used.