Hospital & Clinic KPIs in Excel and Power BI
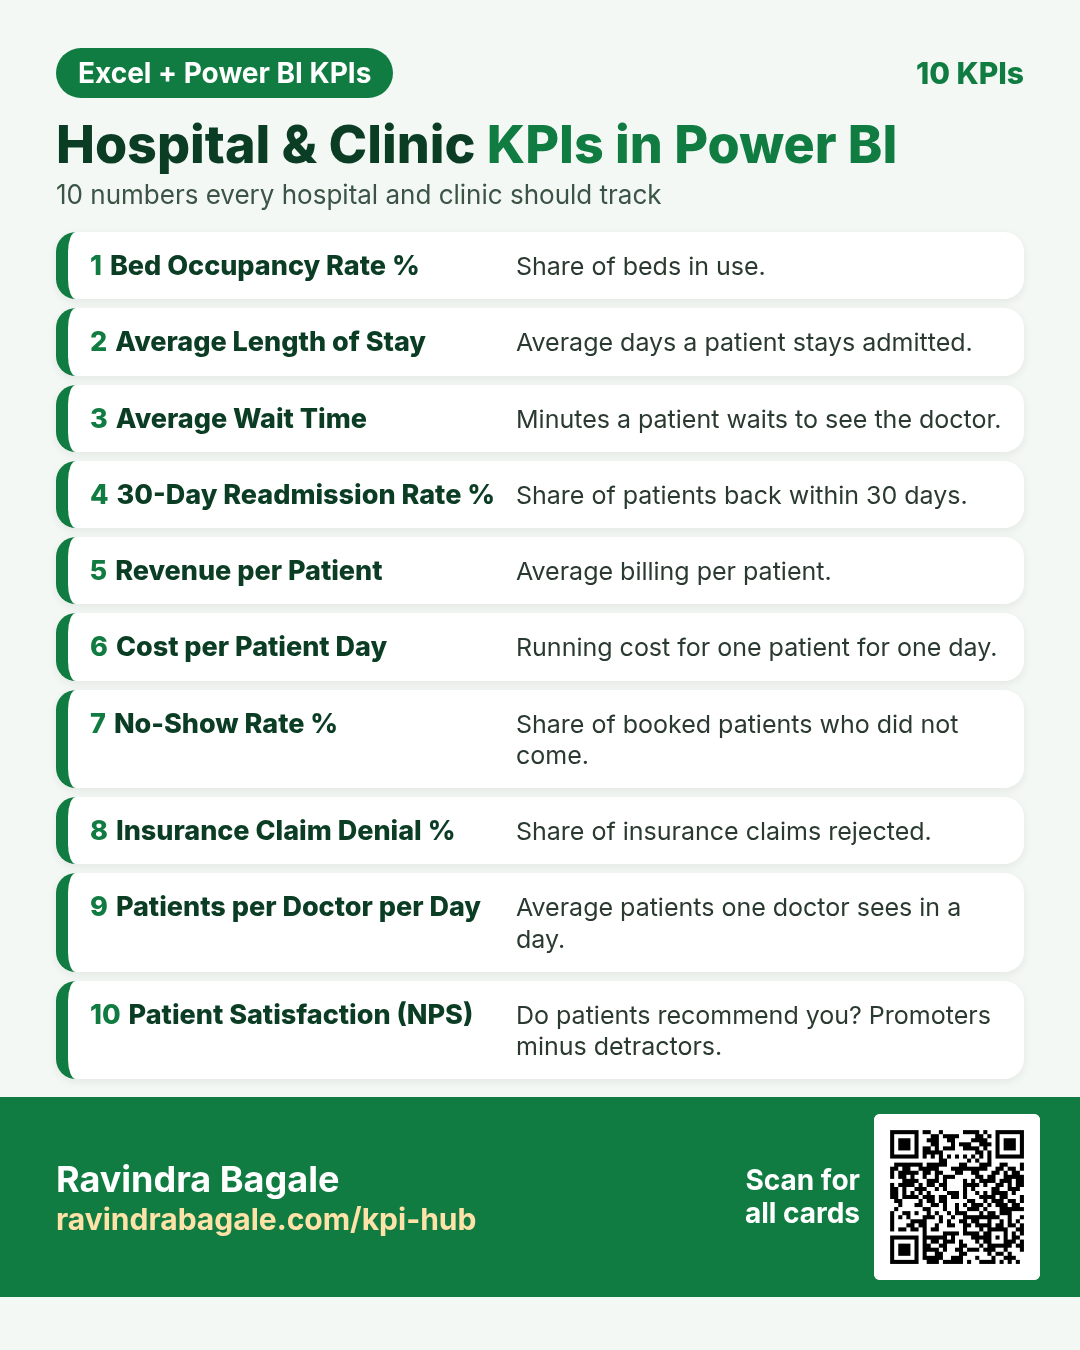
Ten important KPIs for a hospital or clinic. Each card has what it is, why it matters, the DAX measure and a tiny worked example. Every card shows the Excel formula next to the Power BI DAX measure. For Excel, put the card’s example table in cell A1 (labels in column A, numbers in column B).
About this data: All examples are made-up teaching numbers for hospitals and clinics in Nagpur, Birmingham, Kolkata, Houston, Pune, Munich, Glasgow, Delhi, Lucknow and Sydney, in ₹ and €. No real patient data is used. Table names (Stays, Visits, Bills, Costs, Appts, Claims, Survey, Ward) are sample names.
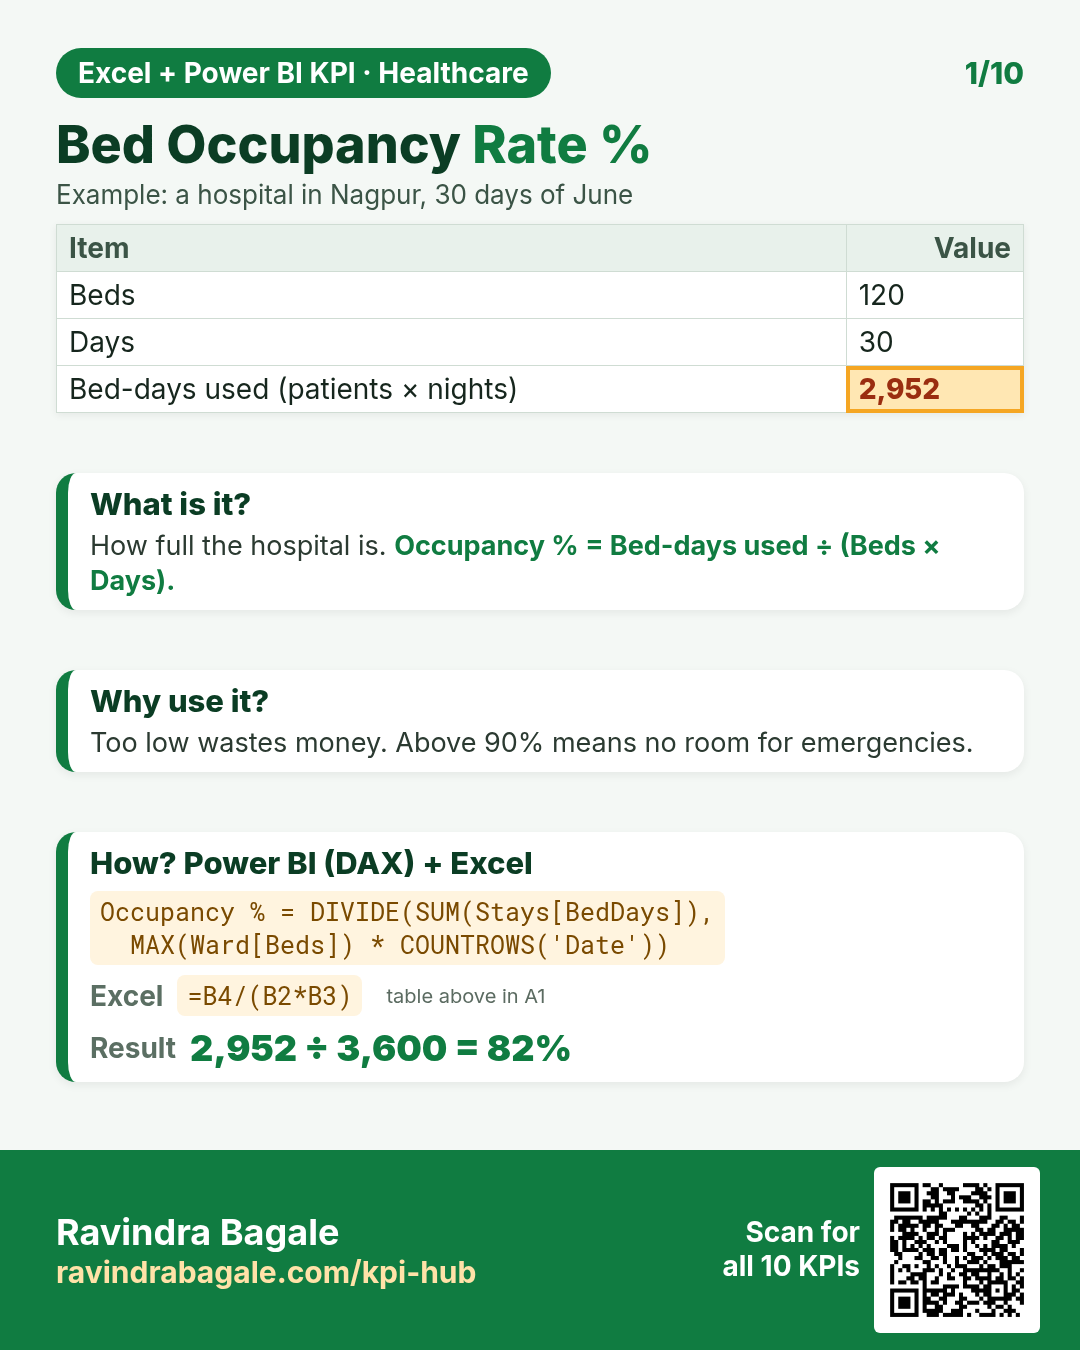
DAX: Occupancy % = DIVIDE(SUM(Stays[BedDays]), MAX(Ward[Beds]) * COUNTROWS('Date'))Excel: =B4/(B2*B3)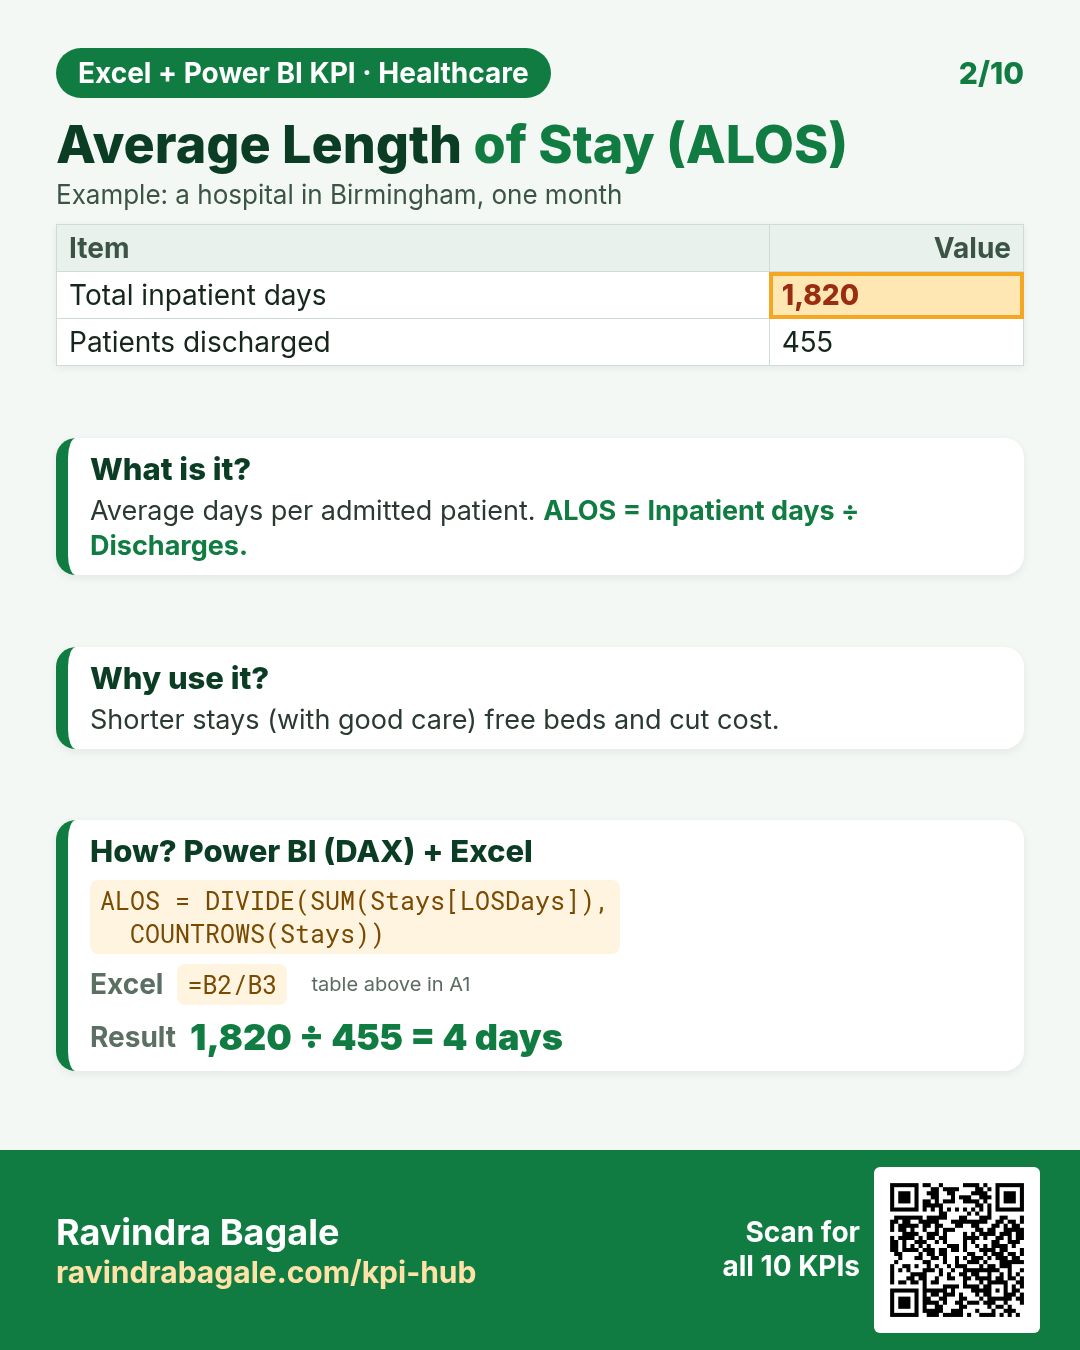
DAX: ALOS = DIVIDE(SUM(Stays[LOSDays]), COUNTROWS(Stays))Excel: =B2/B3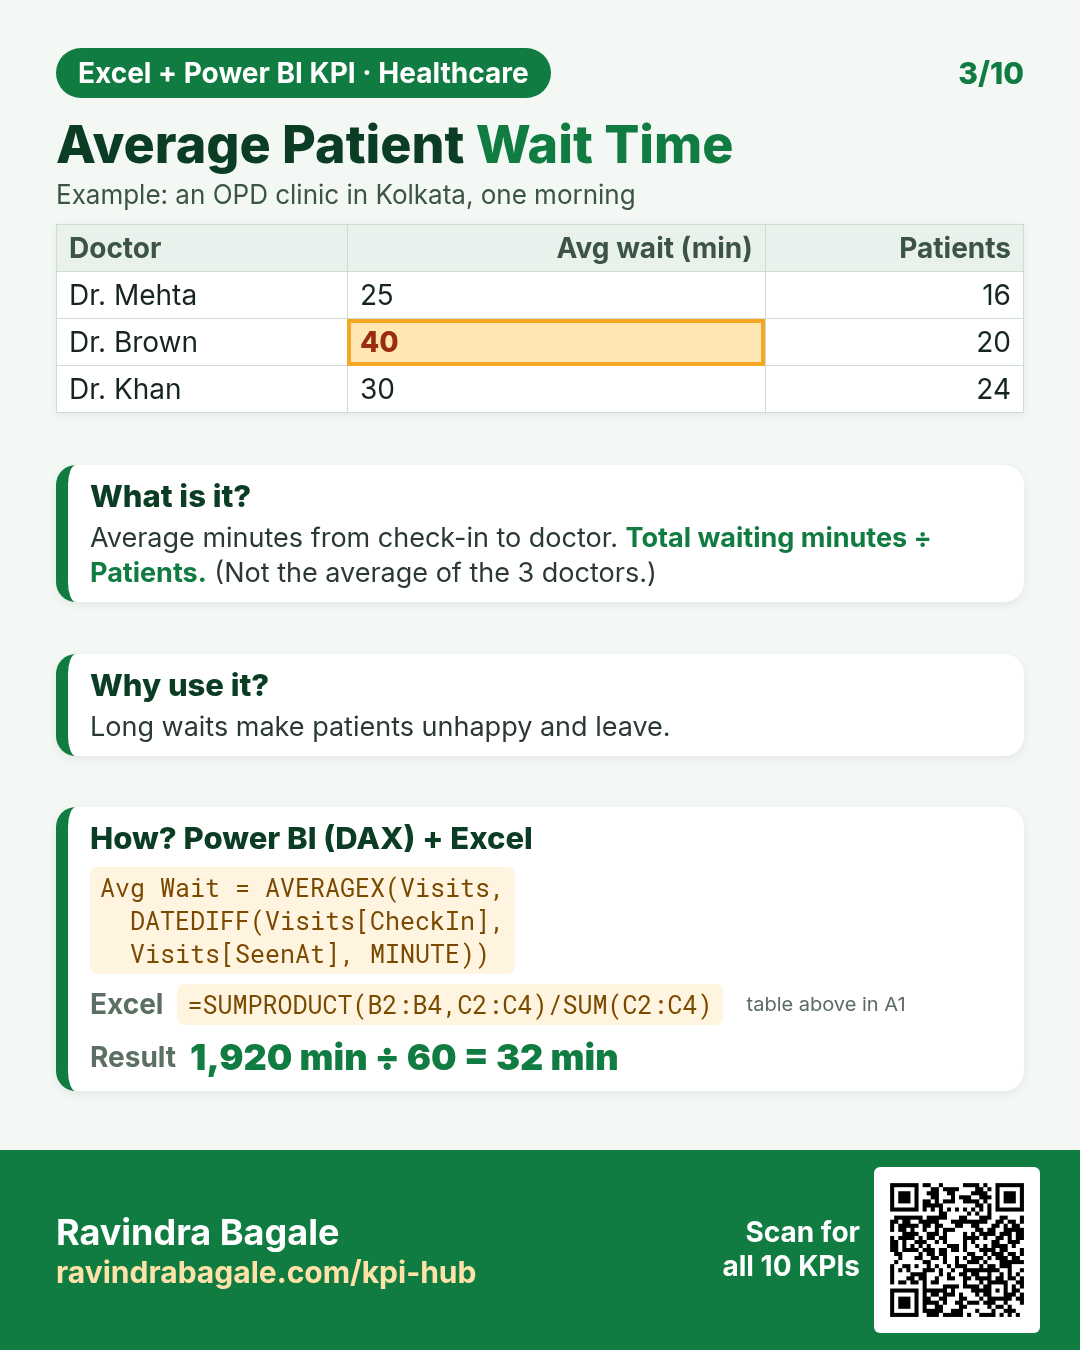
DAX: Avg Wait = AVERAGEX(Visits, DATEDIFF(Visits[CheckIn], Visits[SeenAt], MINUTE))Excel: =SUMPRODUCT(B2:B4,C2:C4)/SUM(C2:C4)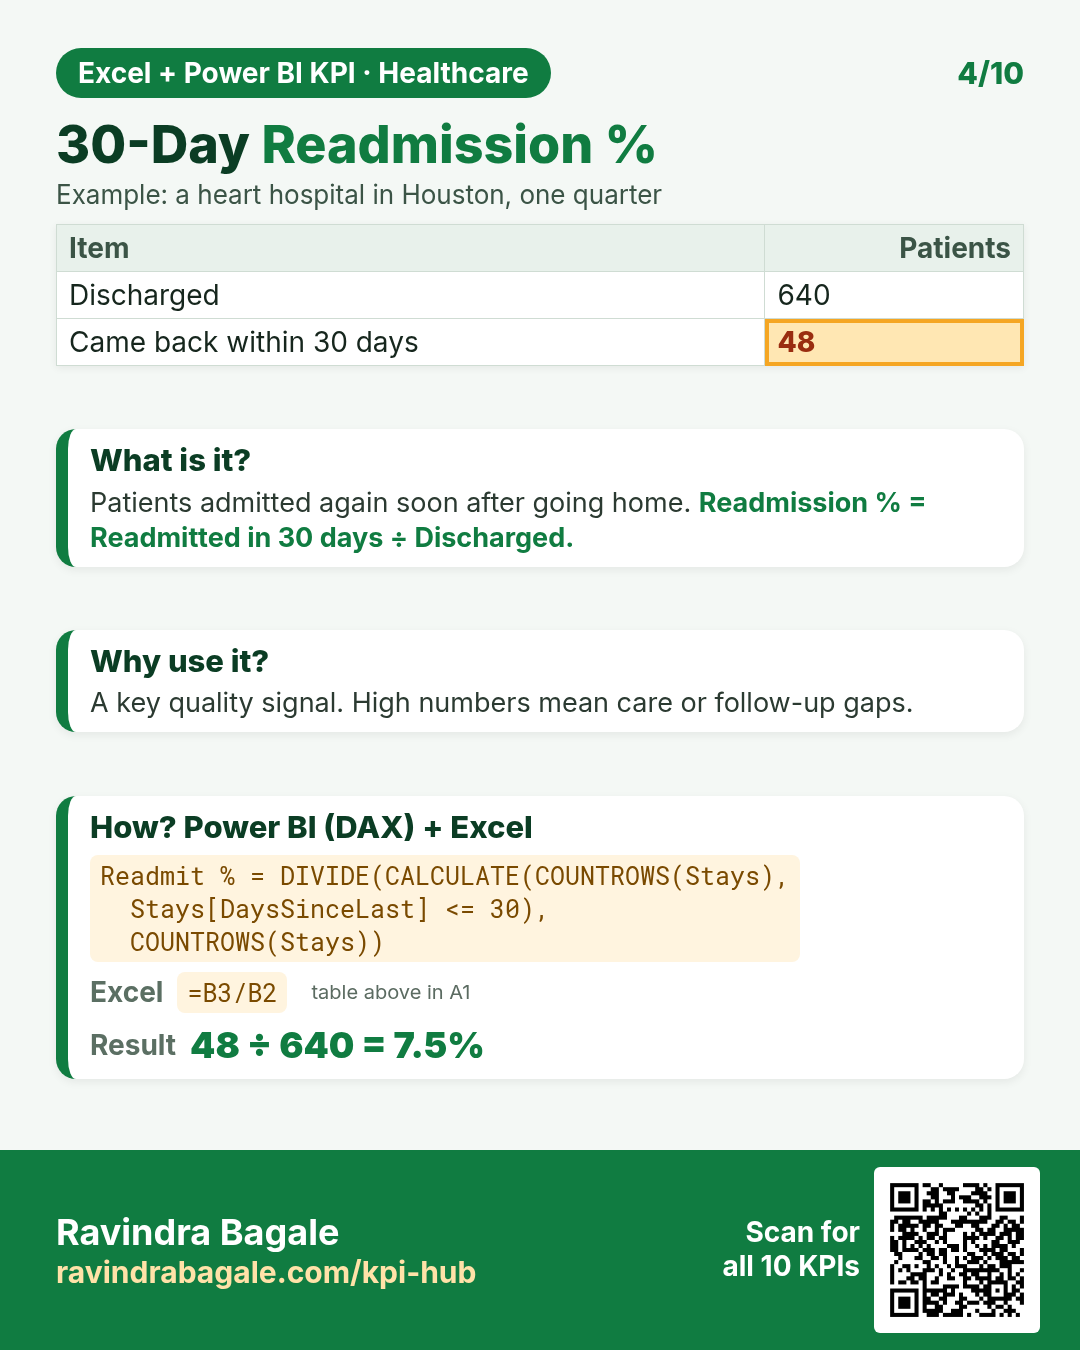
DAX: Readmit % = DIVIDE(CALCULATE(COUNTROWS(Stays), Stays[DaysSinceLast] <= 30), COUNTROWS(Stays))Excel: =B3/B2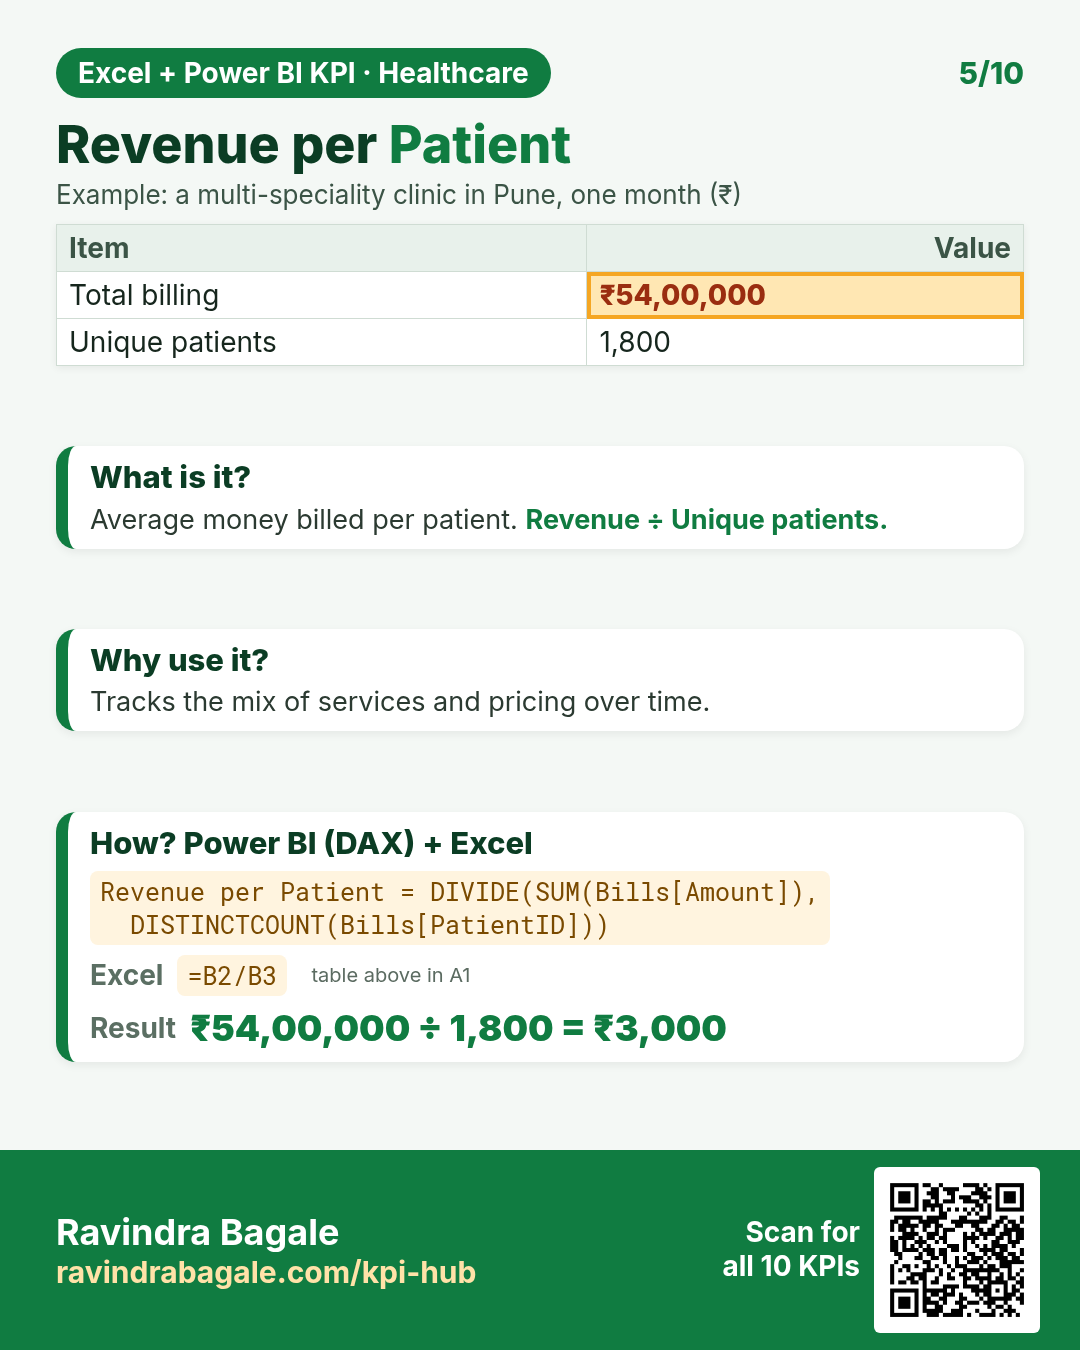
DAX: Revenue per Patient = DIVIDE(SUM(Bills[Amount]), DISTINCTCOUNT(Bills[PatientID]))Excel: =B2/B3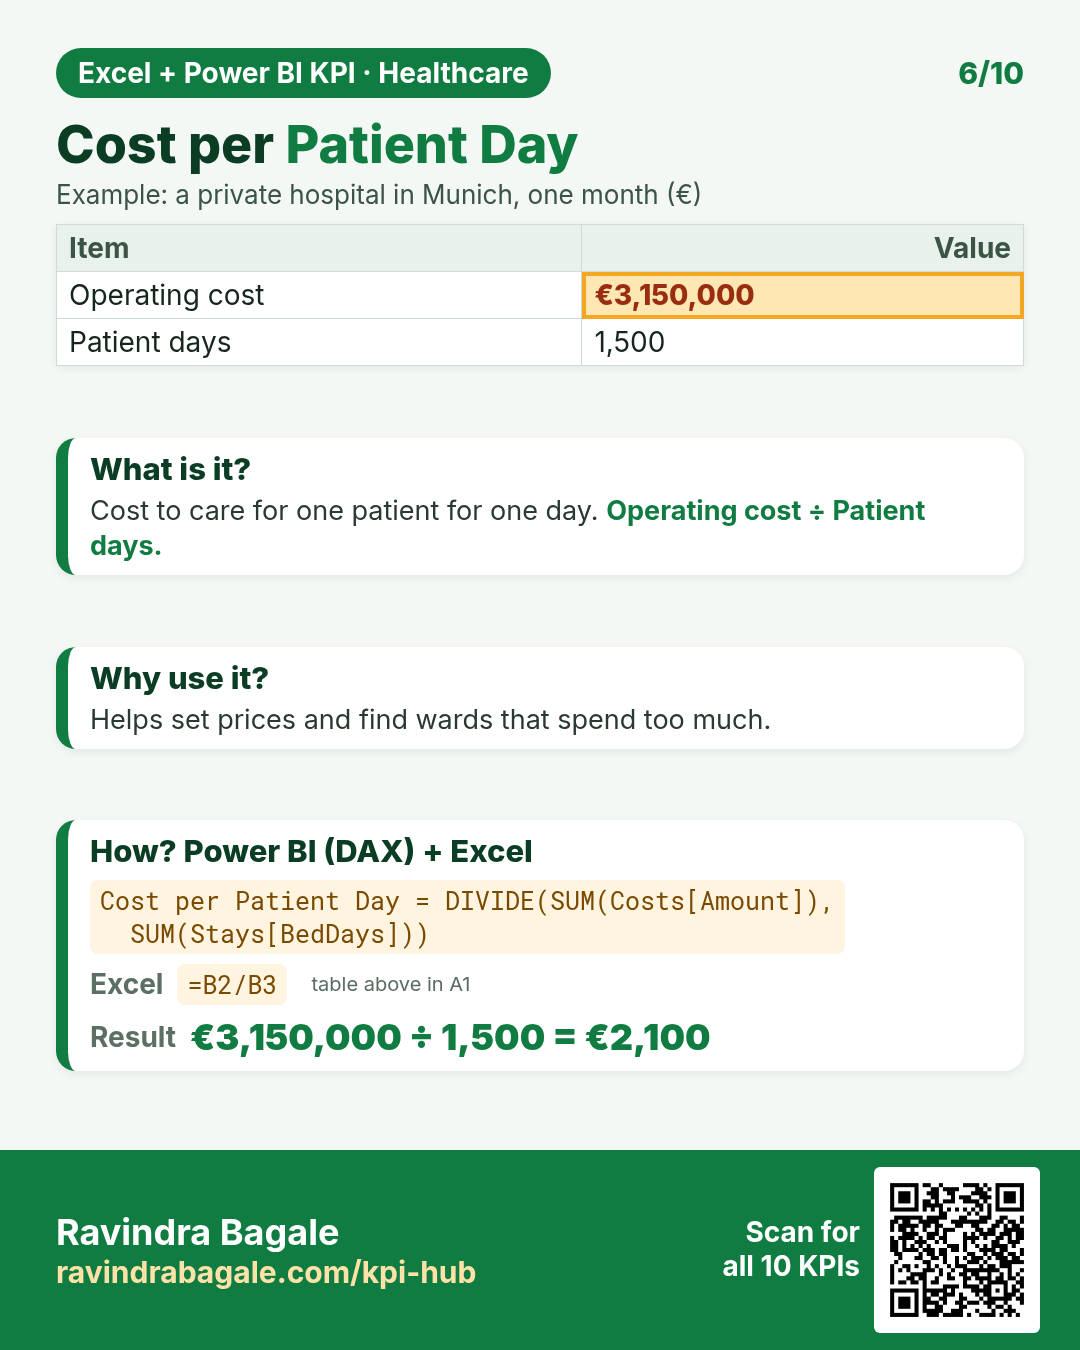
DAX: Cost per Patient Day = DIVIDE(SUM(Costs[Amount]), SUM(Stays[BedDays]))Excel: =B2/B3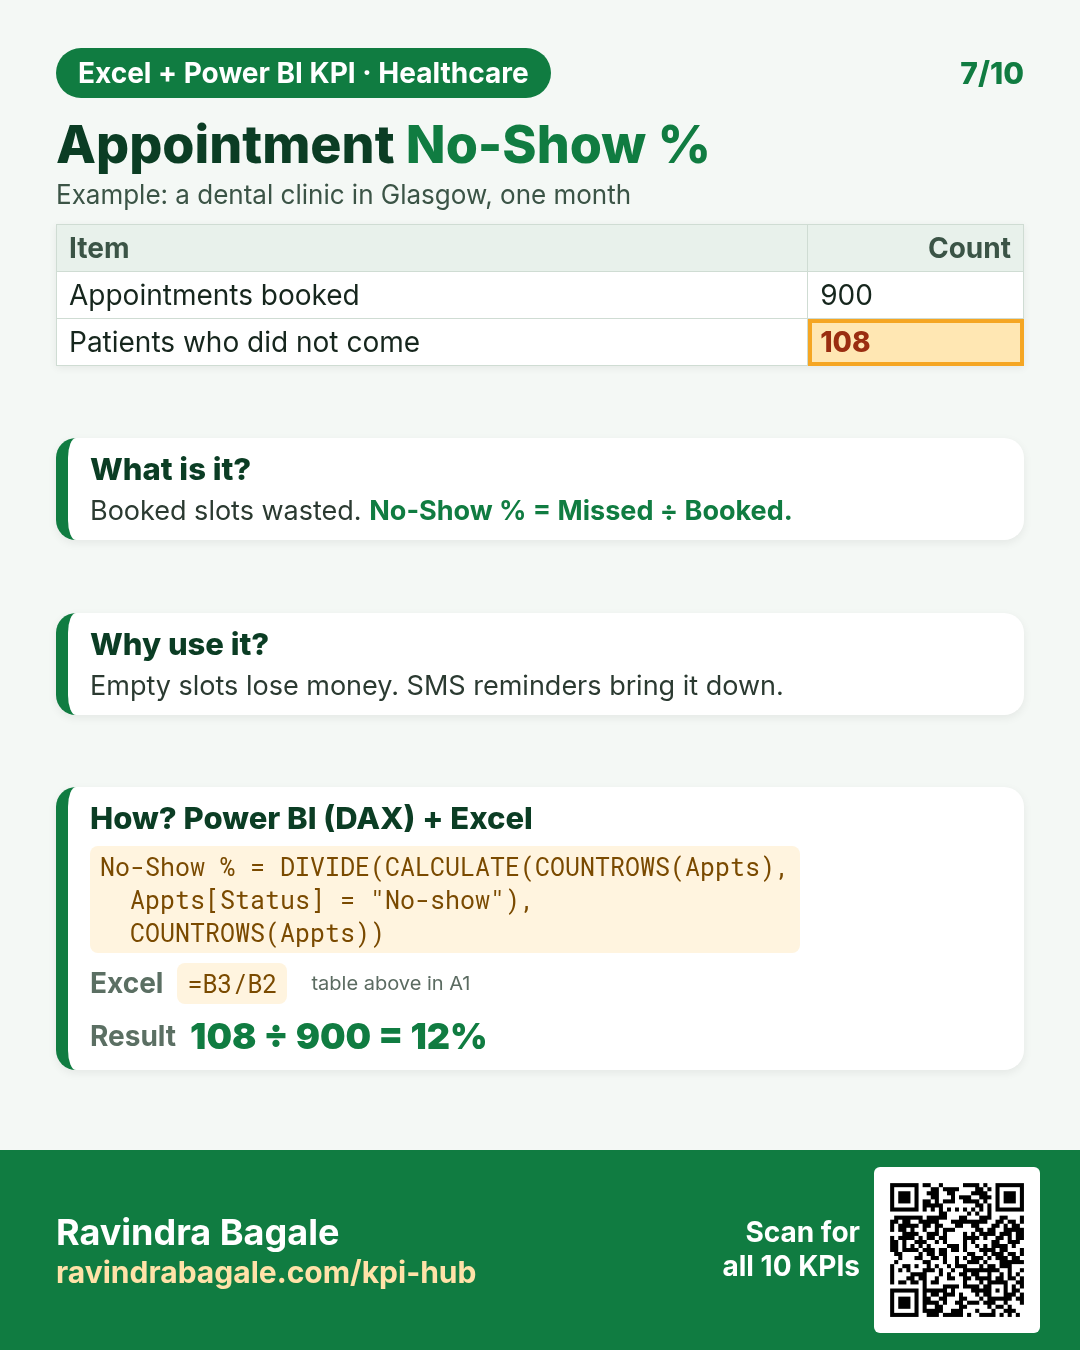
DAX: No-Show % = DIVIDE(CALCULATE(COUNTROWS(Appts), Appts[Status] = "No-show"), COUNTROWS(Appts))Excel: =B3/B2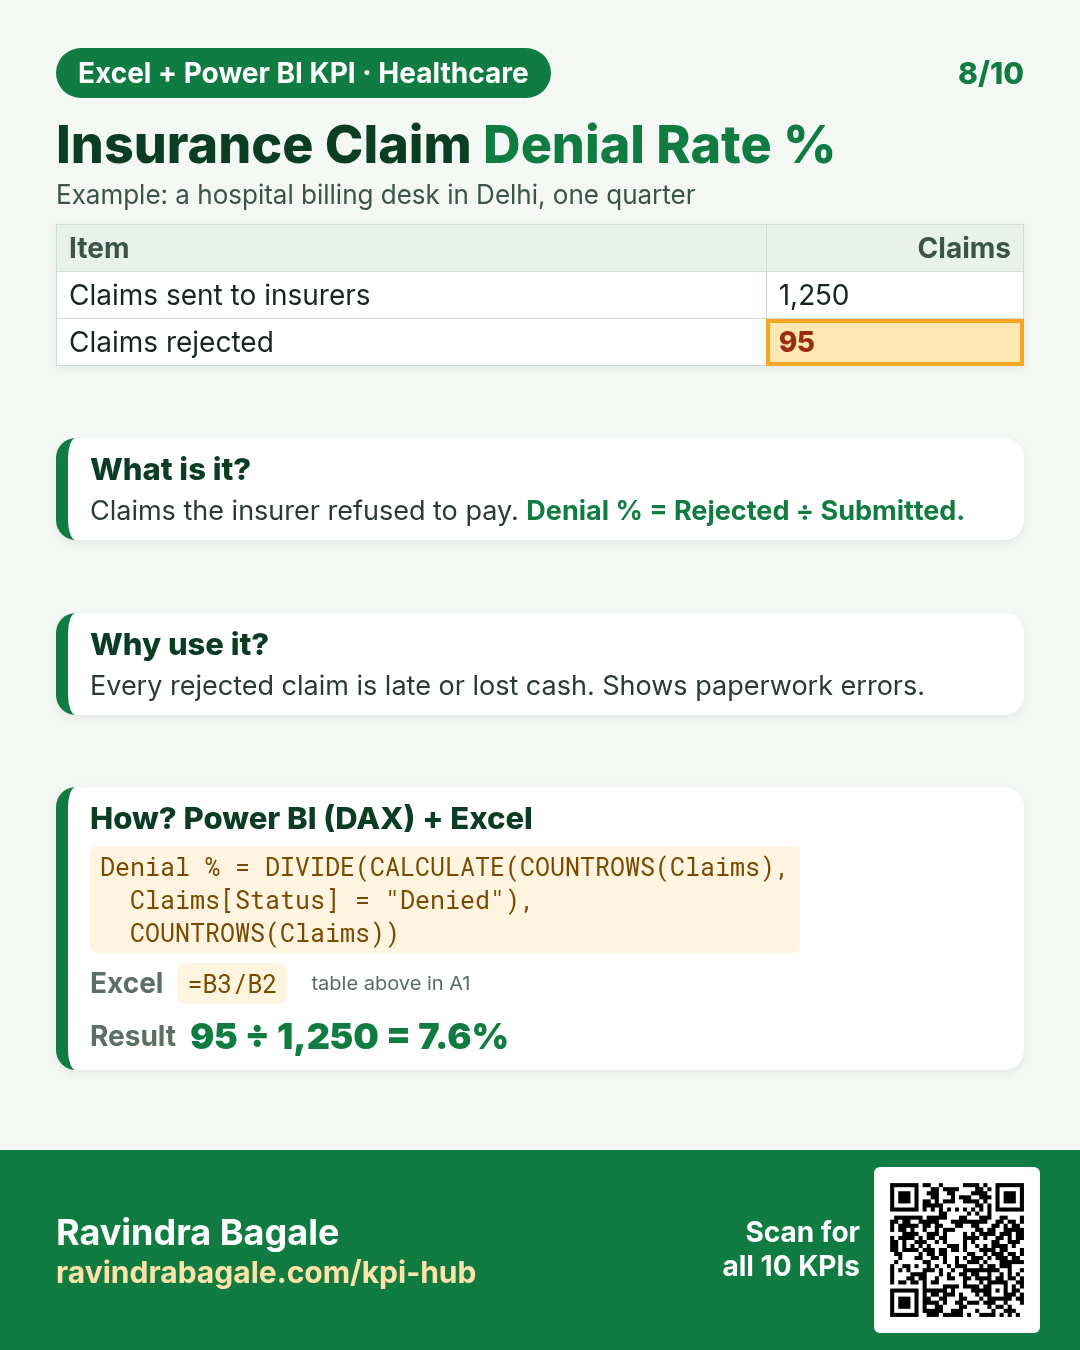
DAX: Denial % = DIVIDE(CALCULATE(COUNTROWS(Claims), Claims[Status] = "Denied"), COUNTROWS(Claims))Excel: =B3/B2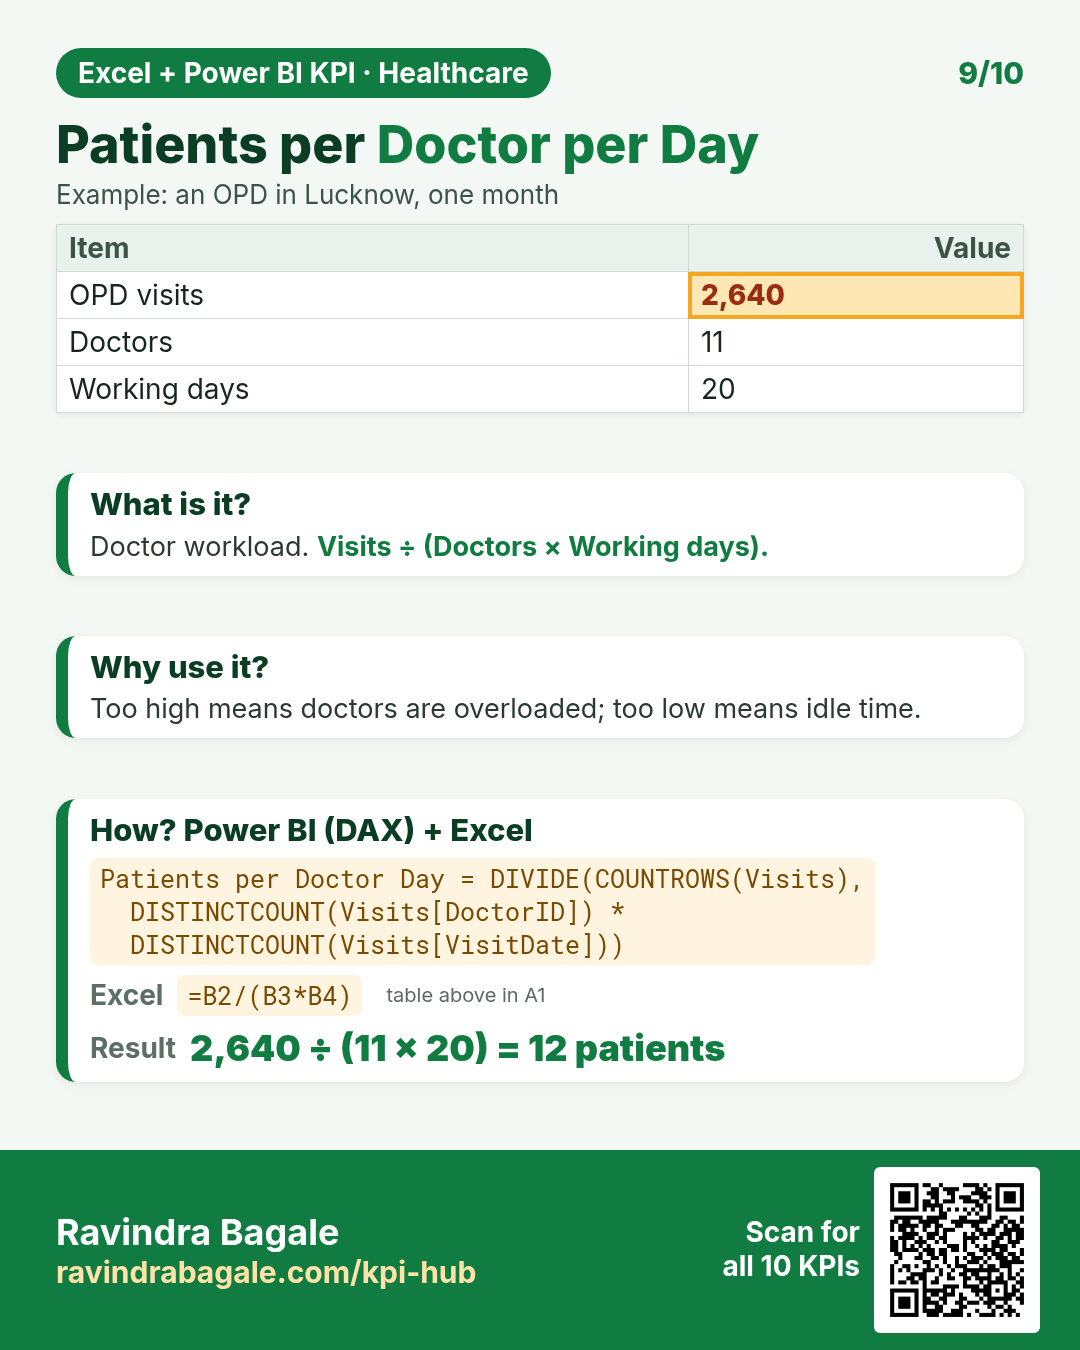
DAX: Patients per Doctor Day = DIVIDE(COUNTROWS(Visits), DISTINCTCOUNT(Visits[DoctorID]) * DISTINCTCOUNT(Visits[VisitDate]))Excel: =B2/(B3*B4)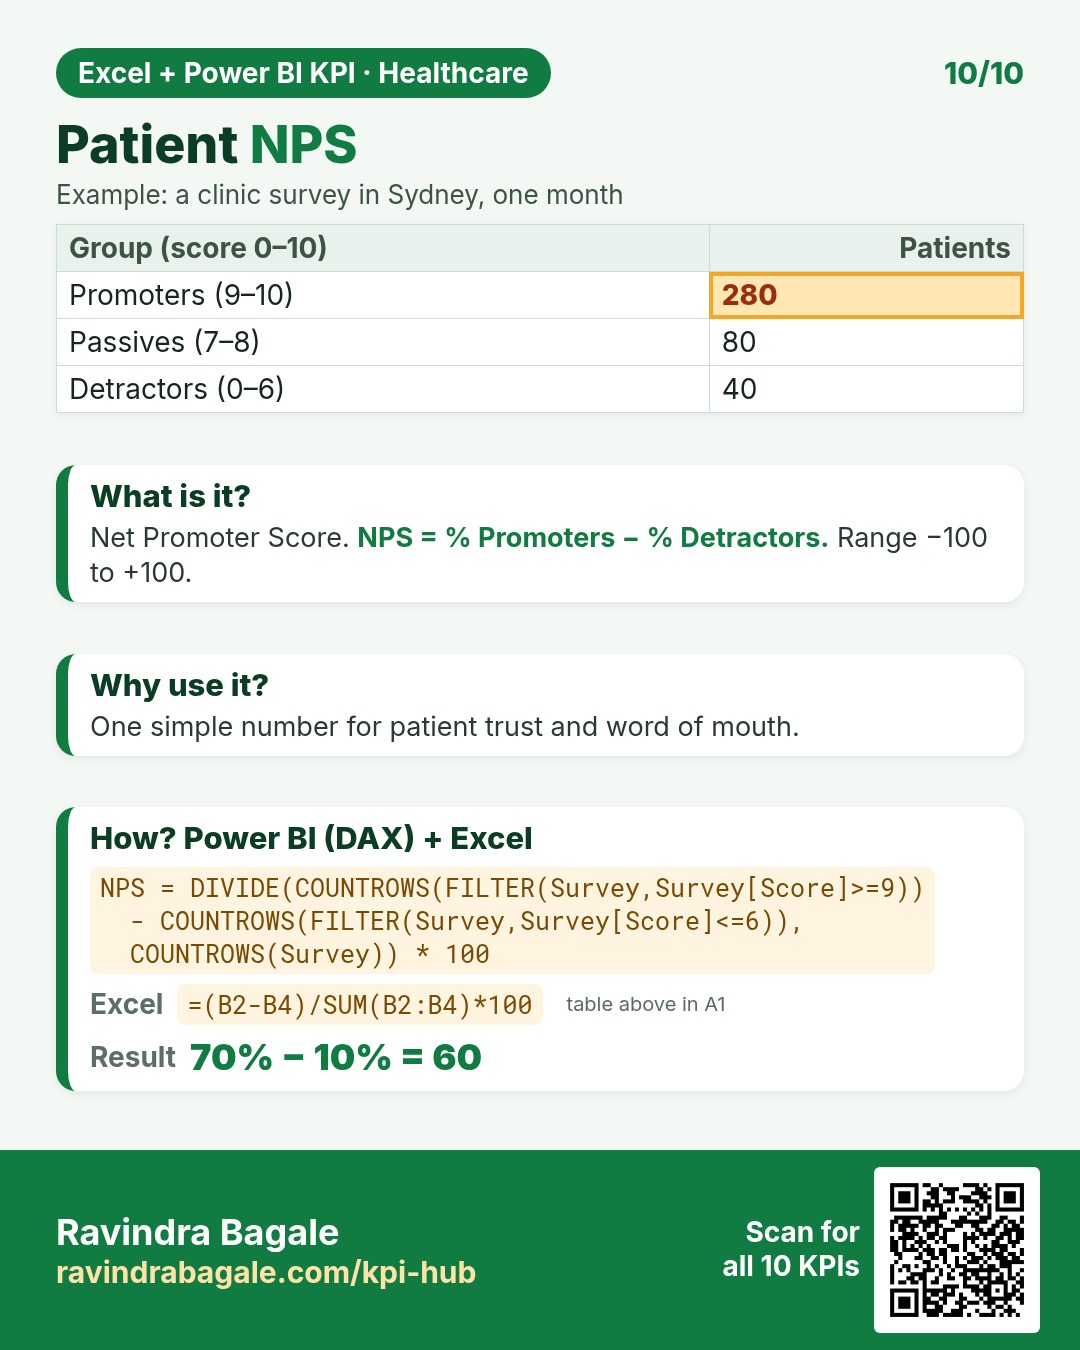
DAX: NPS = DIVIDE(COUNTROWS(FILTER(Survey,Survey[Score]>=9)) - COUNTROWS(FILTER(Survey,Survey[Score]<=6)), COUNTROWS(Survey)) * 100Excel: =(B2-B4)/SUM(B2:B4)*100Quick quiz
1. 50 beds, 10 days, 400 bed-days used. Occupancy % is…
2. 900 inpatient days, 300 discharges. ALOS is…
3. 200 survey replies: 120 promoters, 30 detractors. NPS is…
4. Which DAX function avoids a divide-by-zero error?