Logistics KPIs in Excel and Power BI
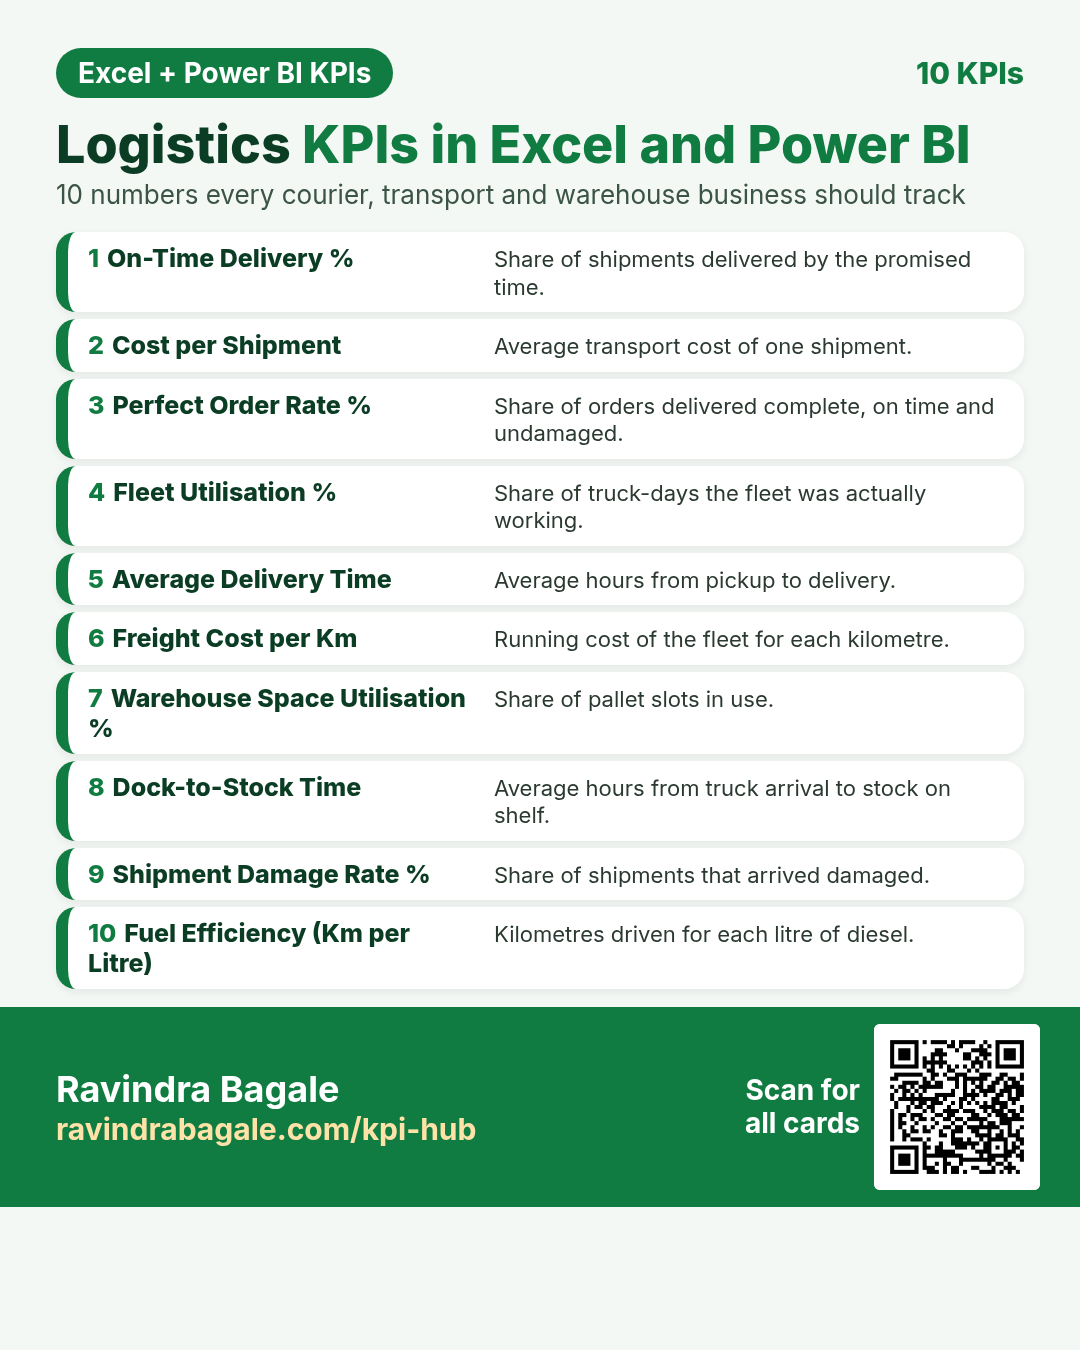
Ten important KPIs for courier, transport and warehouse business. Each card has what it is, why it matters, the Excel formula, the DAX measure and a tiny worked example. Every card shows the Excel formula next to the Power BI DAX measure. For Excel, put the card’s example table in cell A1 (labels in column A, numbers in column B).
About this data: All examples are made-up teaching numbers for logistics firms in Mumbai, Rotterdam, Chicago, Delhi, Birmingham, Chennai, Hamburg, Atlanta, Kolkata and Leeds, in ₹, €, $ and £. Table names (Shipments, Orders, Costs, Trips, Fleet, Bins, Receipts, Fuel) are sample names.
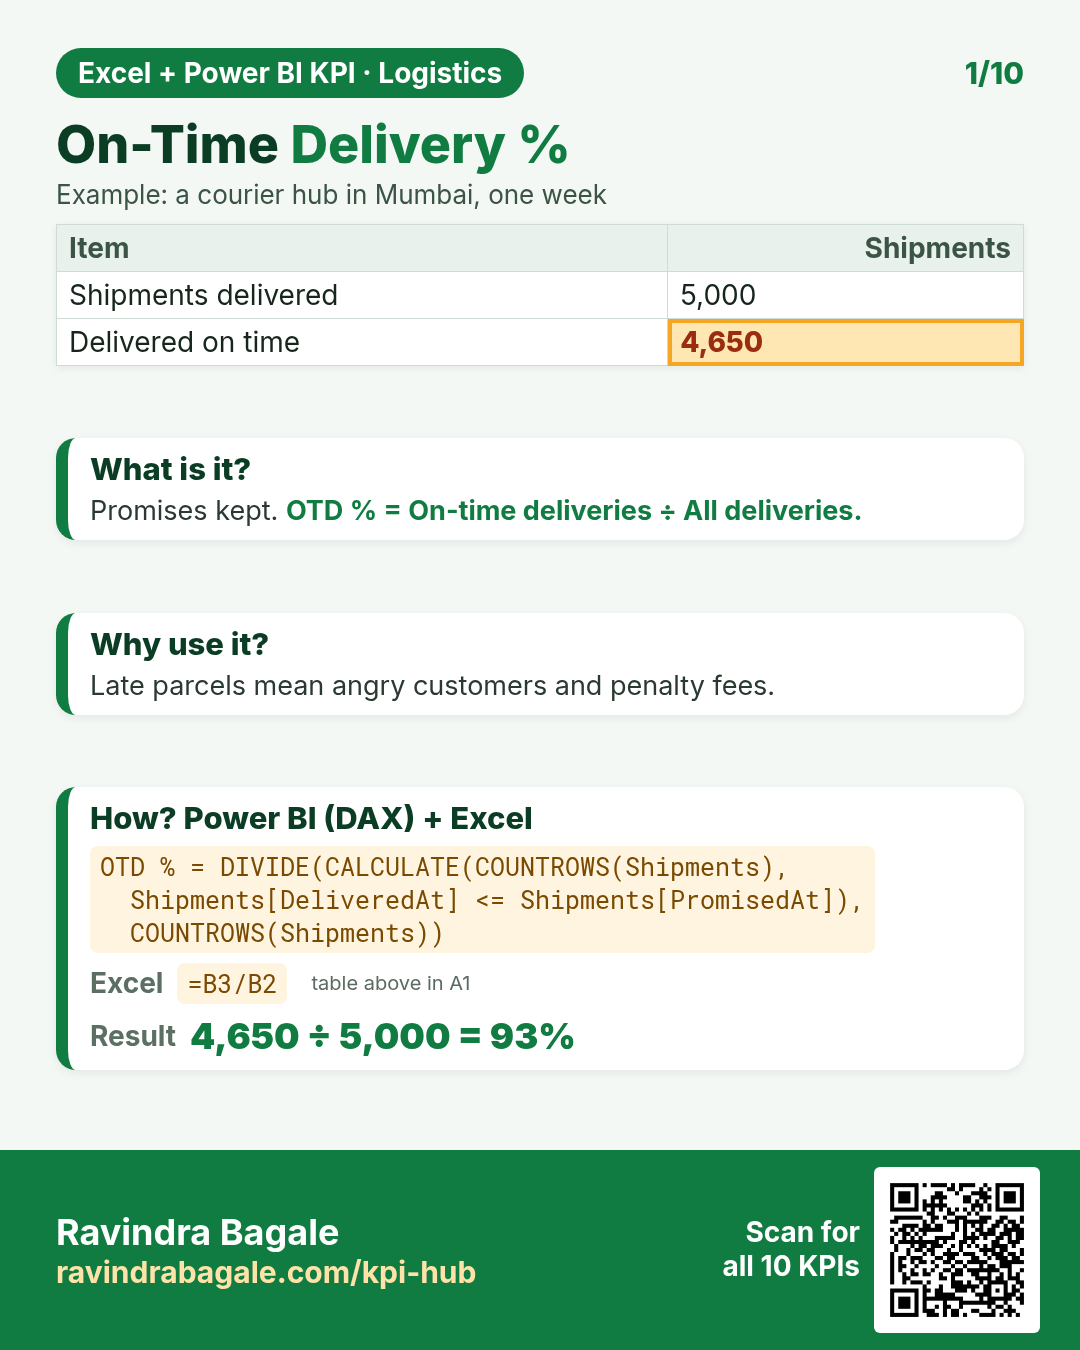
DAX: OTD % = DIVIDE(CALCULATE(COUNTROWS(Shipments), Shipments[DeliveredAt] <= Shipments[PromisedAt]), COUNTROWS(Shipments))Excel: =B3/B2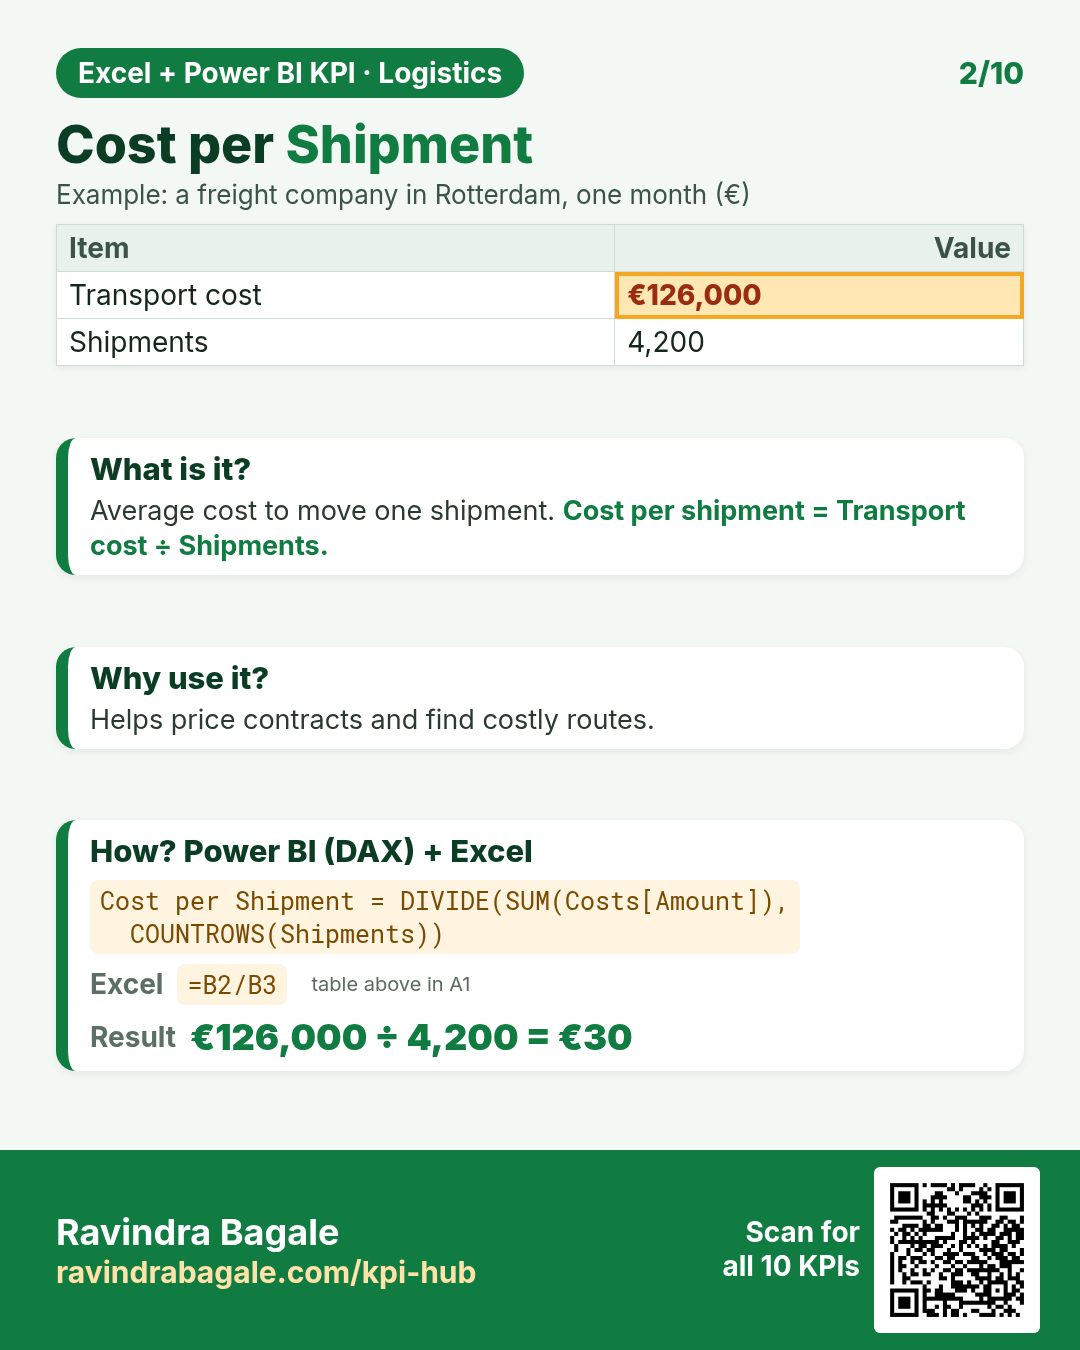
DAX: Cost per Shipment = DIVIDE(SUM(Costs[Amount]), COUNTROWS(Shipments))Excel: =B2/B3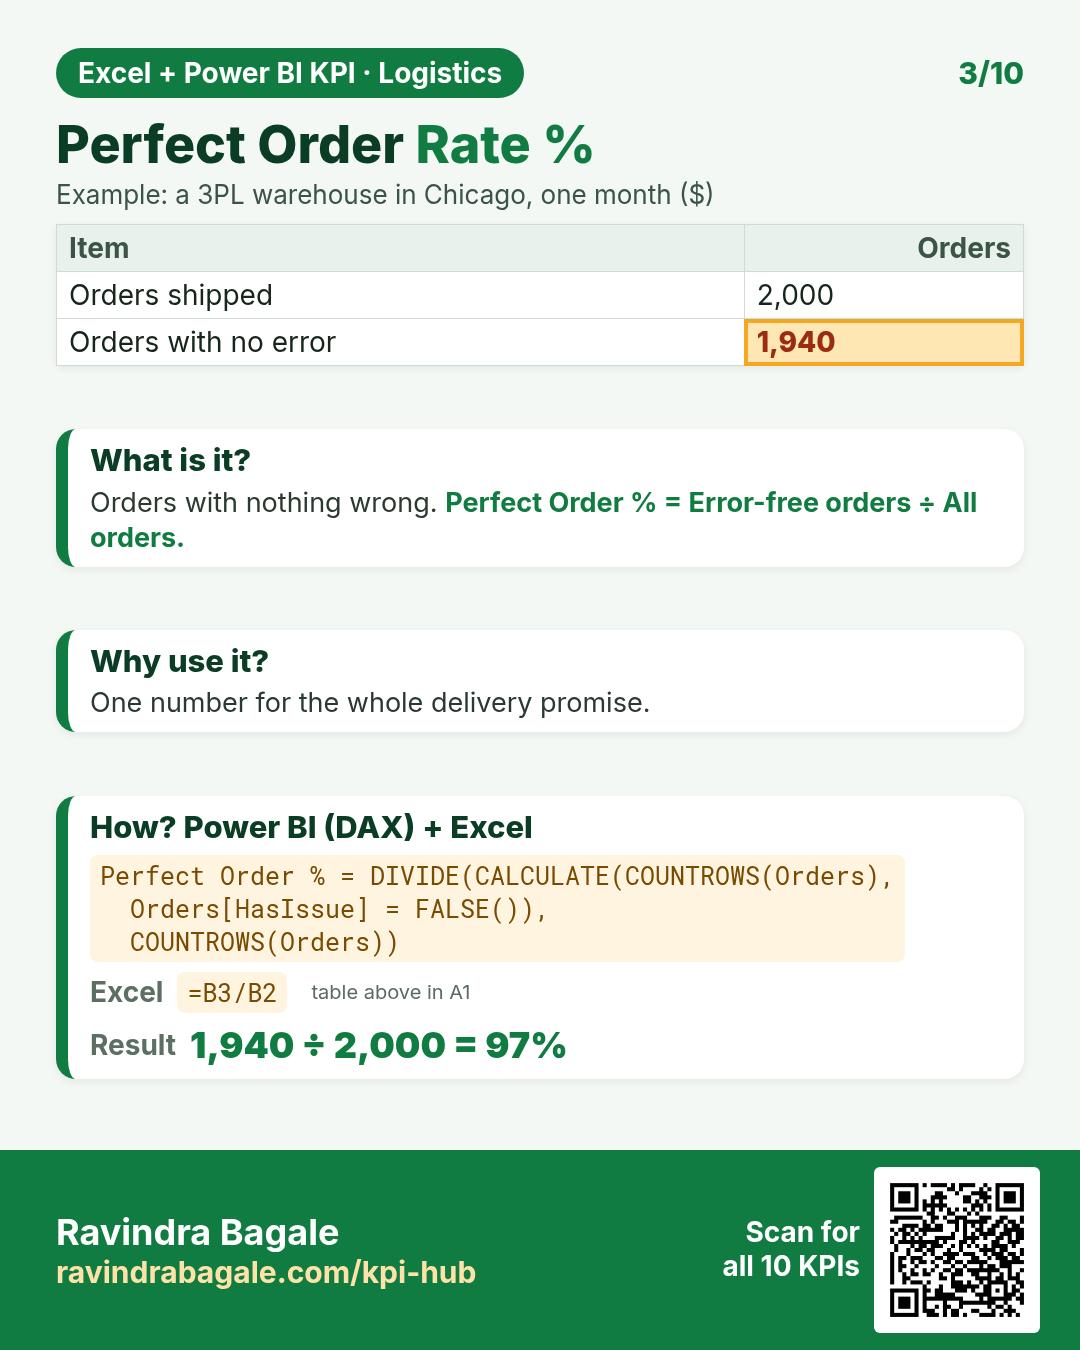
DAX: Perfect Order % = DIVIDE(CALCULATE(COUNTROWS(Orders), Orders[HasIssue] = FALSE()), COUNTROWS(Orders))Excel: =B3/B2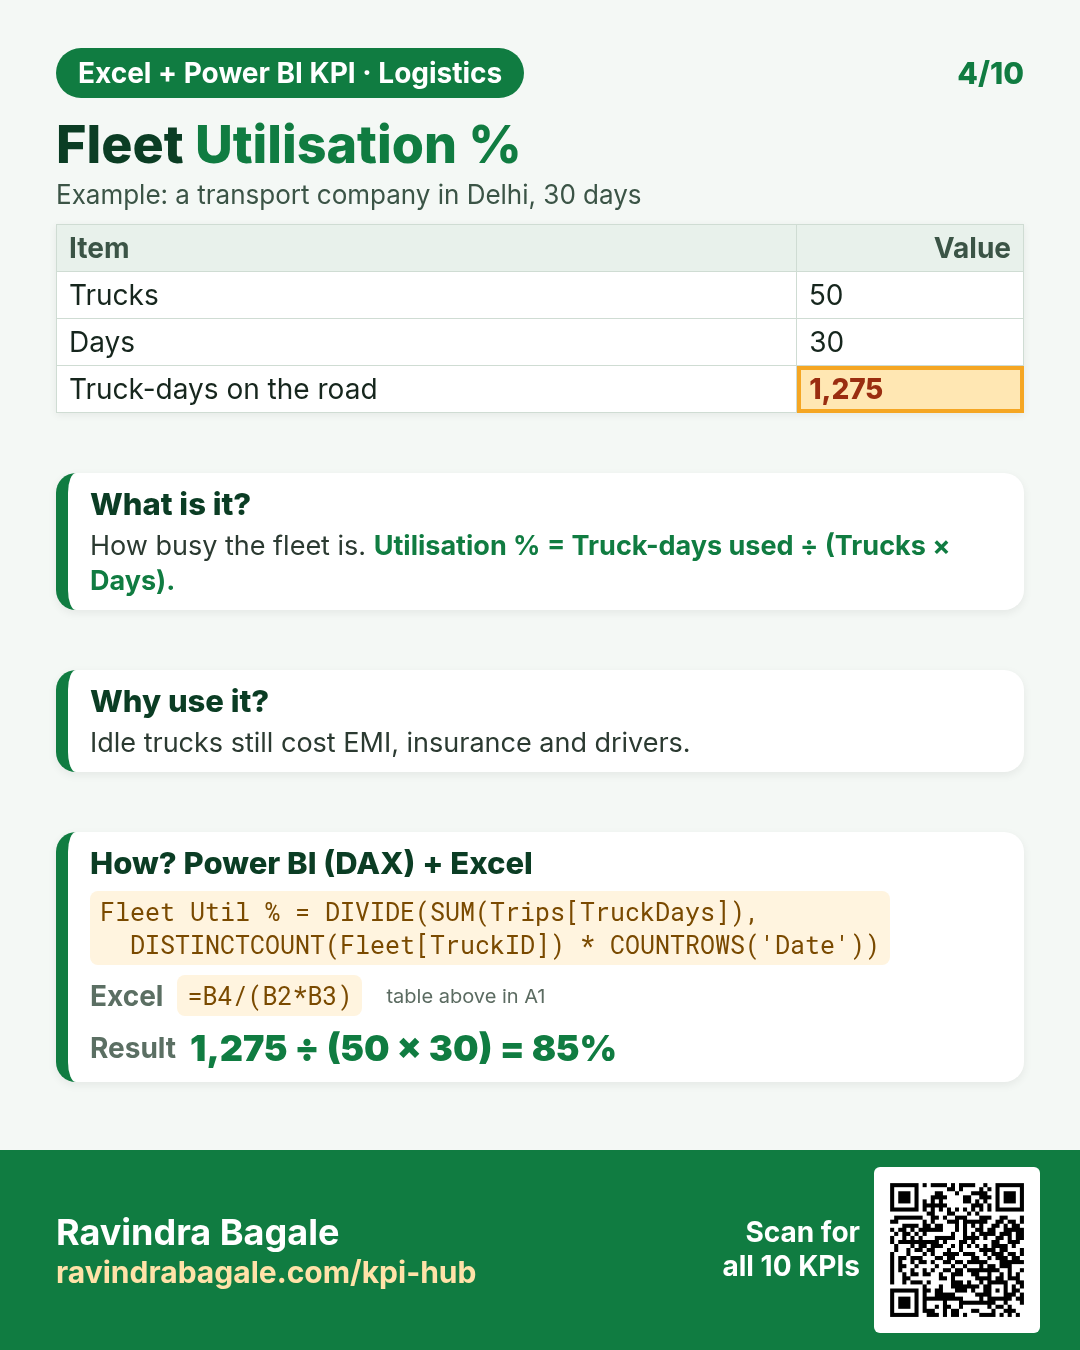
DAX: Fleet Util % = DIVIDE(SUM(Trips[TruckDays]), DISTINCTCOUNT(Fleet[TruckID]) * COUNTROWS('Date'))Excel: =B4/(B2*B3)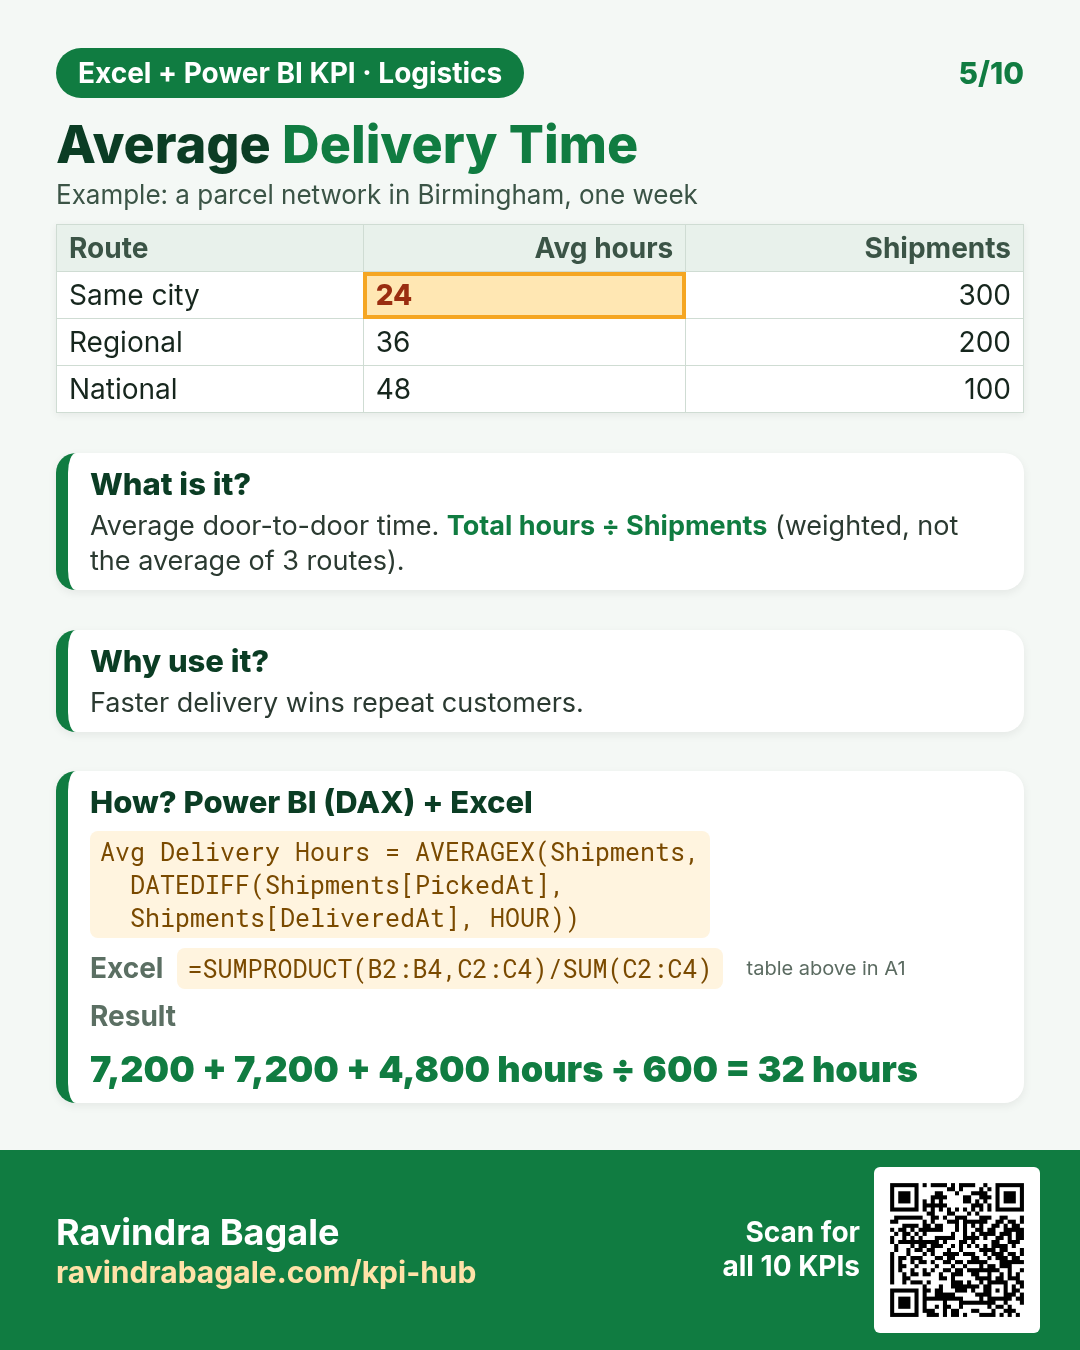
DAX: Avg Delivery Hours = AVERAGEX(Shipments, DATEDIFF(Shipments[PickedAt], Shipments[DeliveredAt], HOUR))Excel: =SUMPRODUCT(B2:B4,C2:C4)/SUM(C2:C4)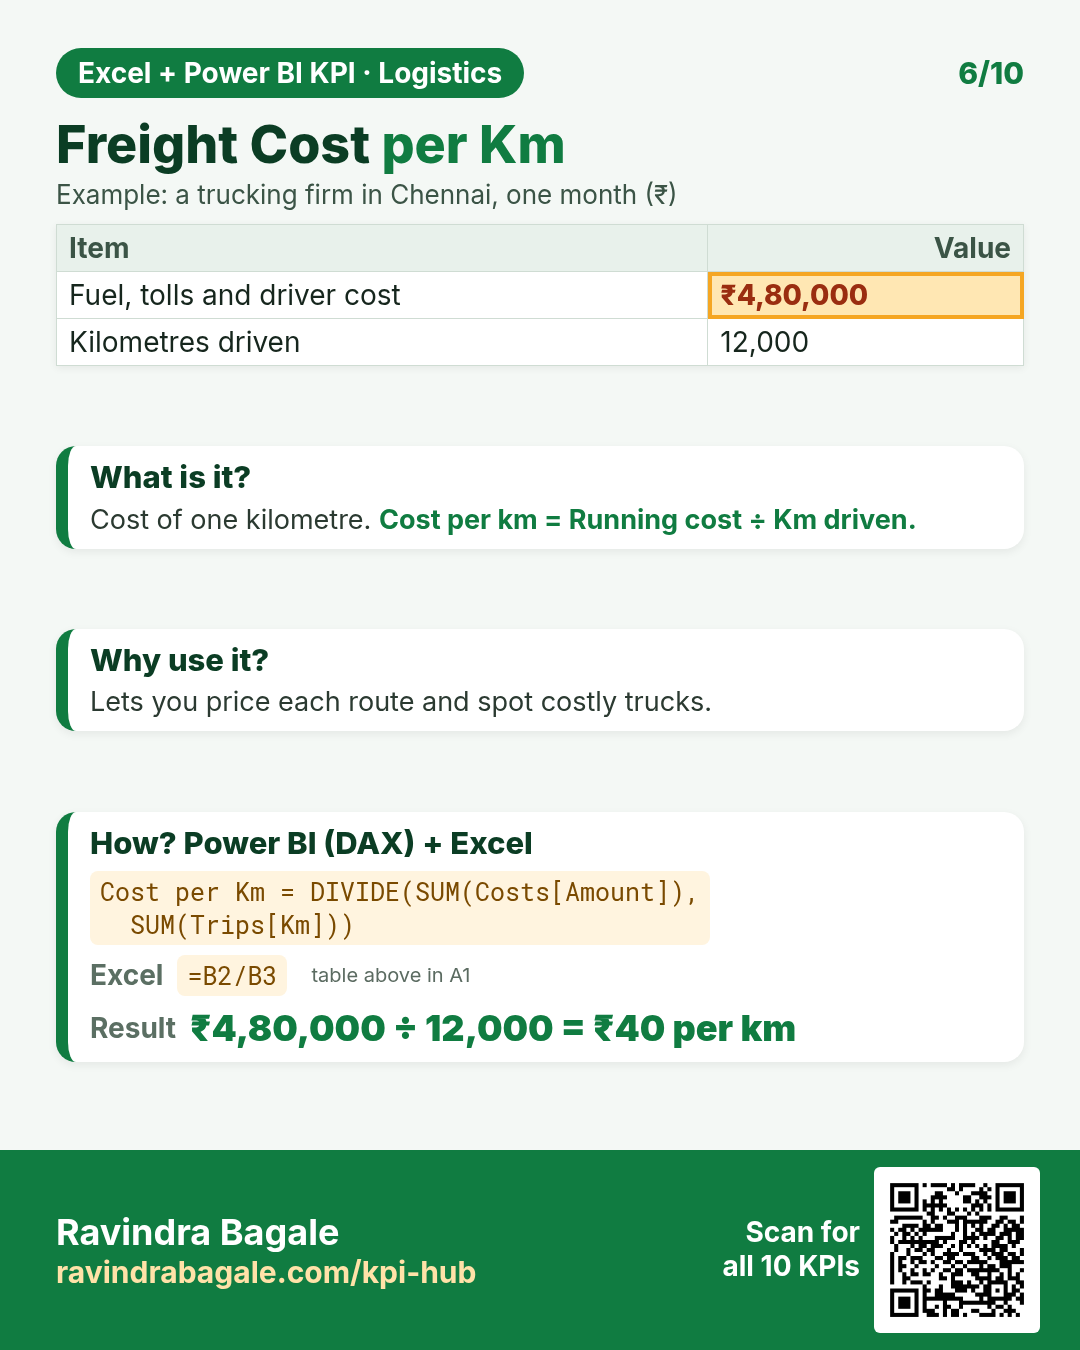
DAX: Cost per Km = DIVIDE(SUM(Costs[Amount]), SUM(Trips[Km]))Excel: =B2/B3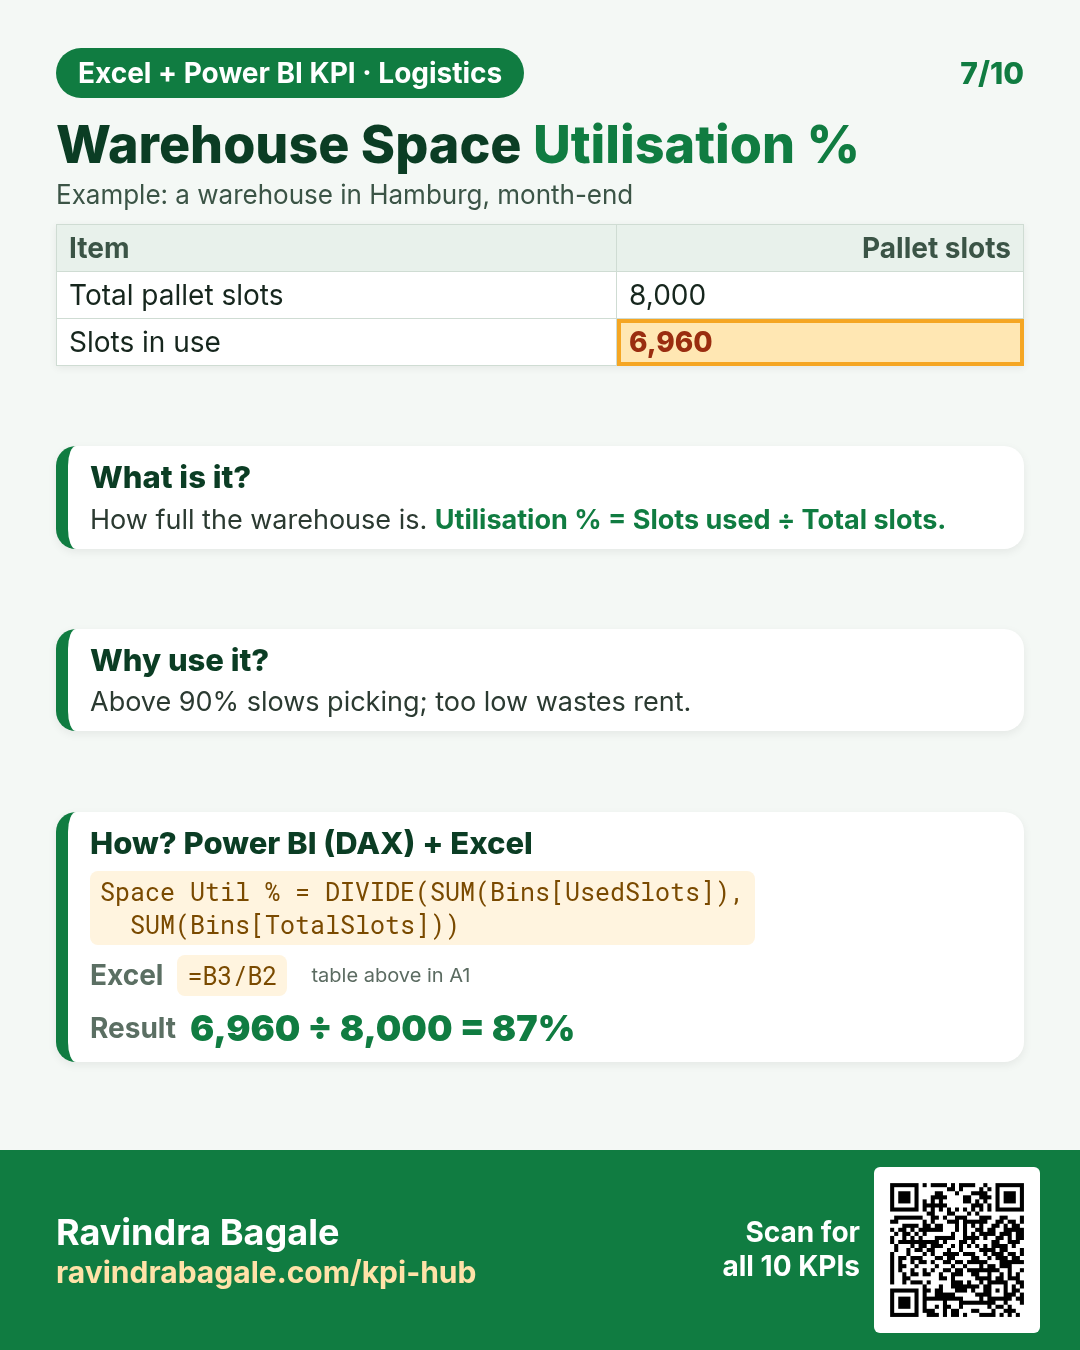
DAX: Space Util % = DIVIDE(SUM(Bins[UsedSlots]), SUM(Bins[TotalSlots]))Excel: =B3/B2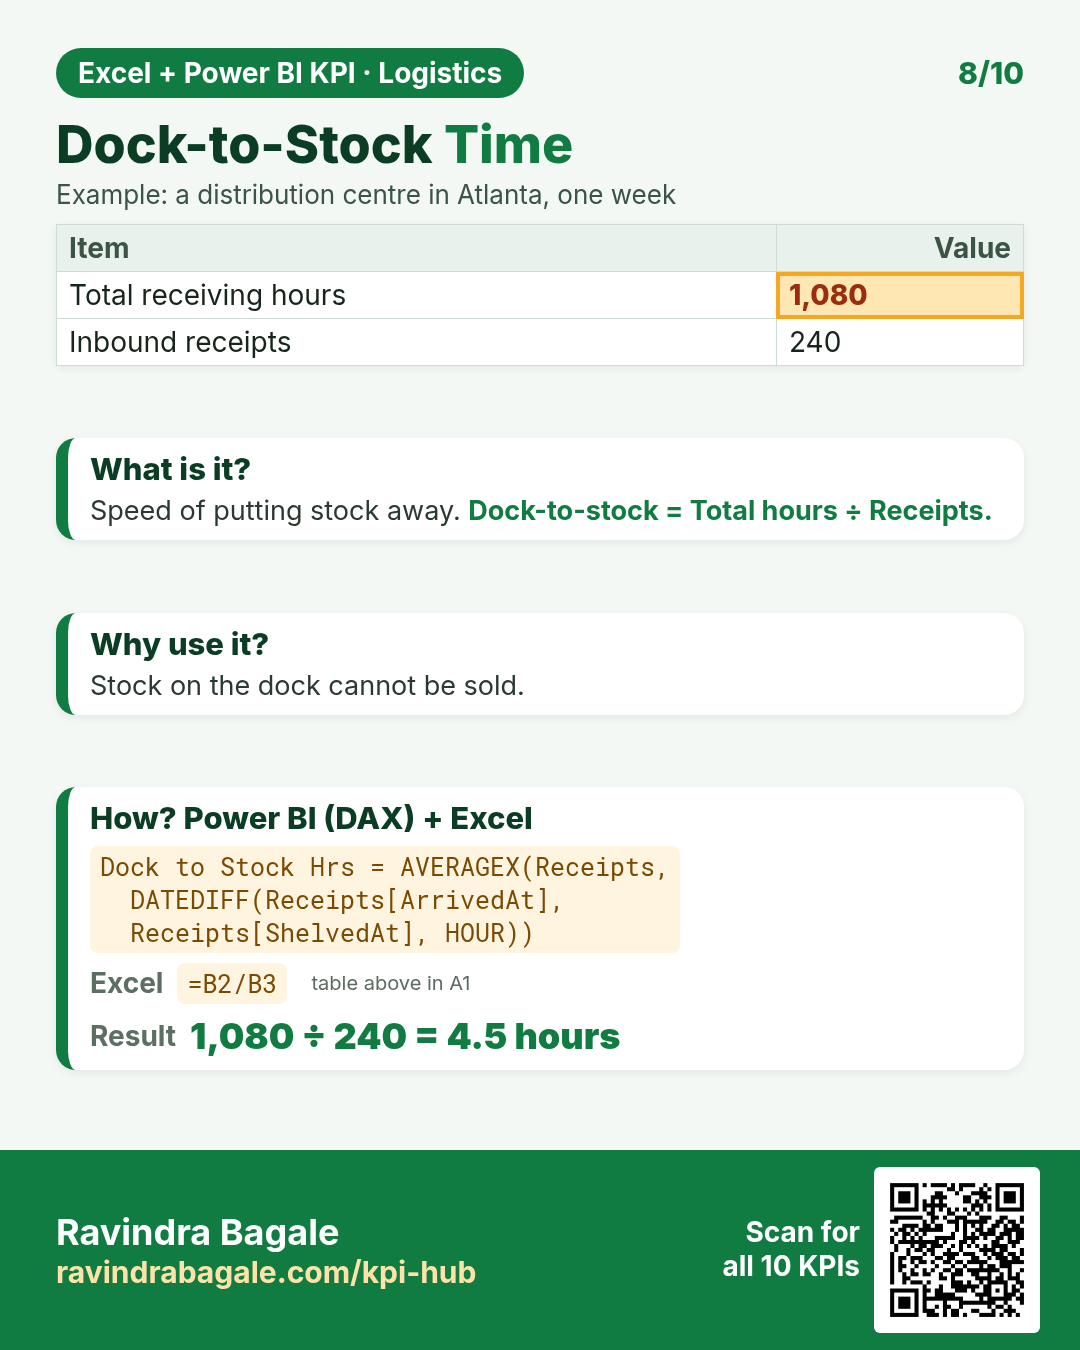
DAX: Dock to Stock Hrs = AVERAGEX(Receipts, DATEDIFF(Receipts[ArrivedAt], Receipts[ShelvedAt], HOUR))Excel: =B2/B3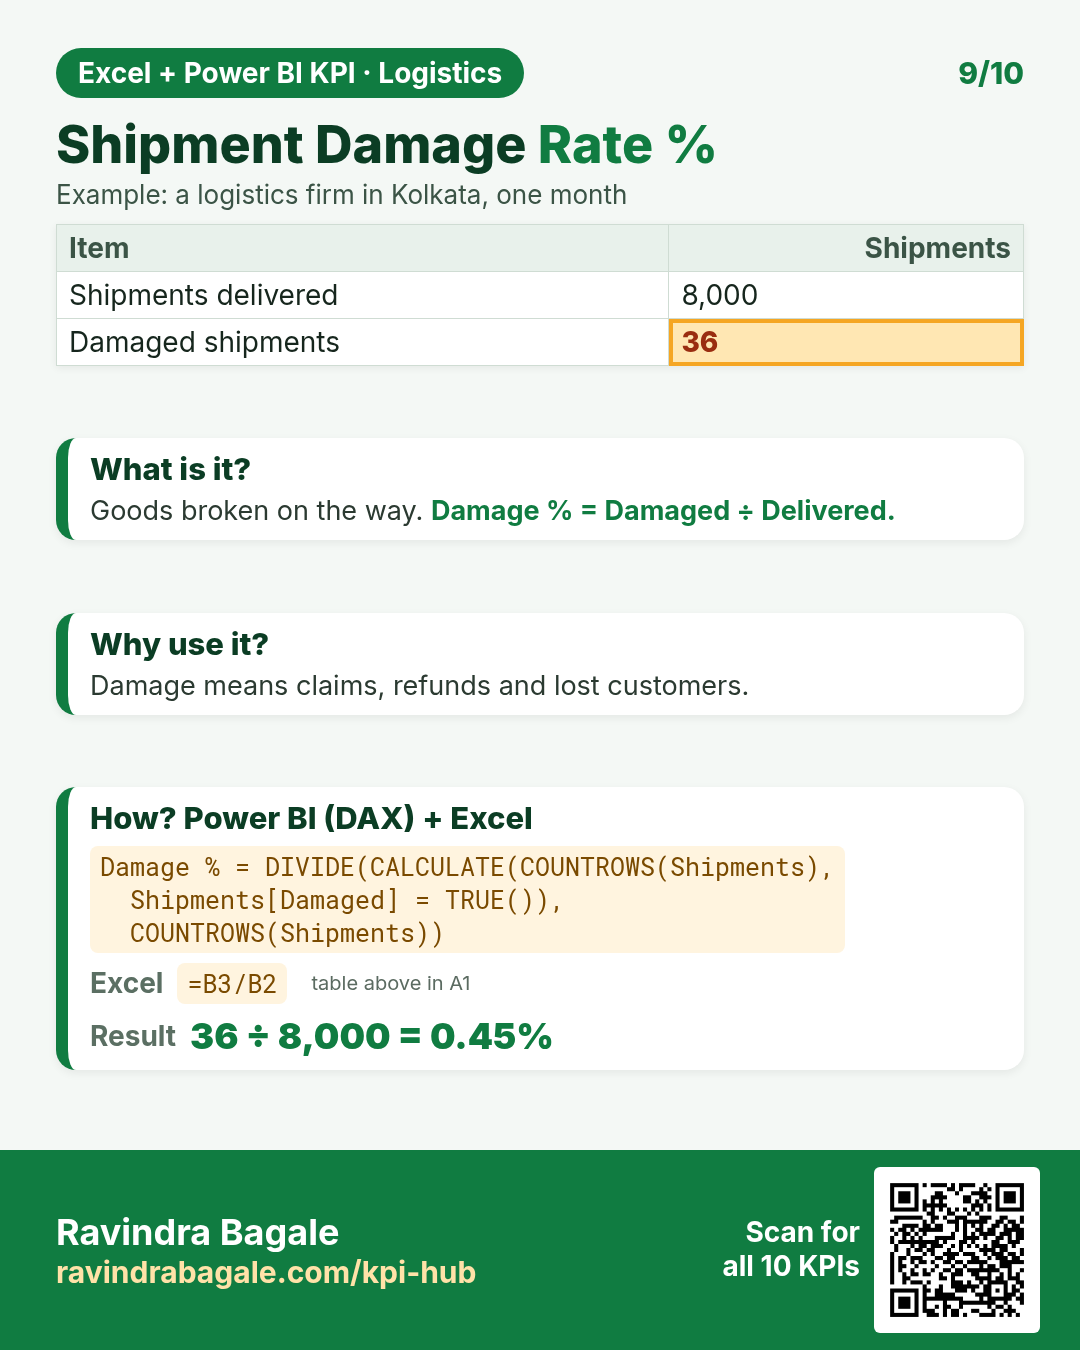
DAX: Damage % = DIVIDE(CALCULATE(COUNTROWS(Shipments), Shipments[Damaged] = TRUE()), COUNTROWS(Shipments))Excel: =B3/B2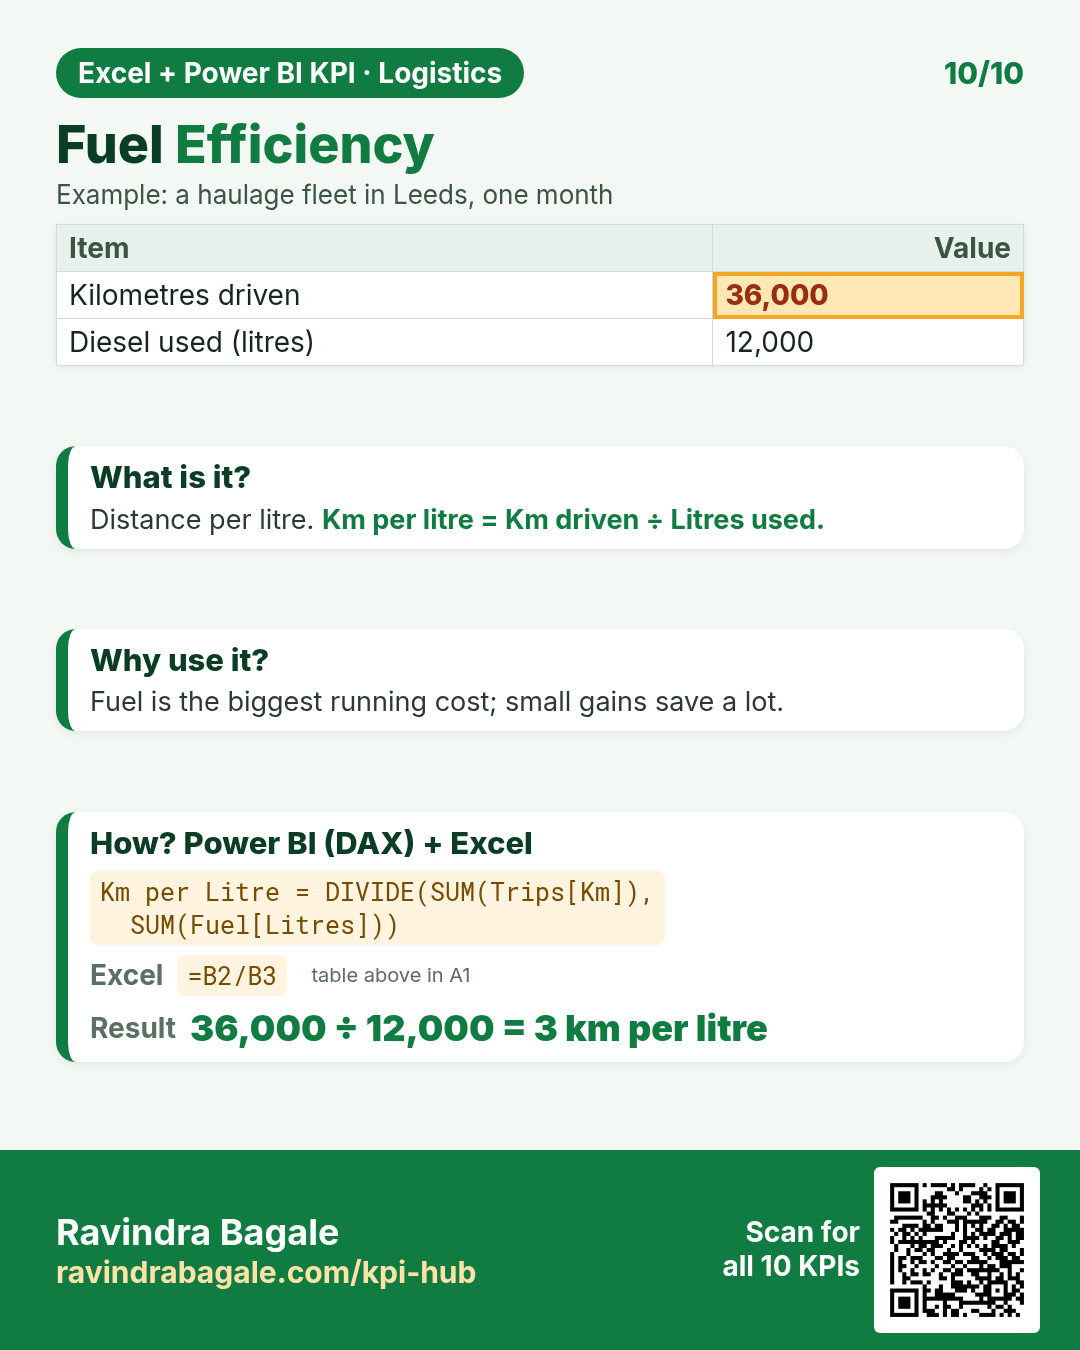
DAX: Km per Litre = DIVIDE(SUM(Trips[Km]), SUM(Fuel[Litres]))Excel: =B2/B3Quick quiz
1. On-Time Delivery %: Shipments delivered 5,000, Delivered on time 4,650. The answer is…
2. Cost per Shipment: Transport cost €126,000, Shipments 4,200. The answer is…
3. Perfect Order Rate %: Orders shipped 2,000, Orders with no error 1,940. The answer is…
4. Which KPI means: “Share of truck-days the fleet was actually working.”