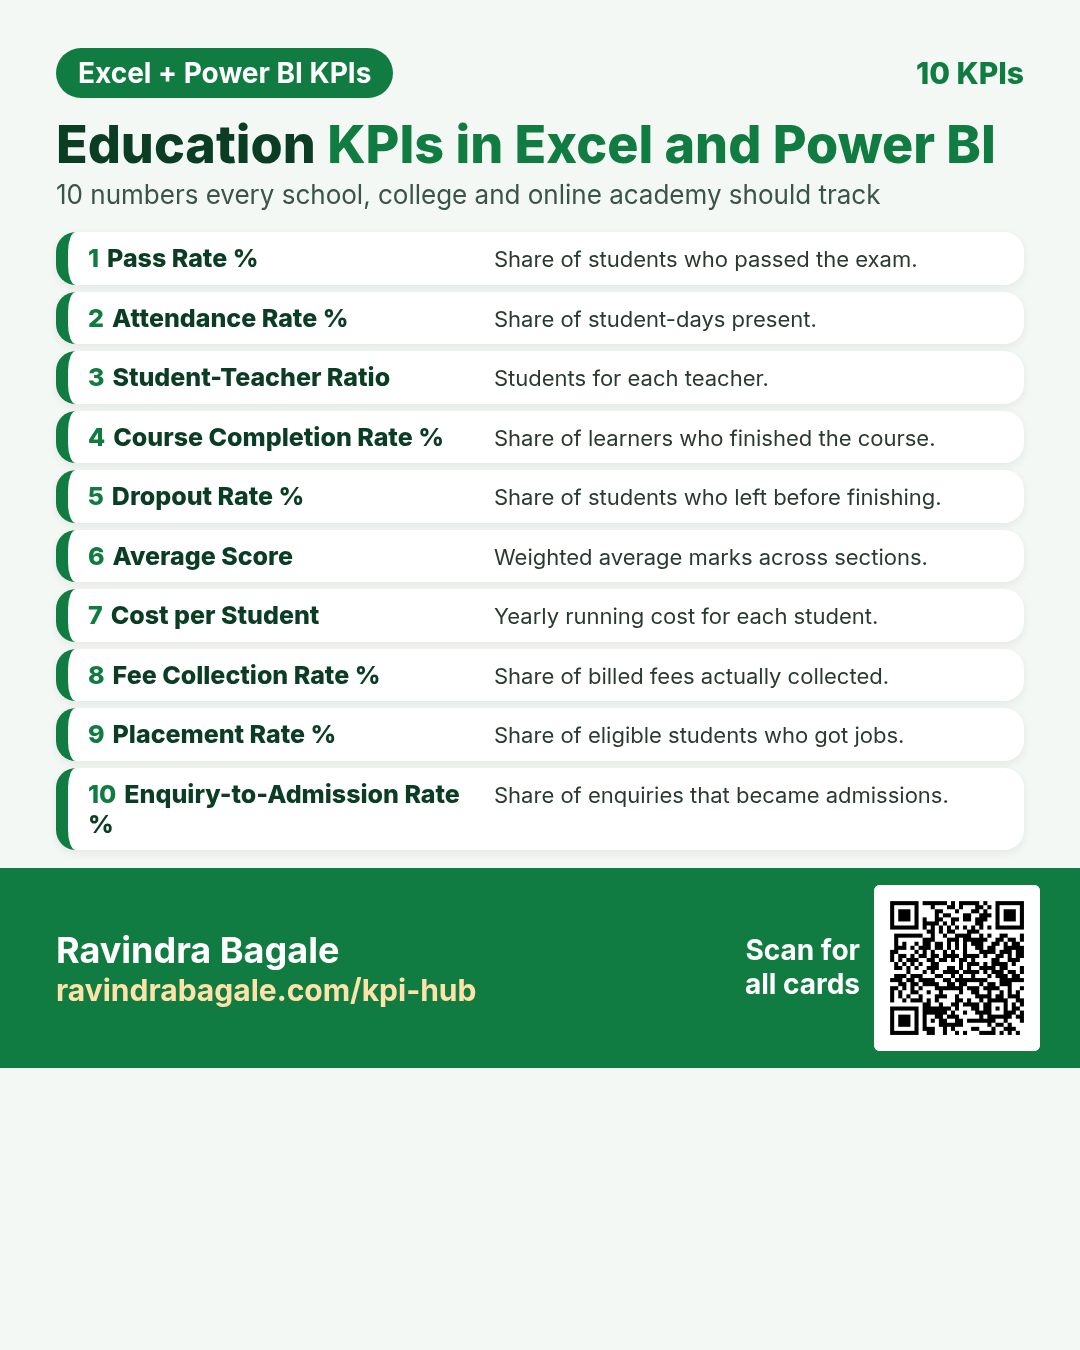
Education KPIs in Excel and Power BI
Ten important KPIs for school, college and online academy. Each card has what it is, why it matters, the Excel formula, the DAX measure and a tiny worked example. Every card shows the Excel formula next to the Power BI DAX measure. For Excel, put the card’s example table in cell A1 (labels in column A, numbers in column B).
About this data: All examples are made-up teaching numbers for schools and colleges in Nagpur, Leicester, Bengaluru, San Francisco, Lisbon, Jaipur, Hyderabad, Indore, Boston and Bristol, in ₹, £, $ and €. Table names (Results, Attendance, Students, Teachers, Enrolments, Expenses, Fees, Admissions, Enquiries) are sample names.
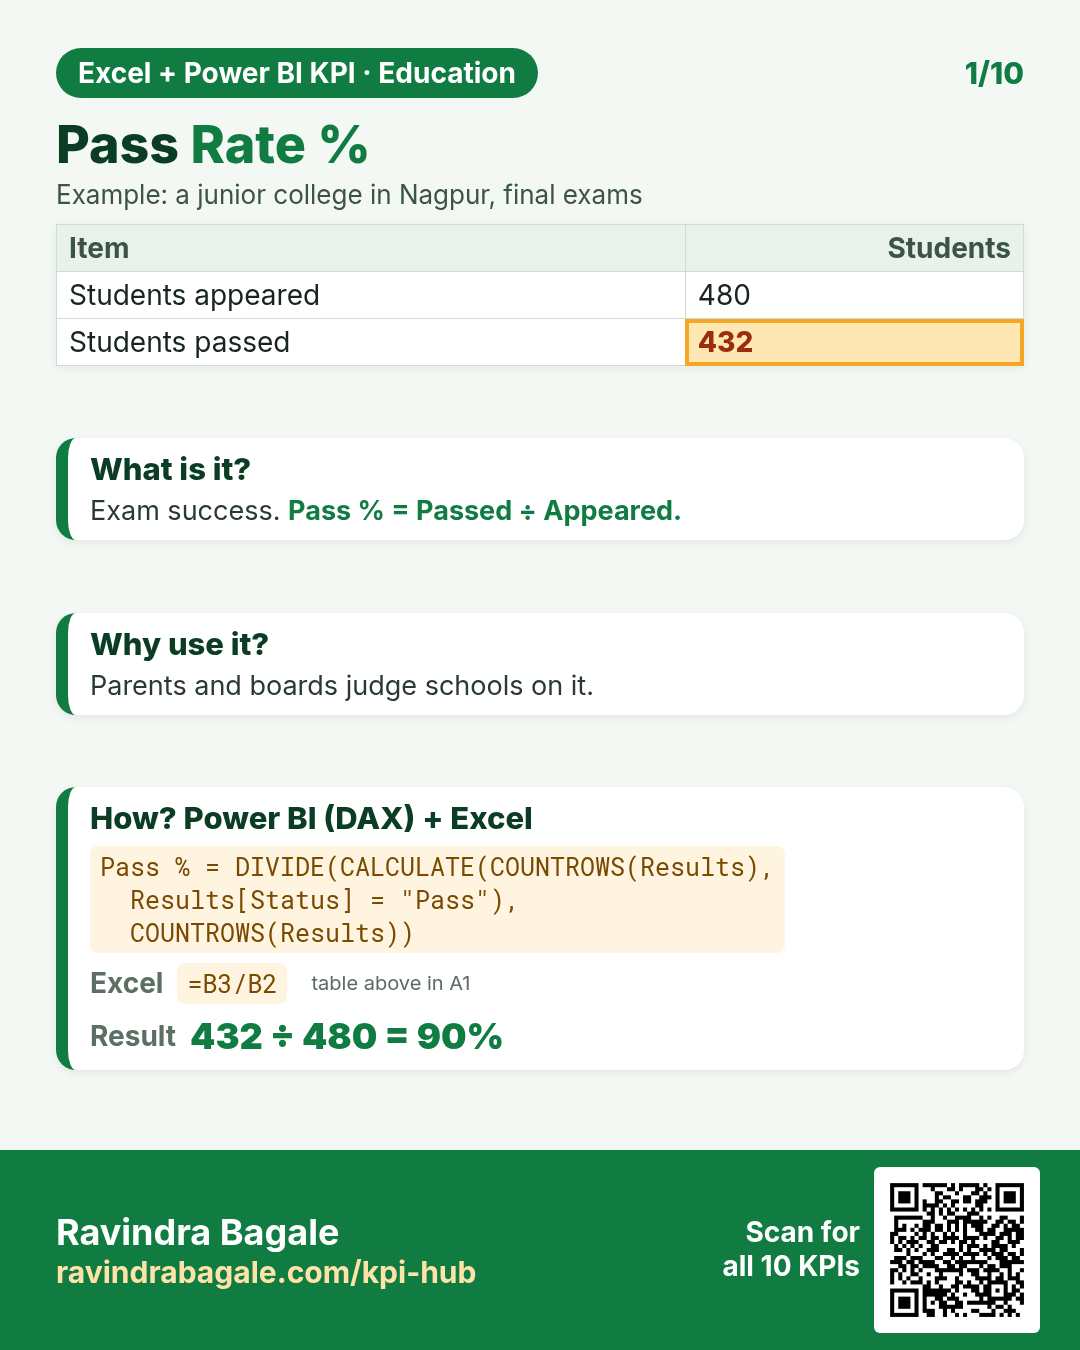
DAX: Pass % = DIVIDE(CALCULATE(COUNTROWS(Results), Results[Status] = "Pass"), COUNTROWS(Results))Excel: =B3/B2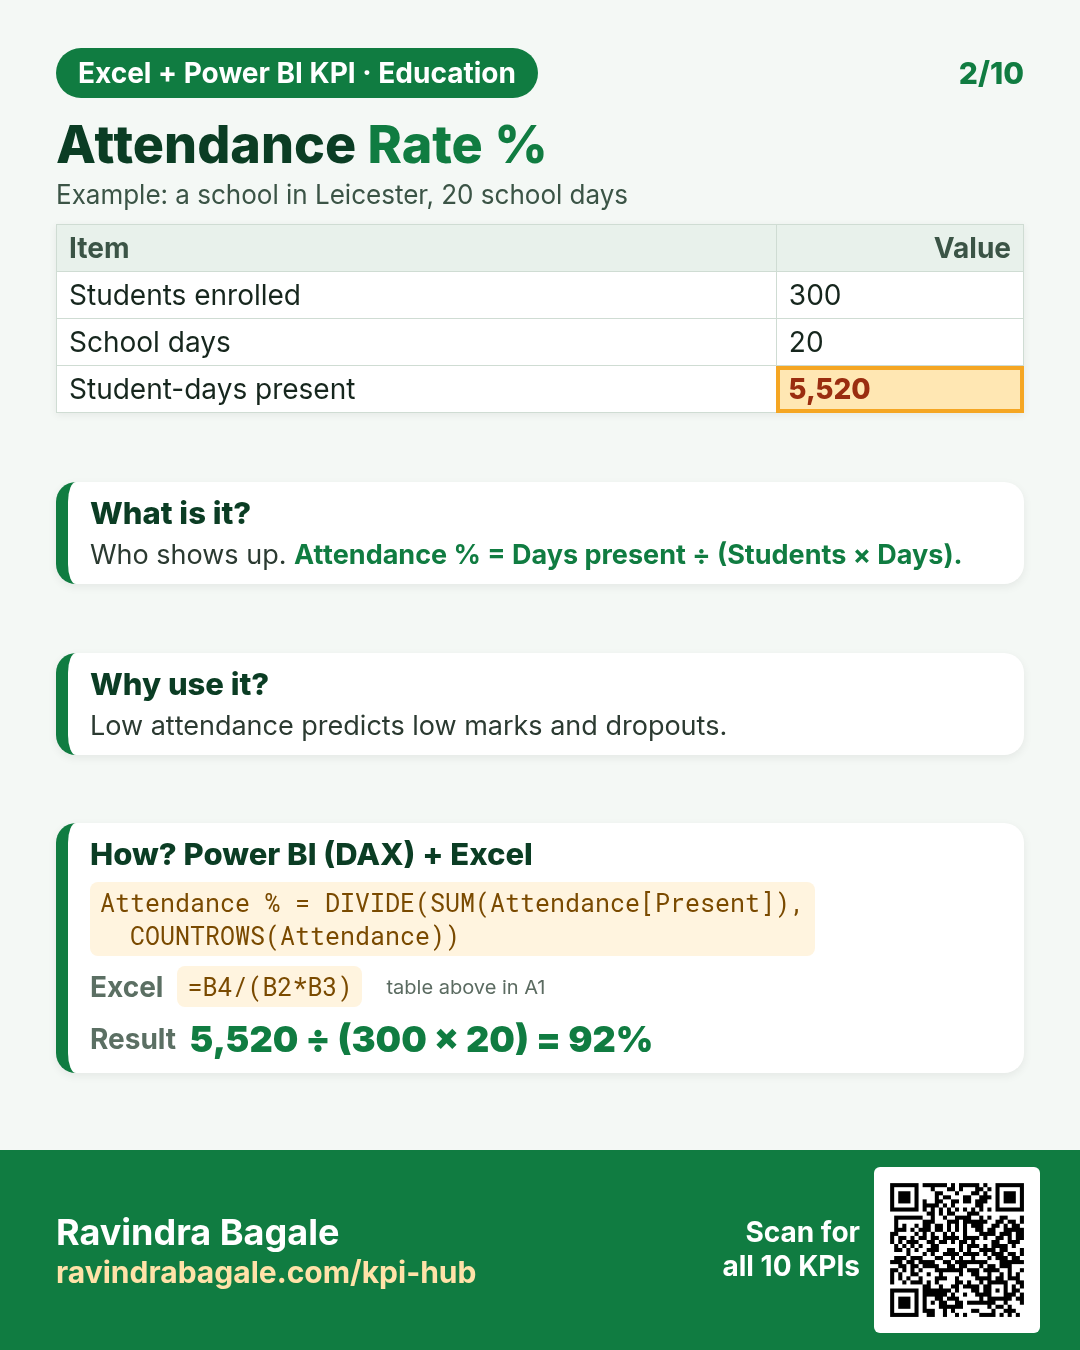
DAX: Attendance % = DIVIDE(SUM(Attendance[Present]), COUNTROWS(Attendance))Excel: =B4/(B2*B3)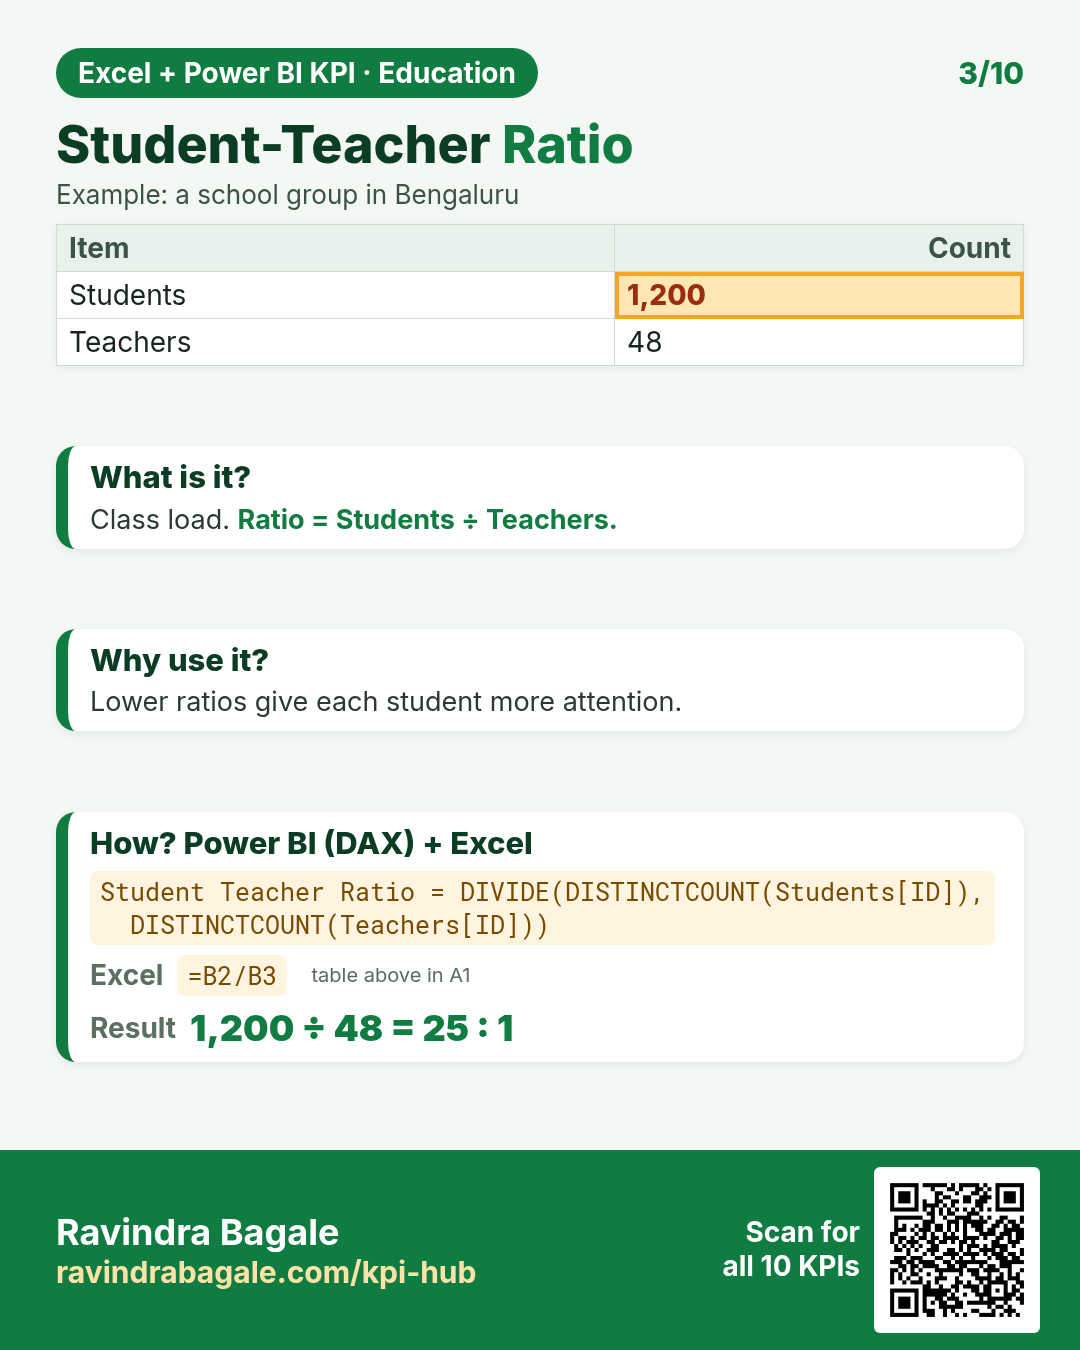
DAX: Student Teacher Ratio = DIVIDE(DISTINCTCOUNT(Students[ID]), DISTINCTCOUNT(Teachers[ID]))Excel: =B2/B3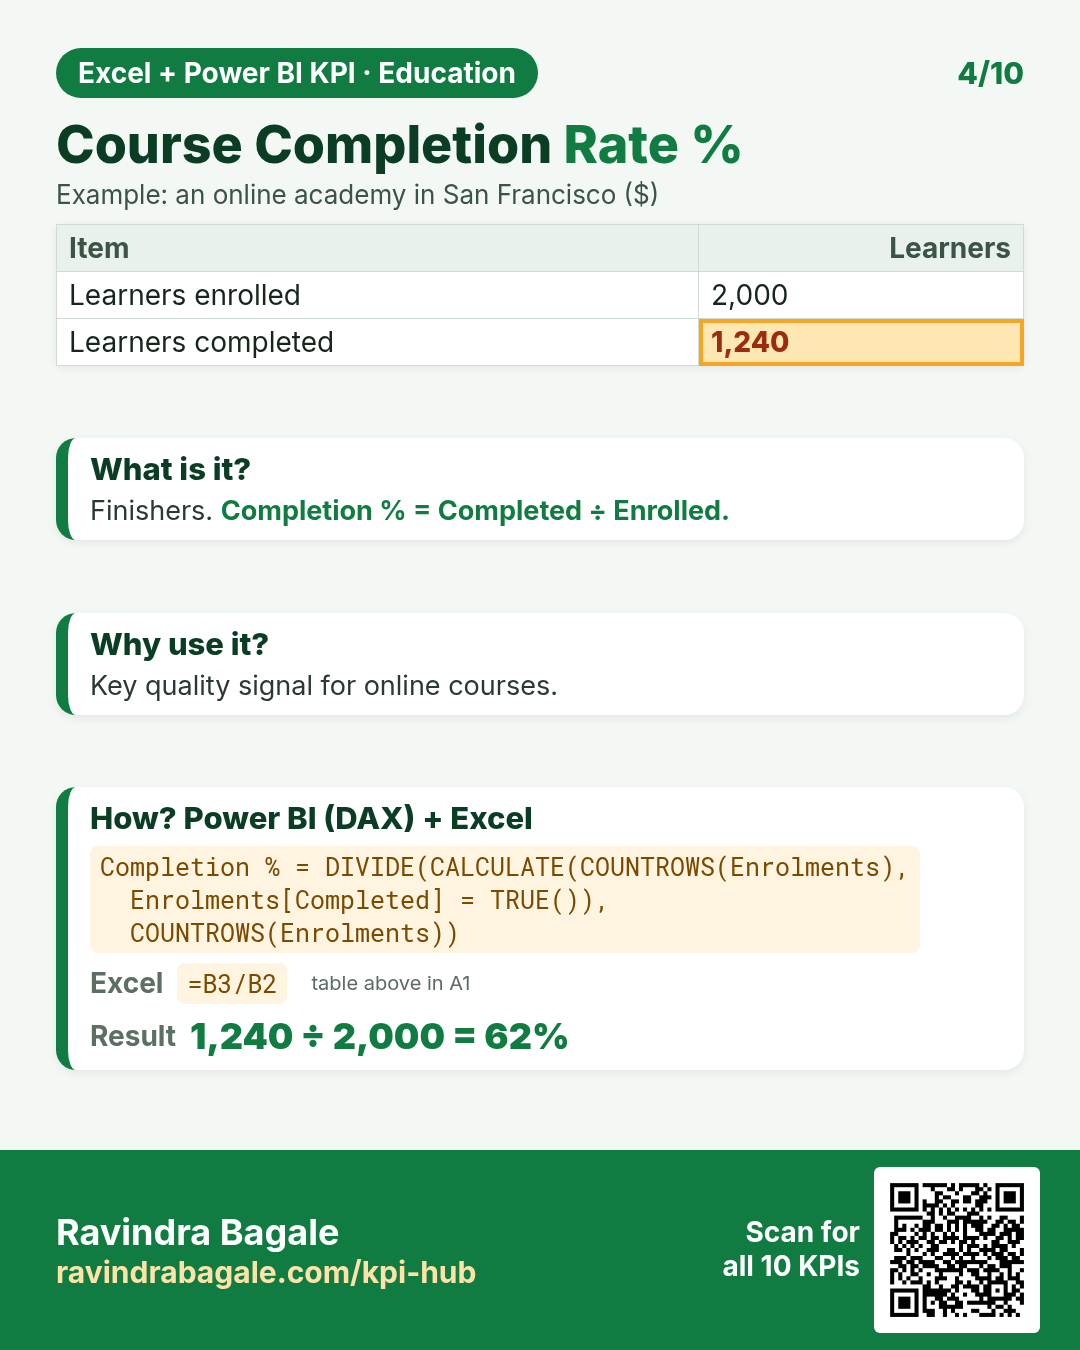
DAX: Completion % = DIVIDE(CALCULATE(COUNTROWS(Enrolments), Enrolments[Completed] = TRUE()), COUNTROWS(Enrolments))Excel: =B3/B2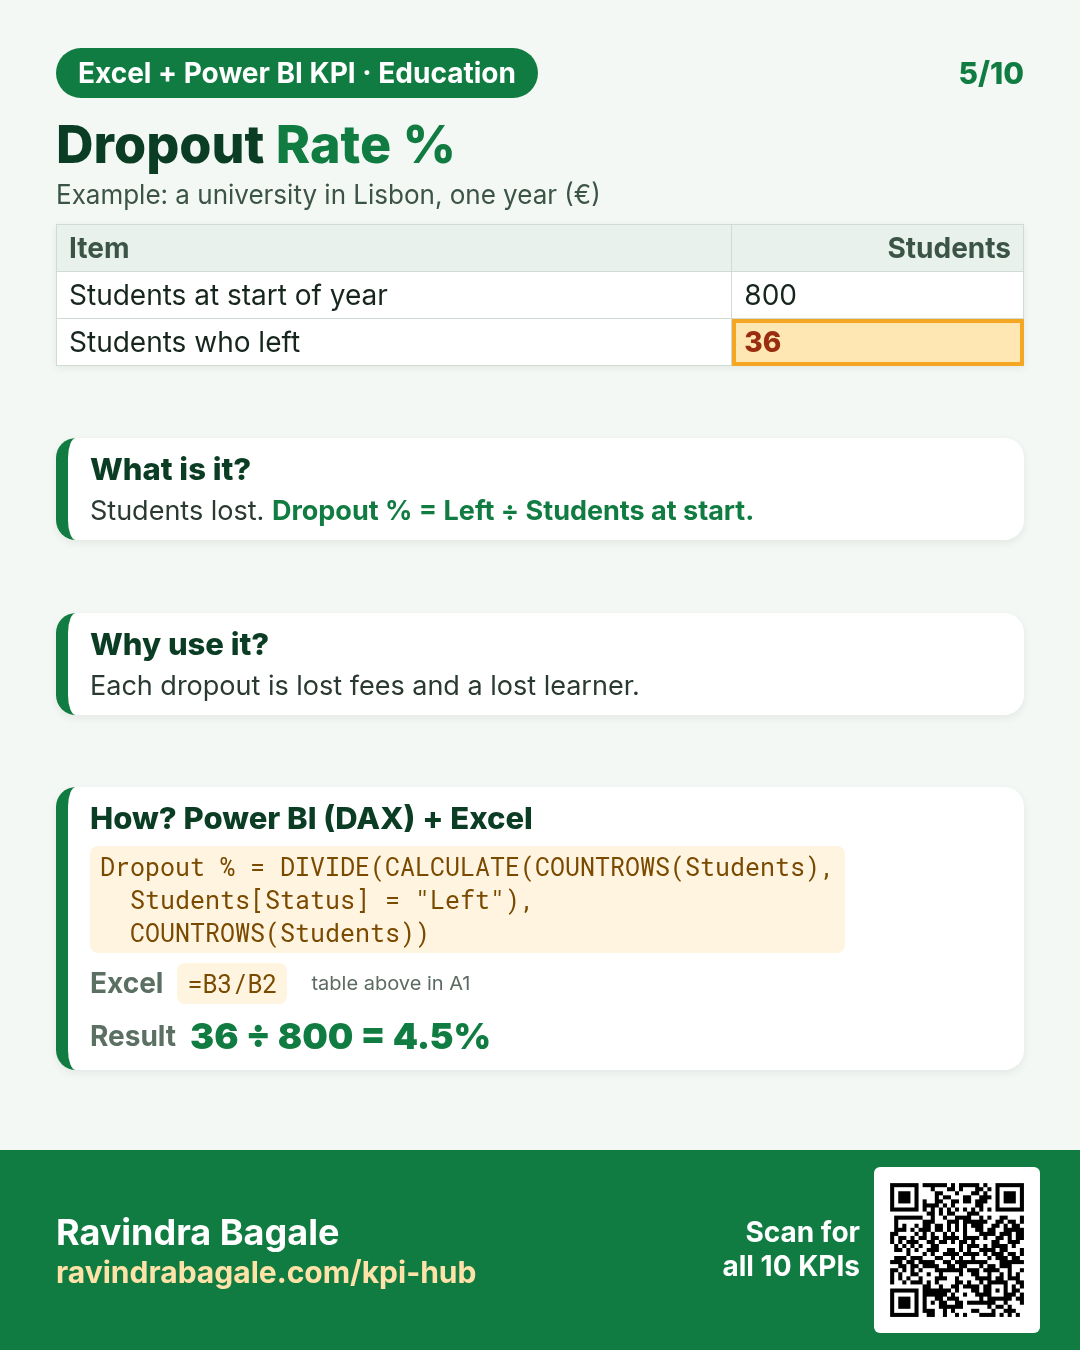
DAX: Dropout % = DIVIDE(CALCULATE(COUNTROWS(Students), Students[Status] = "Left"), COUNTROWS(Students))Excel: =B3/B2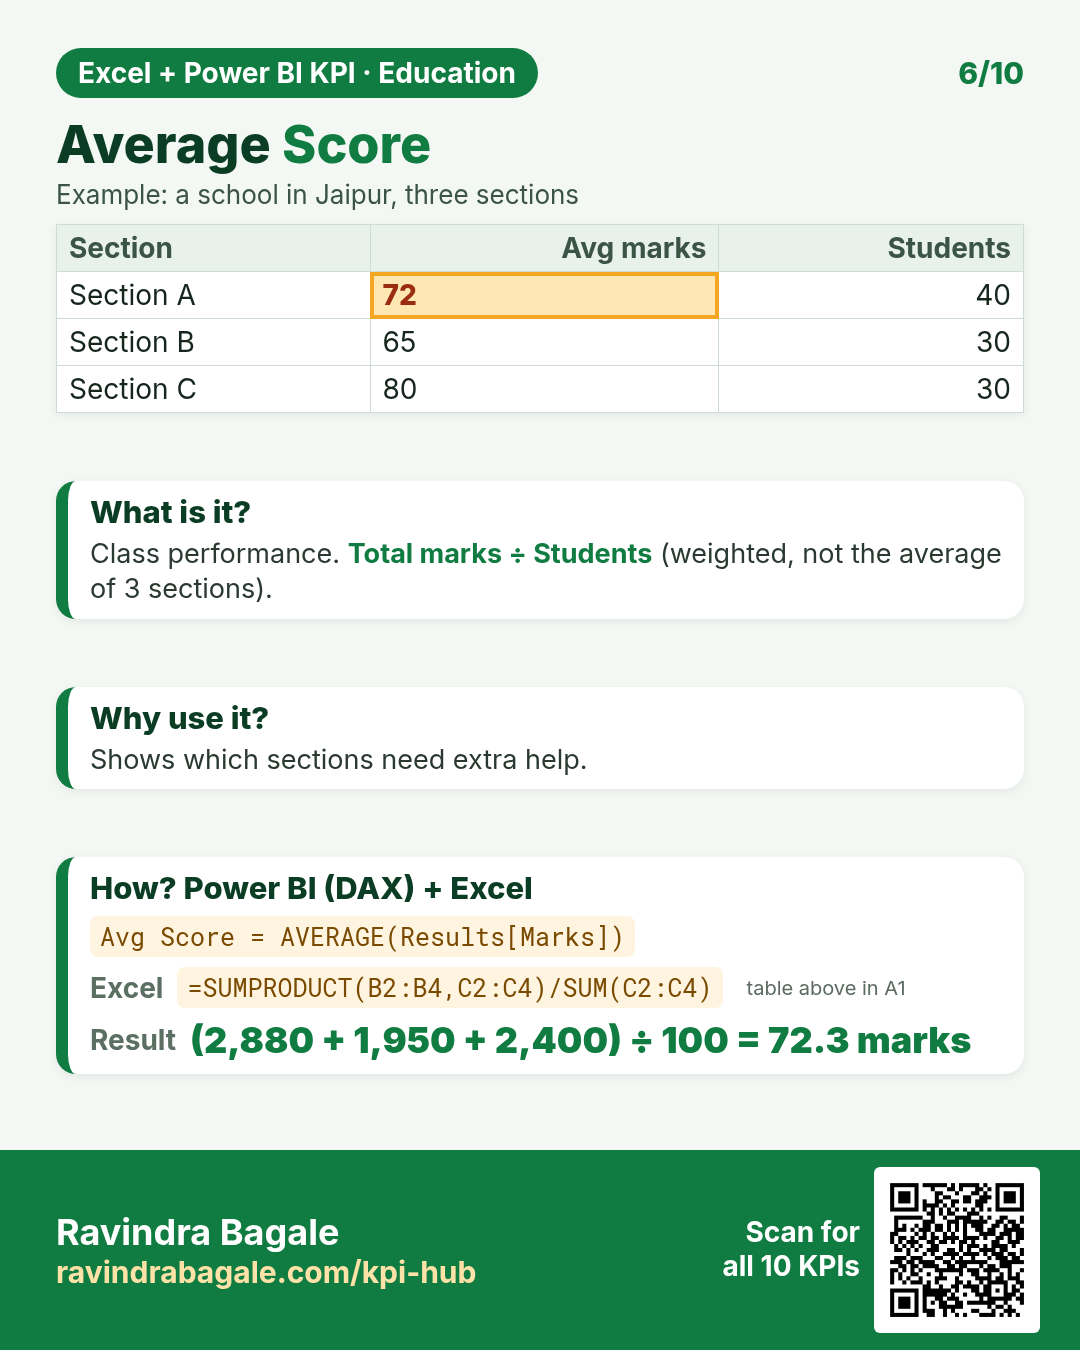
DAX: Avg Score = AVERAGE(Results[Marks])Excel: =SUMPRODUCT(B2:B4,C2:C4)/SUM(C2:C4)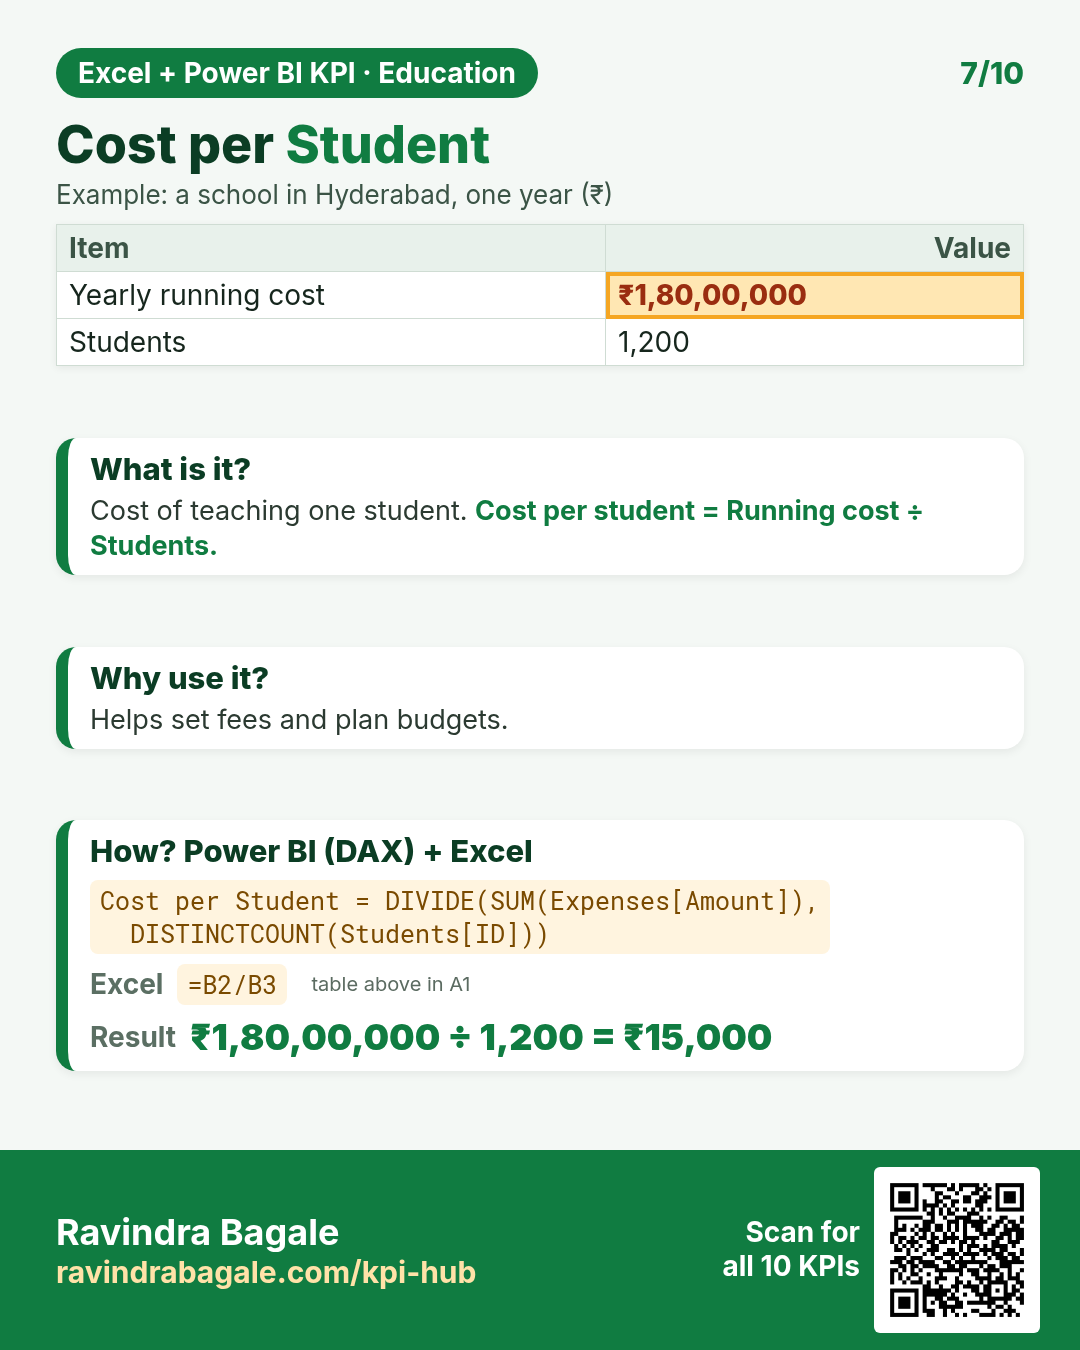
DAX: Cost per Student = DIVIDE(SUM(Expenses[Amount]), DISTINCTCOUNT(Students[ID]))Excel: =B2/B3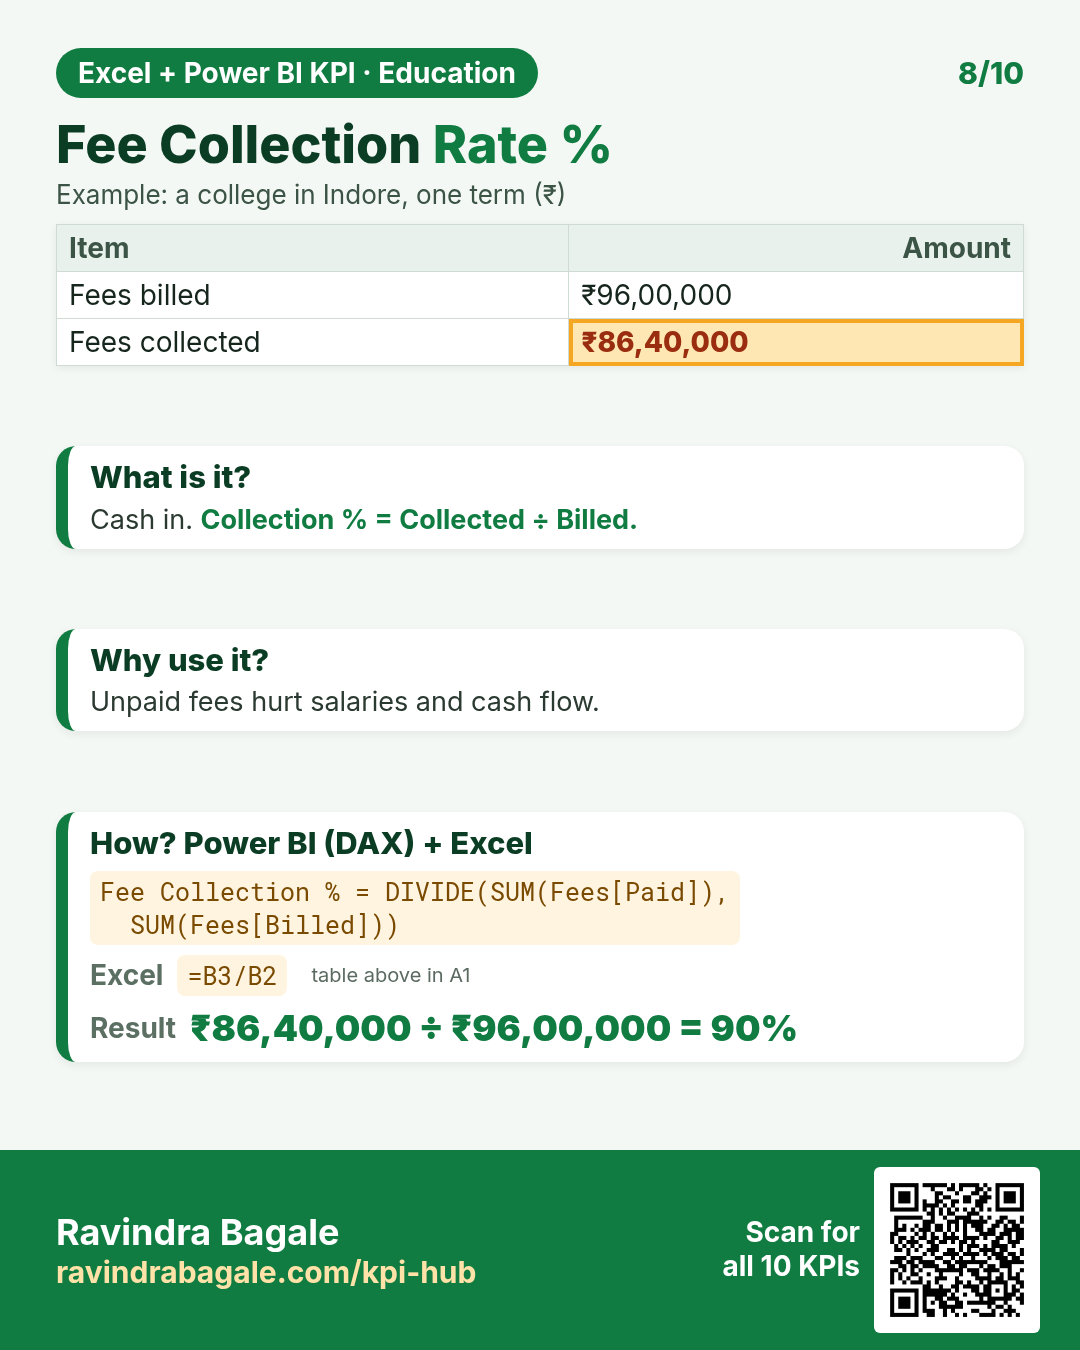
DAX: Fee Collection % = DIVIDE(SUM(Fees[Paid]), SUM(Fees[Billed]))Excel: =B3/B2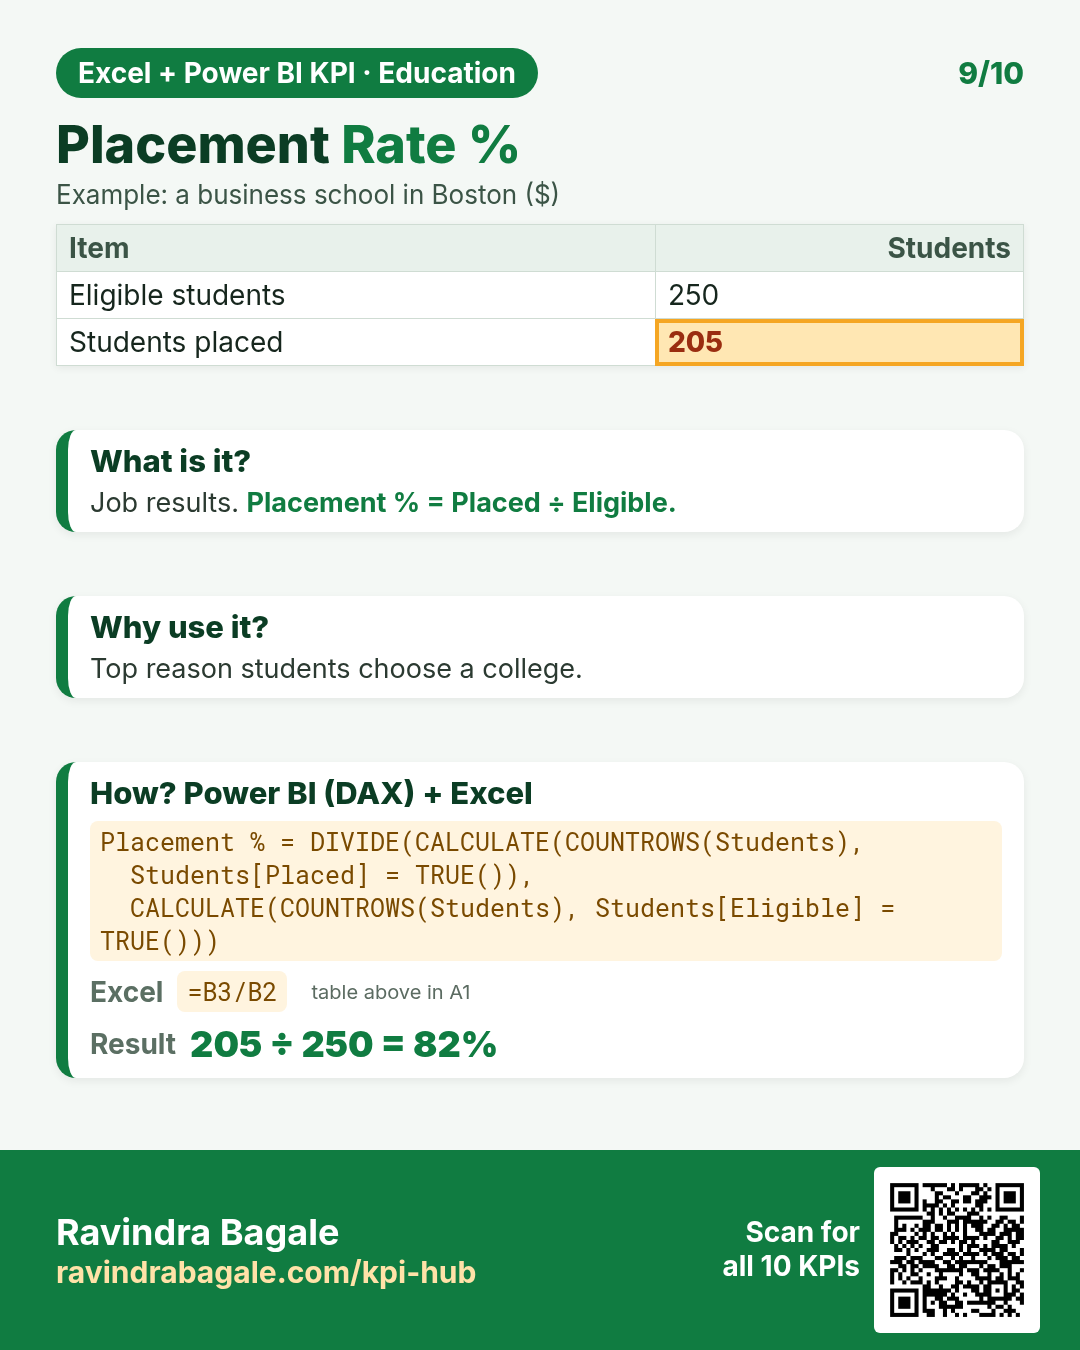
DAX: Placement % = DIVIDE(CALCULATE(COUNTROWS(Students), Students[Placed] = TRUE()), CALCULATE(COUNTROWS(Students), Students[Eligible] = TRUE()))Excel: =B3/B2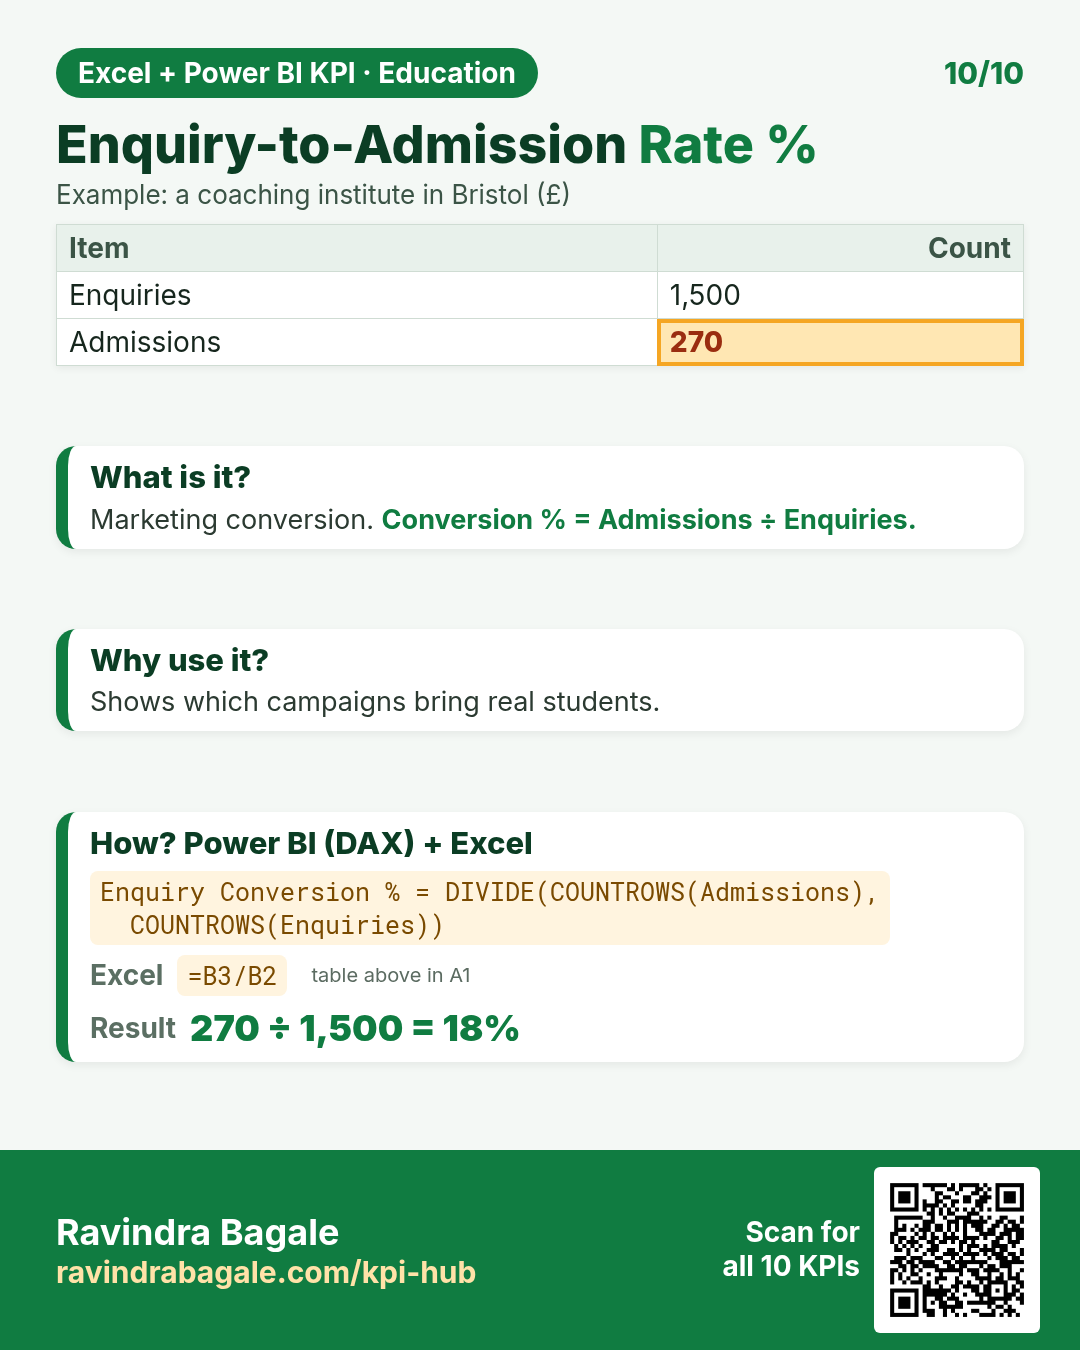
DAX: Enquiry Conversion % = DIVIDE(COUNTROWS(Admissions), COUNTROWS(Enquiries))Excel: =B3/B2Quick quiz
1. Pass Rate %: Students appeared 480, Students passed 432. The answer is…
2. Attendance Rate %: Students enrolled 300, School days 20, Student-days present 5,520. The answer is…
3. Student-Teacher Ratio: Students 1,200, Teachers 48. The answer is…
4. Which KPI means: “Share of learners who finished the course.”