Manufacturing KPIs in Excel and Power BI
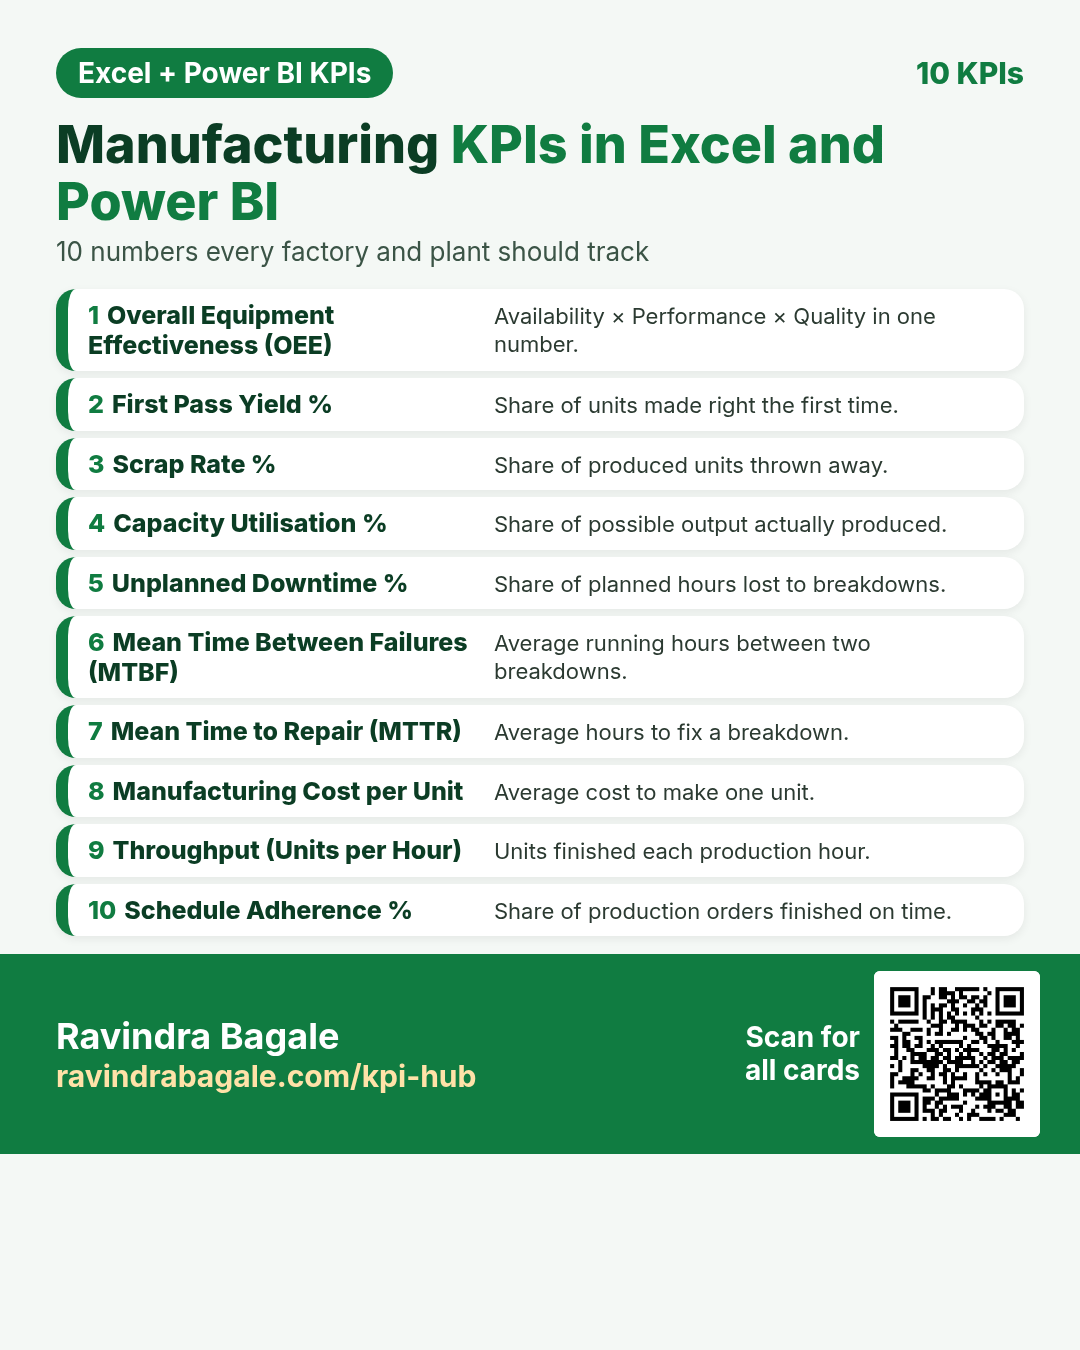
Ten important KPIs for factory and plant. Each card has what it is, why it matters, the Excel formula, the DAX measure and a tiny worked example. Every card shows the Excel formula next to the Power BI DAX measure. For Excel, put the card’s example table in cell A1 (labels in column A, numbers in column B).
About this data: All examples are made-up teaching numbers for plants in Pune, Detroit, Stuttgart, Ahmedabad, Glasgow, Coimbatore, Ohio, Lyon, Nashik and Sheffield, in ₹, $, € and £. Table names (Production, QC, Scrap, Capacity, Downtime, Schedule, Machine, Failures, Costs, WorkOrders) are sample names.
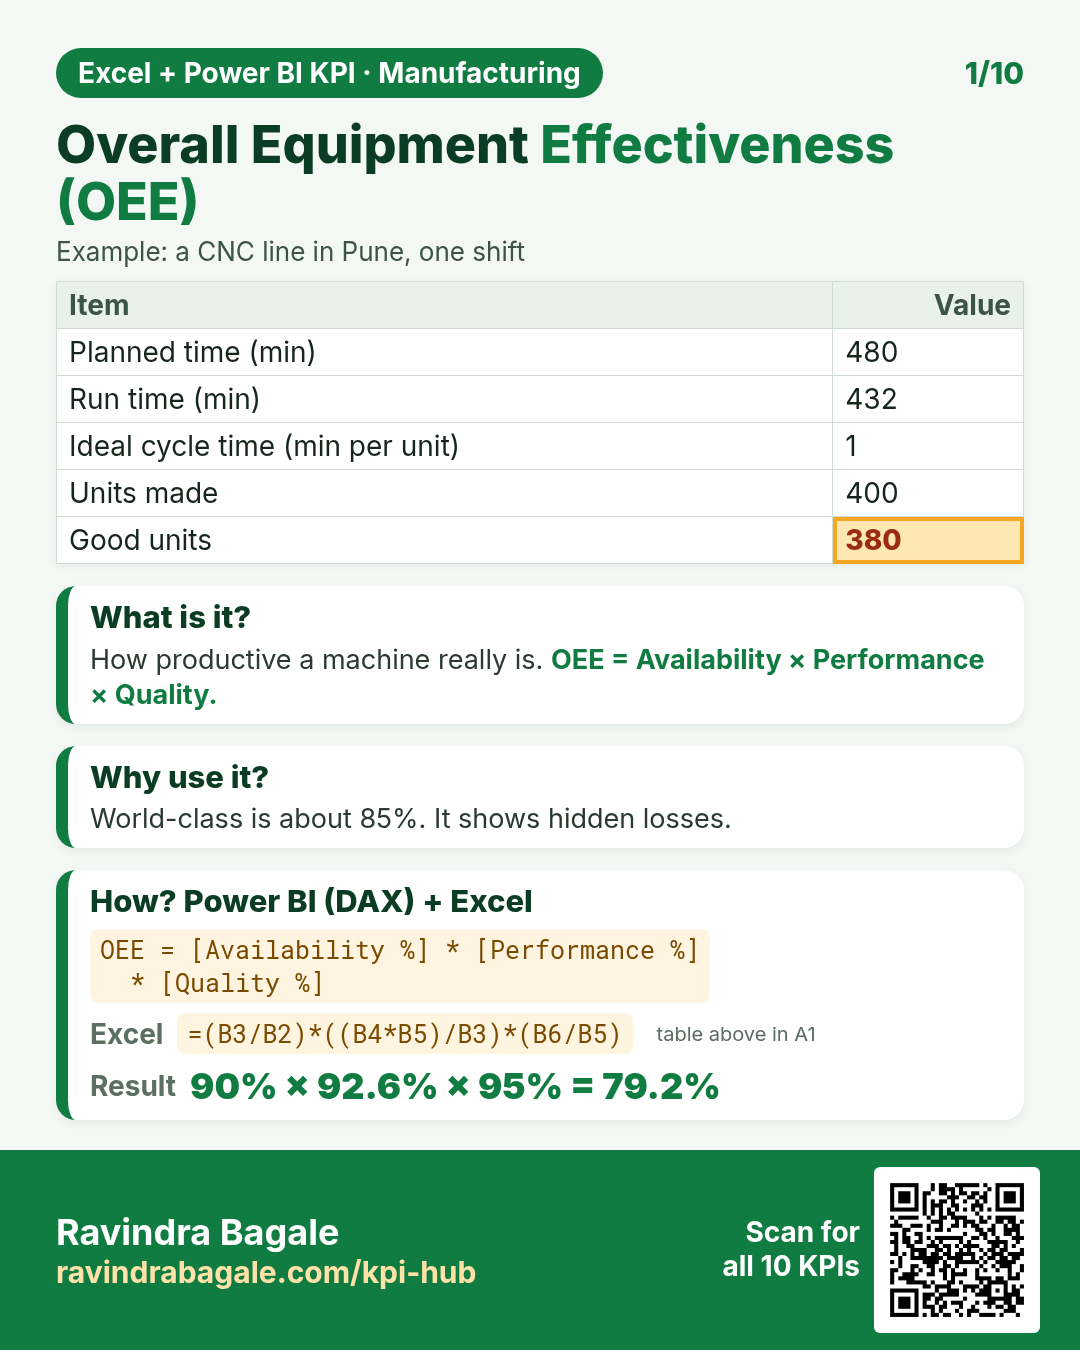
DAX: OEE = [Availability %] * [Performance %] * [Quality %]Excel: =(B3/B2)*((B4*B5)/B3)*(B6/B5)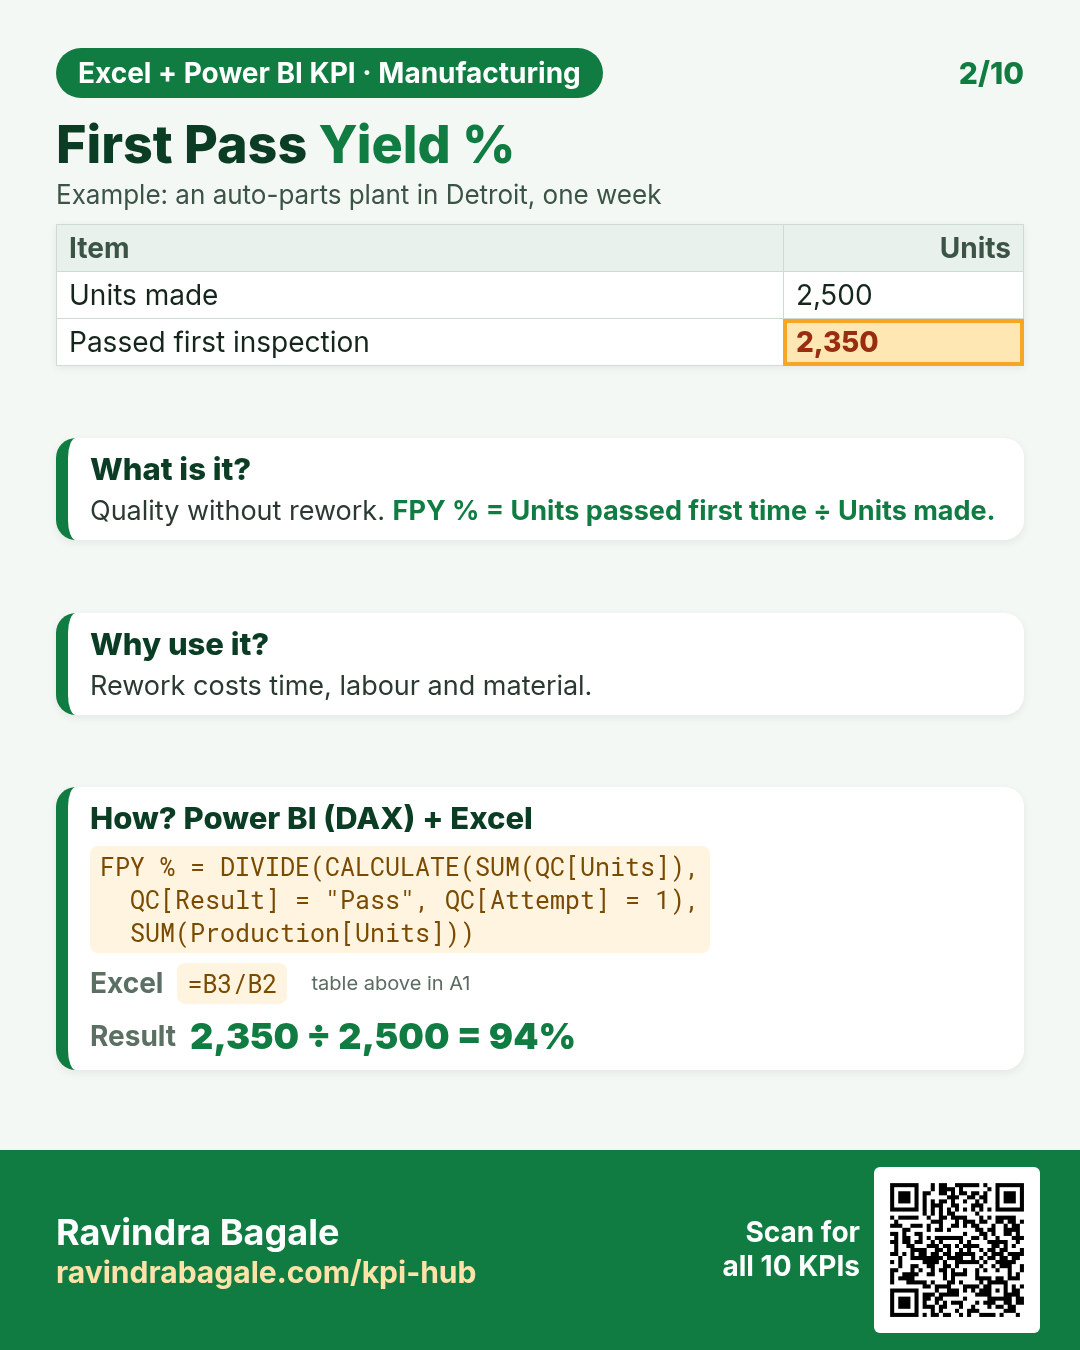
DAX: FPY % = DIVIDE(CALCULATE(SUM(QC[Units]), QC[Result] = "Pass", QC[Attempt] = 1), SUM(Production[Units]))Excel: =B3/B2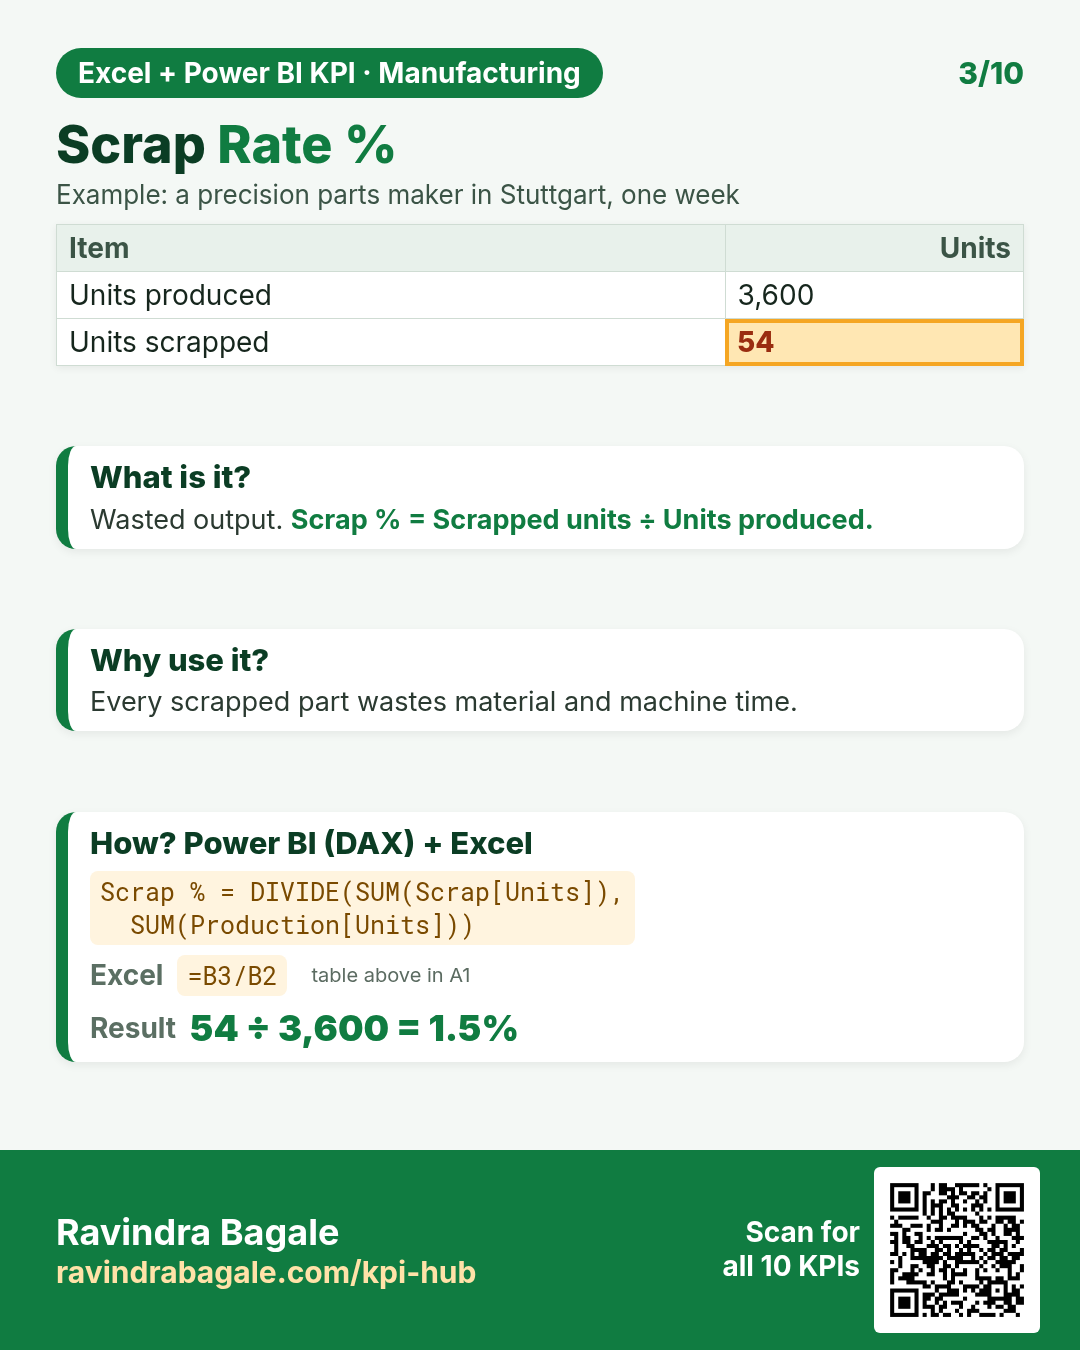
DAX: Scrap % = DIVIDE(SUM(Scrap[Units]), SUM(Production[Units]))Excel: =B3/B2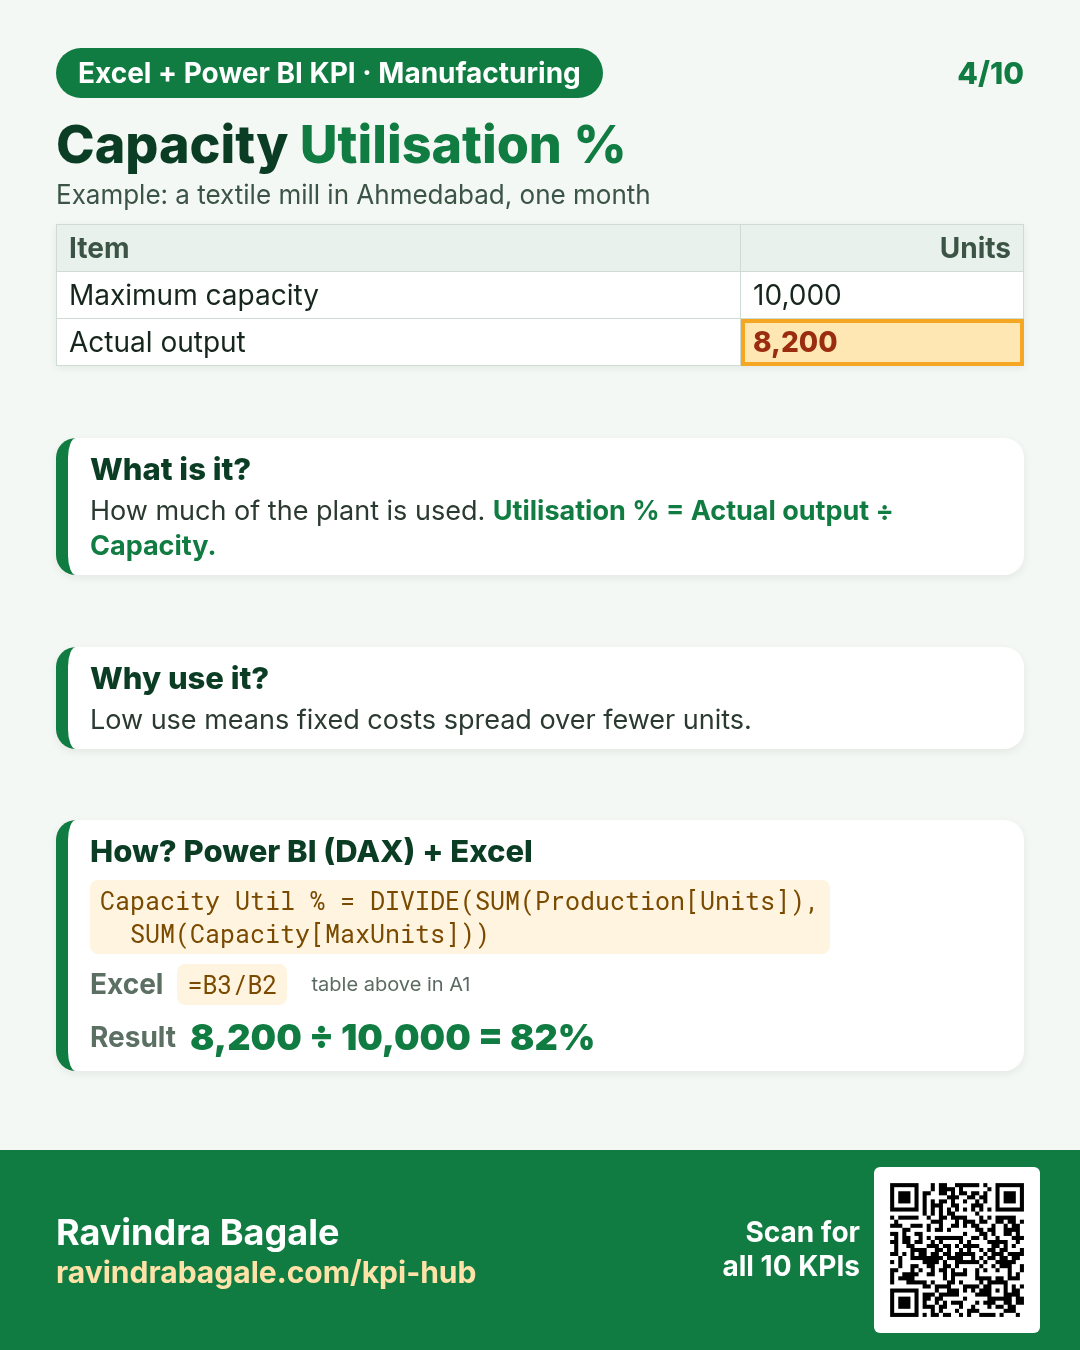
DAX: Capacity Util % = DIVIDE(SUM(Production[Units]), SUM(Capacity[MaxUnits]))Excel: =B3/B2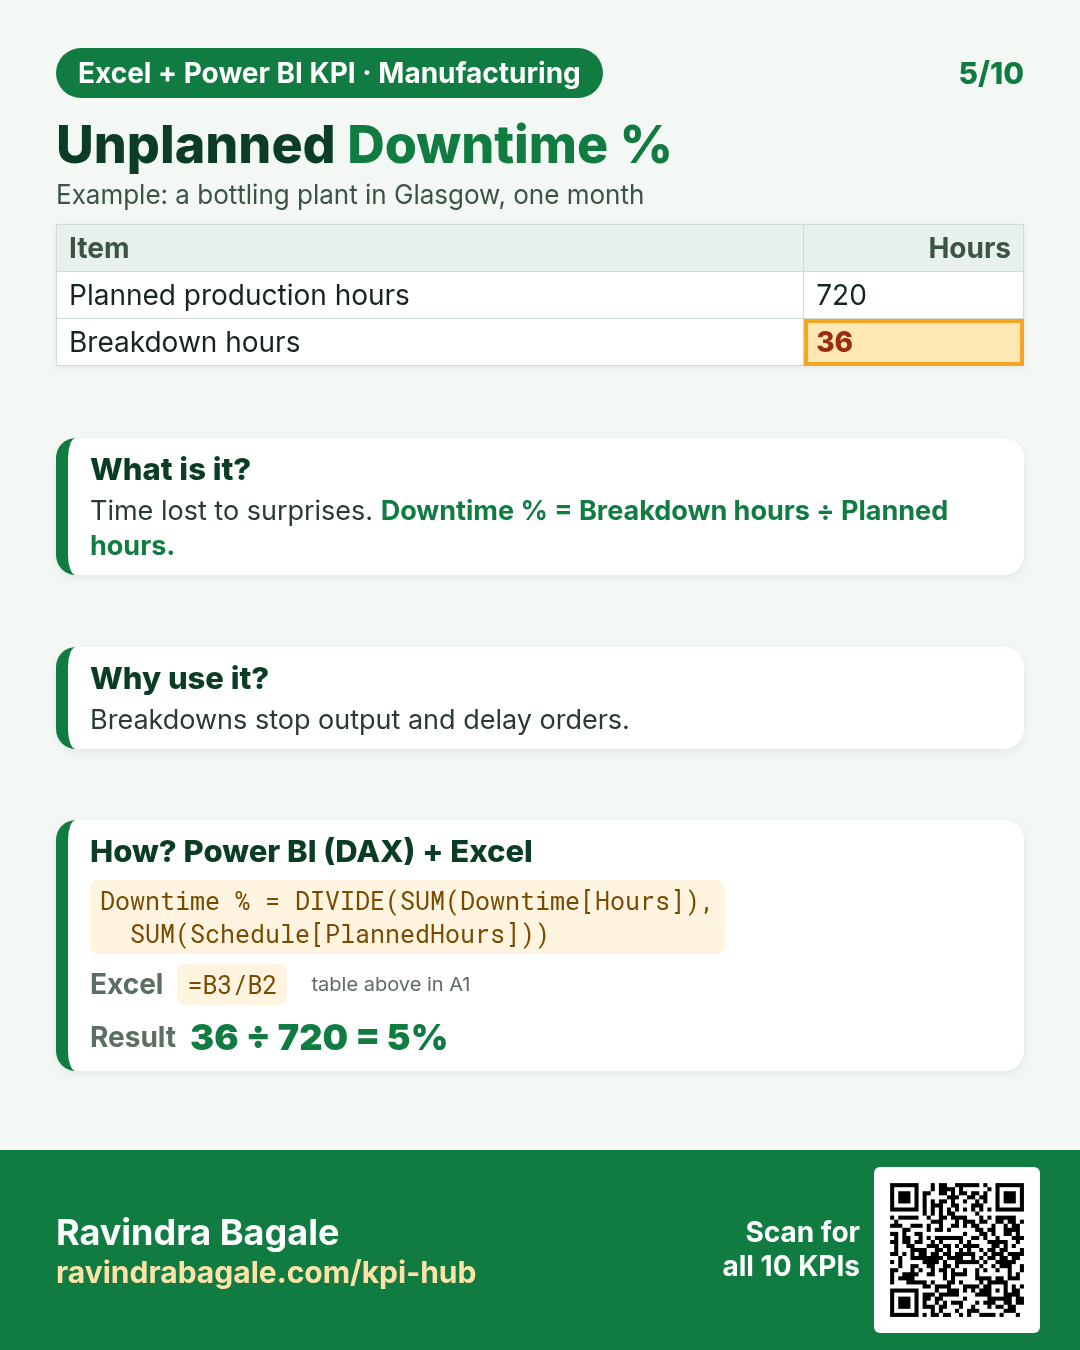
DAX: Downtime % = DIVIDE(SUM(Downtime[Hours]), SUM(Schedule[PlannedHours]))Excel: =B3/B2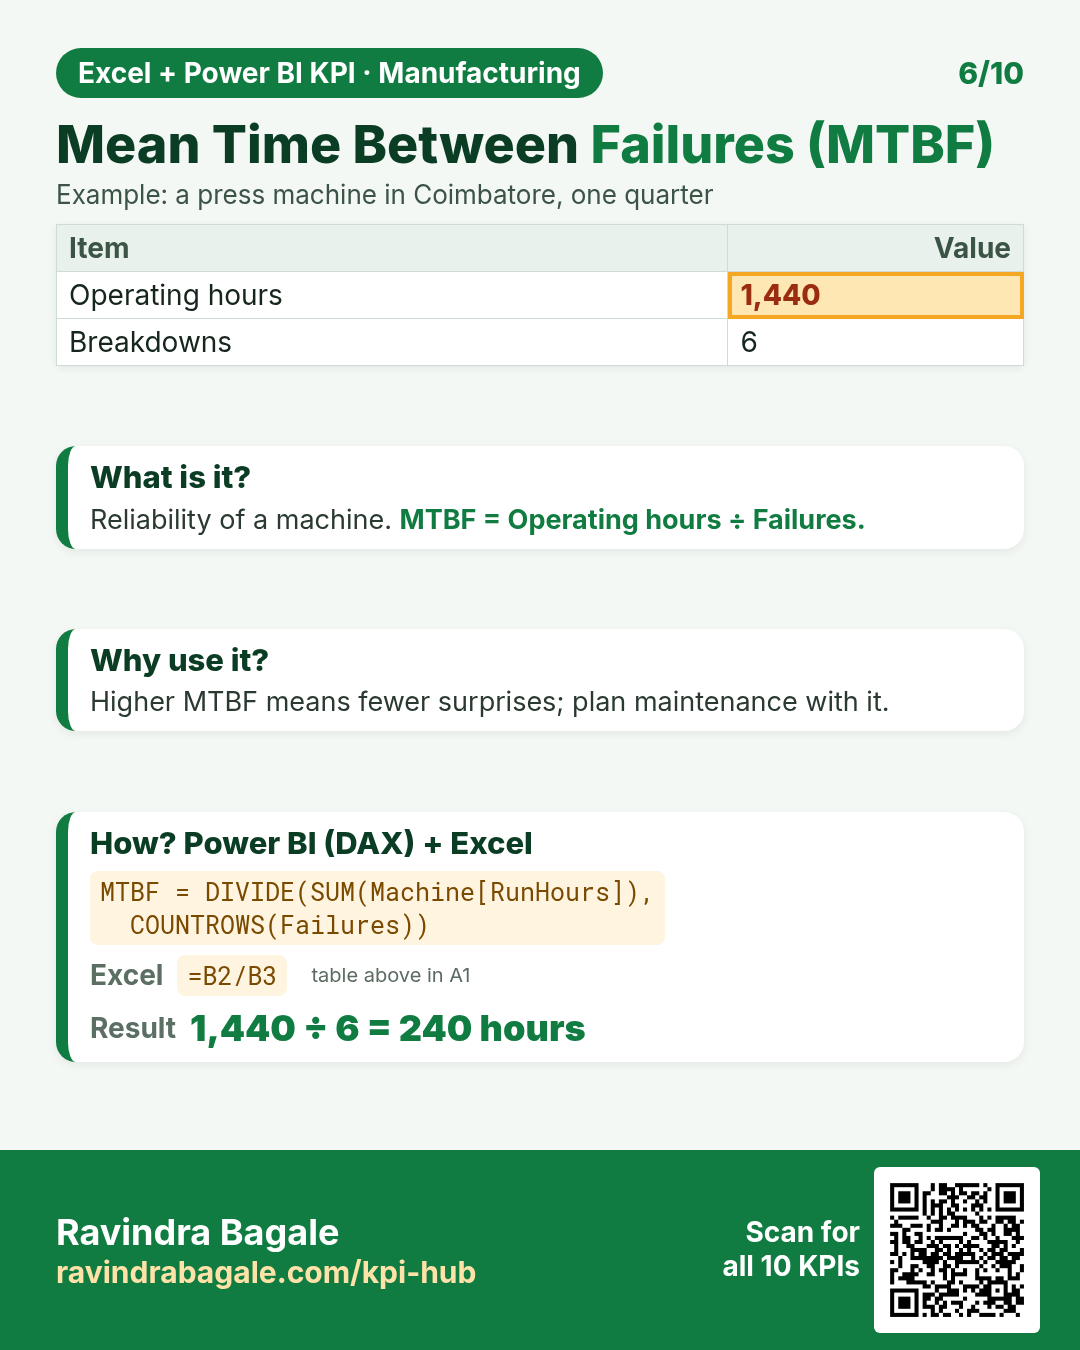
DAX: MTBF = DIVIDE(SUM(Machine[RunHours]), COUNTROWS(Failures))Excel: =B2/B3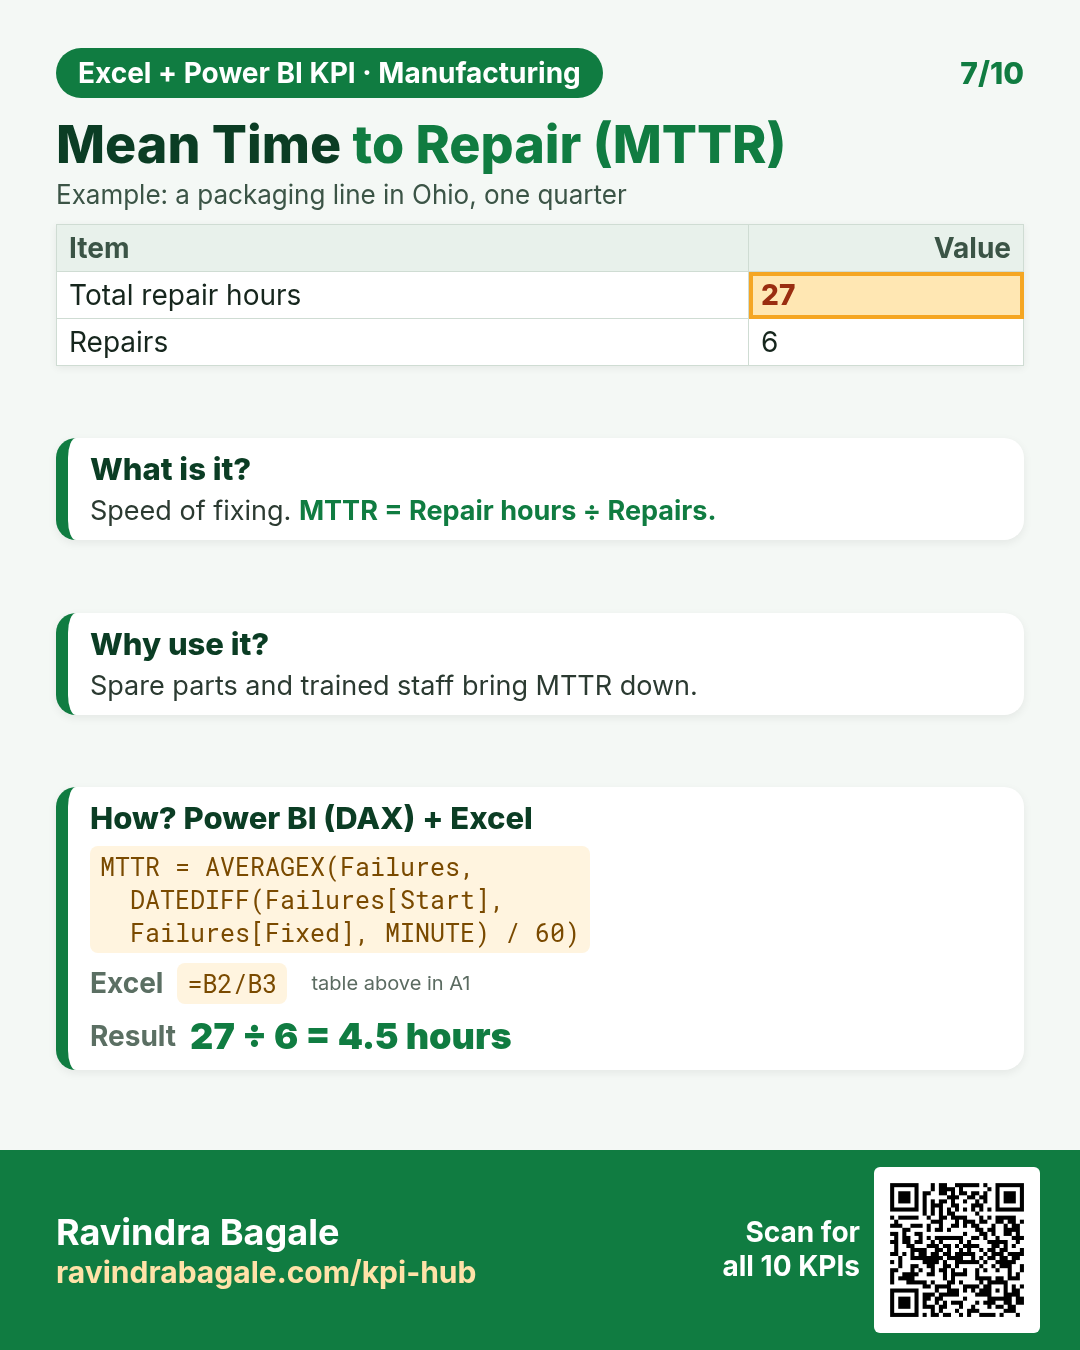
DAX: MTTR = AVERAGEX(Failures, DATEDIFF(Failures[Start], Failures[Fixed], MINUTE) / 60)Excel: =B2/B3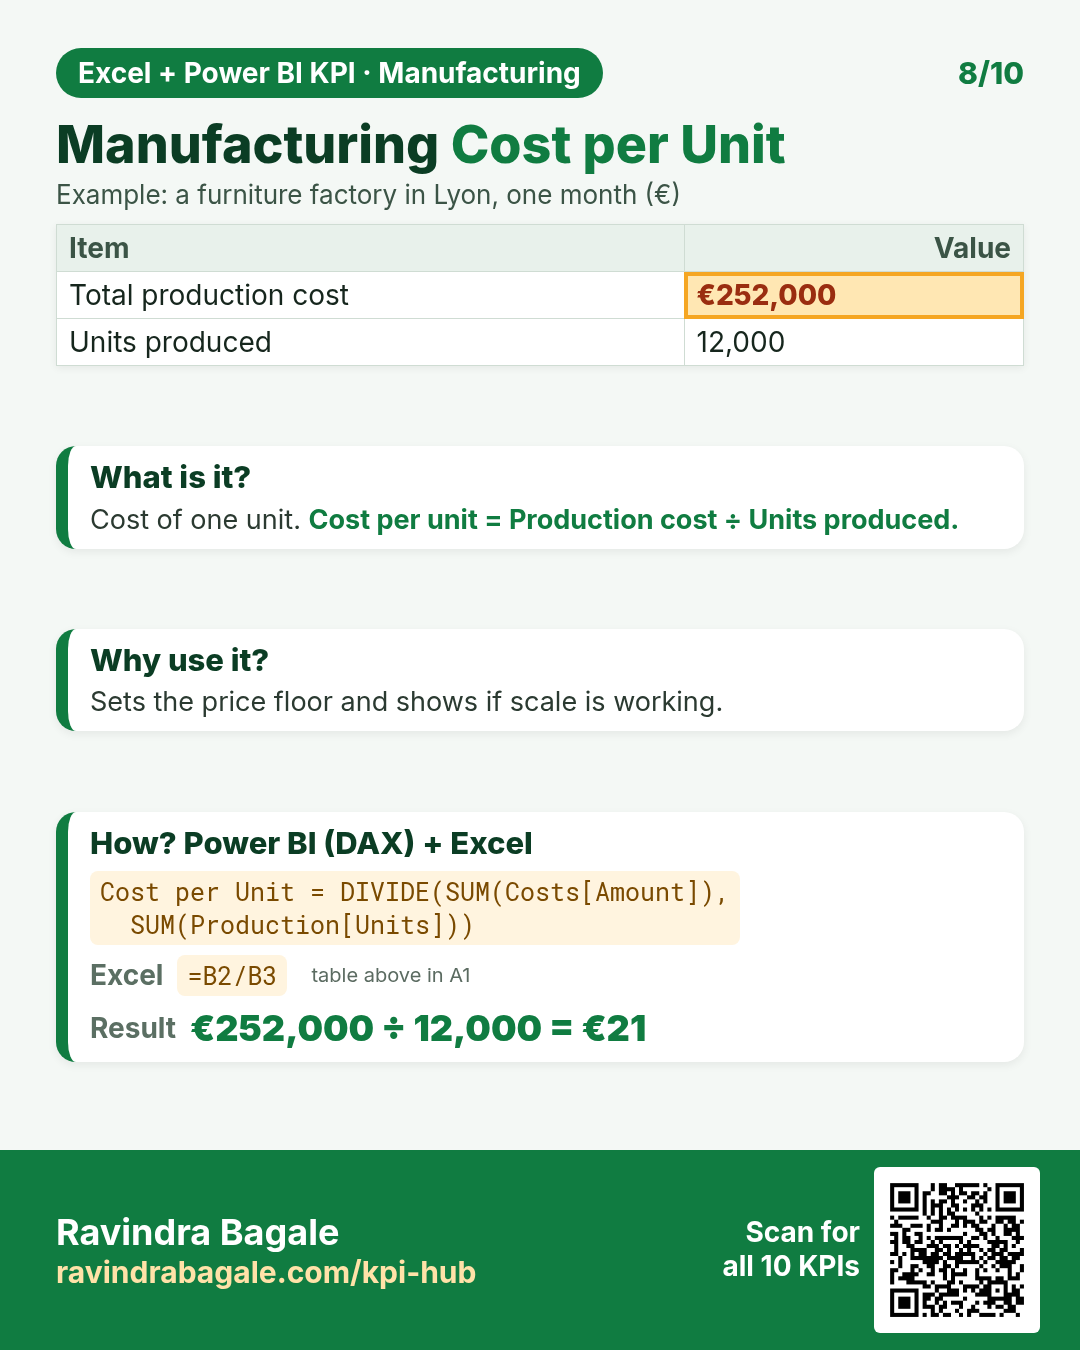
DAX: Cost per Unit = DIVIDE(SUM(Costs[Amount]), SUM(Production[Units]))Excel: =B2/B3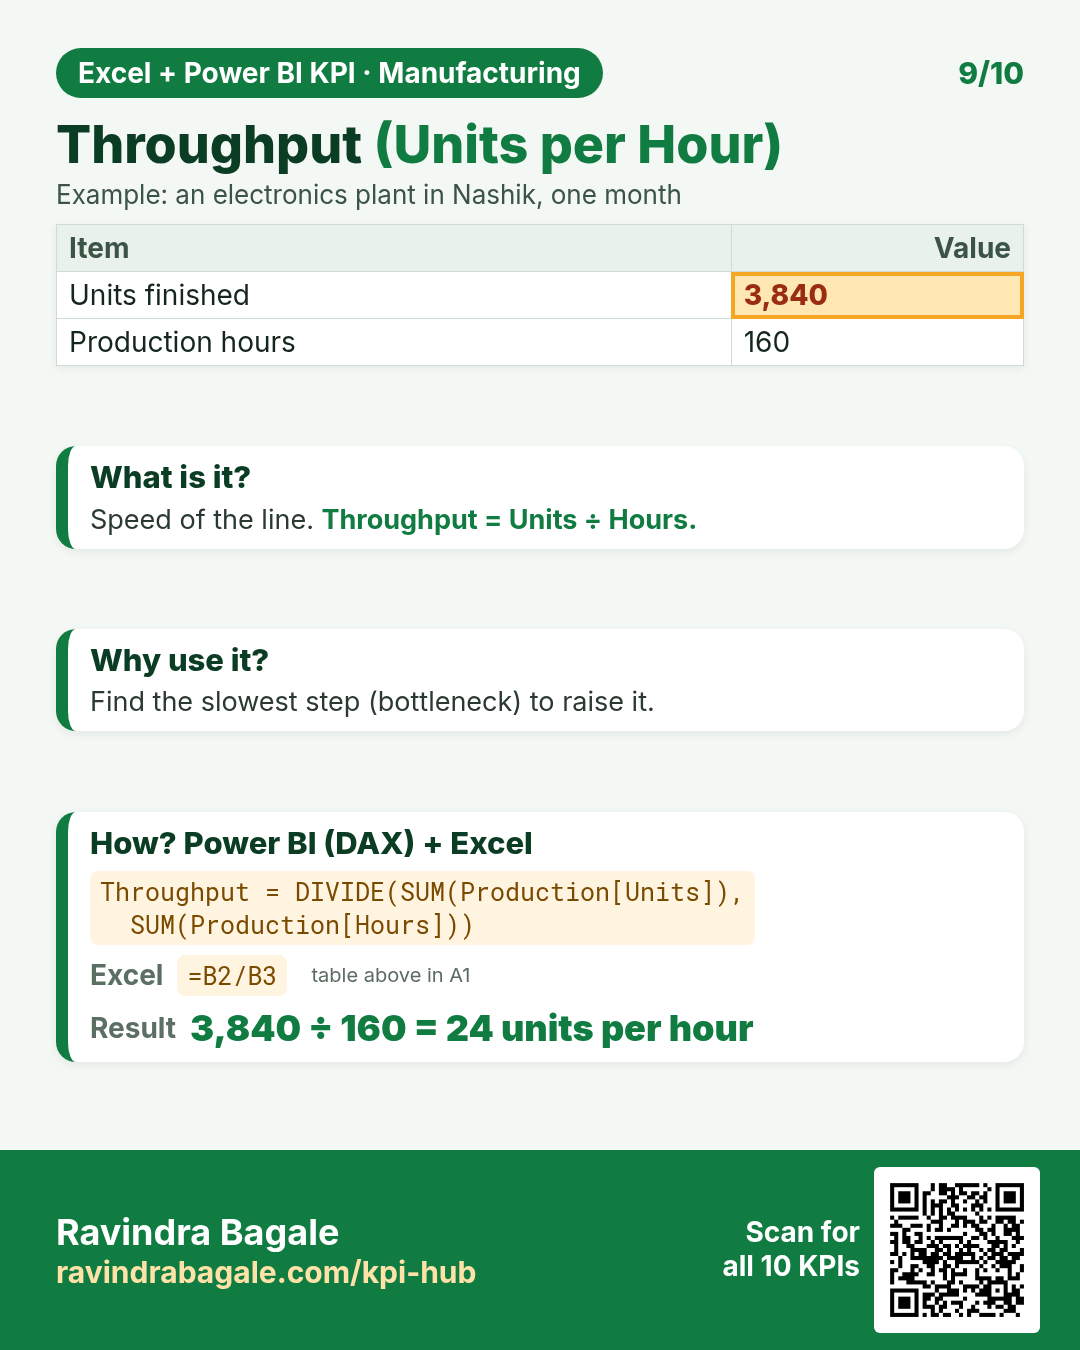
DAX: Throughput = DIVIDE(SUM(Production[Units]), SUM(Production[Hours]))Excel: =B2/B3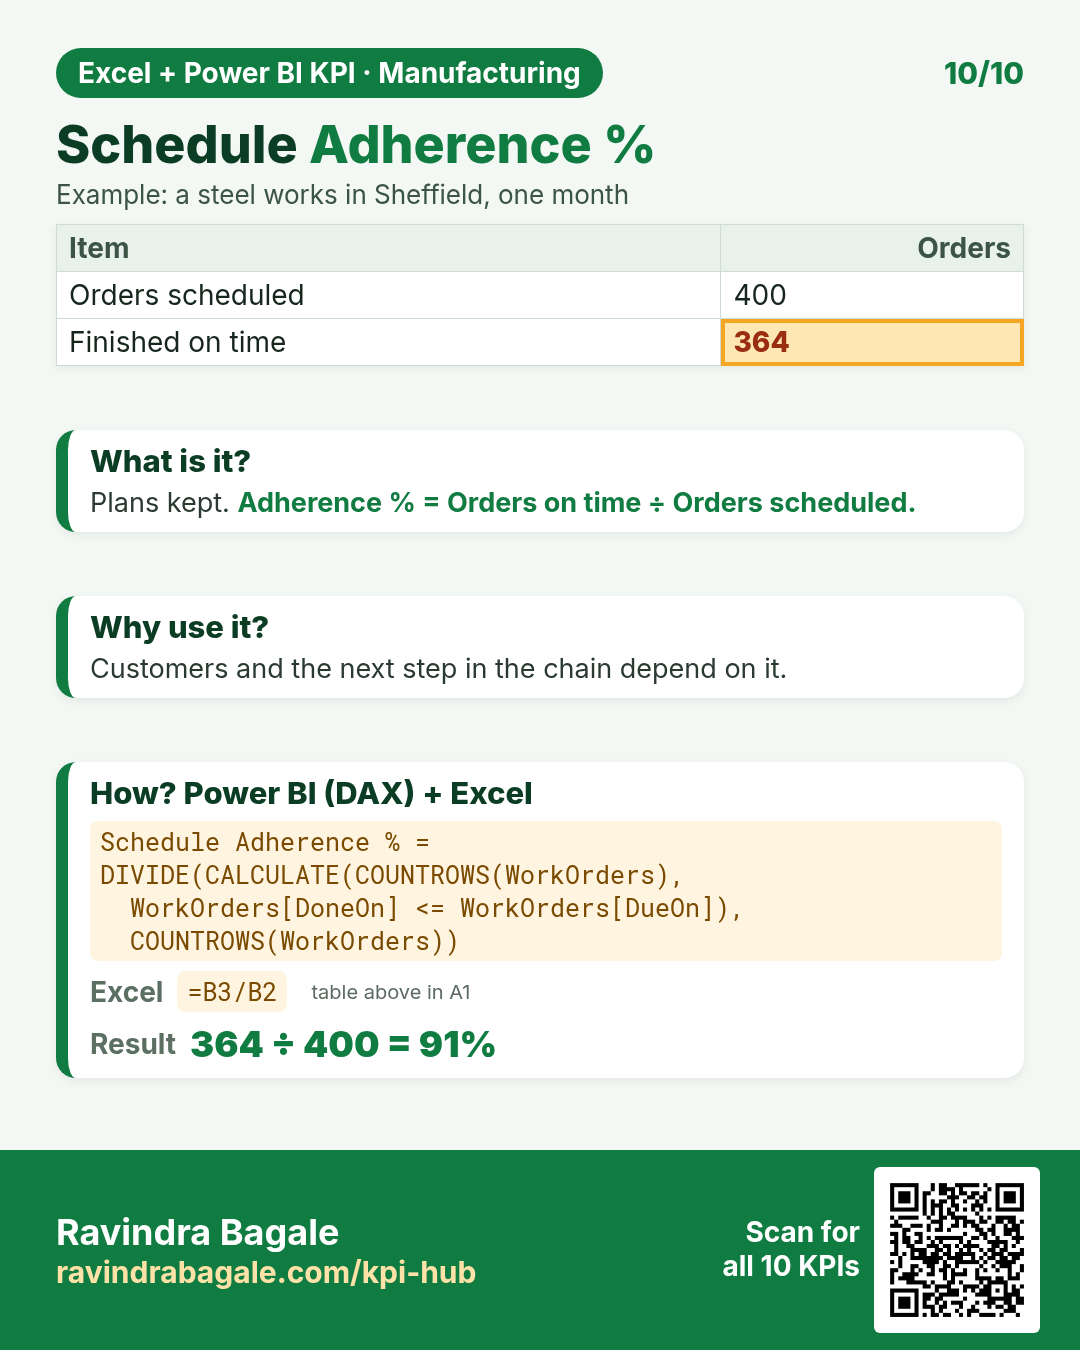
DAX: Schedule Adherence % = DIVIDE(CALCULATE(COUNTROWS(WorkOrders), WorkOrders[DoneOn] <= WorkOrders[DueOn]), COUNTROWS(WorkOrders))Excel: =B3/B2Quick quiz
1. Overall Equipment Effectiveness (OEE): Planned time (min) 480, Run time (min) 432, Ideal cycle time (min per unit) 1, Units made 400, Good units 380. The answer is…
2. First Pass Yield %: Units made 2,500, Passed first inspection 2,350. The answer is…
3. Scrap Rate %: Units produced 3,600, Units scrapped 54. The answer is…
4. Which KPI means: “Share of possible output actually produced.”