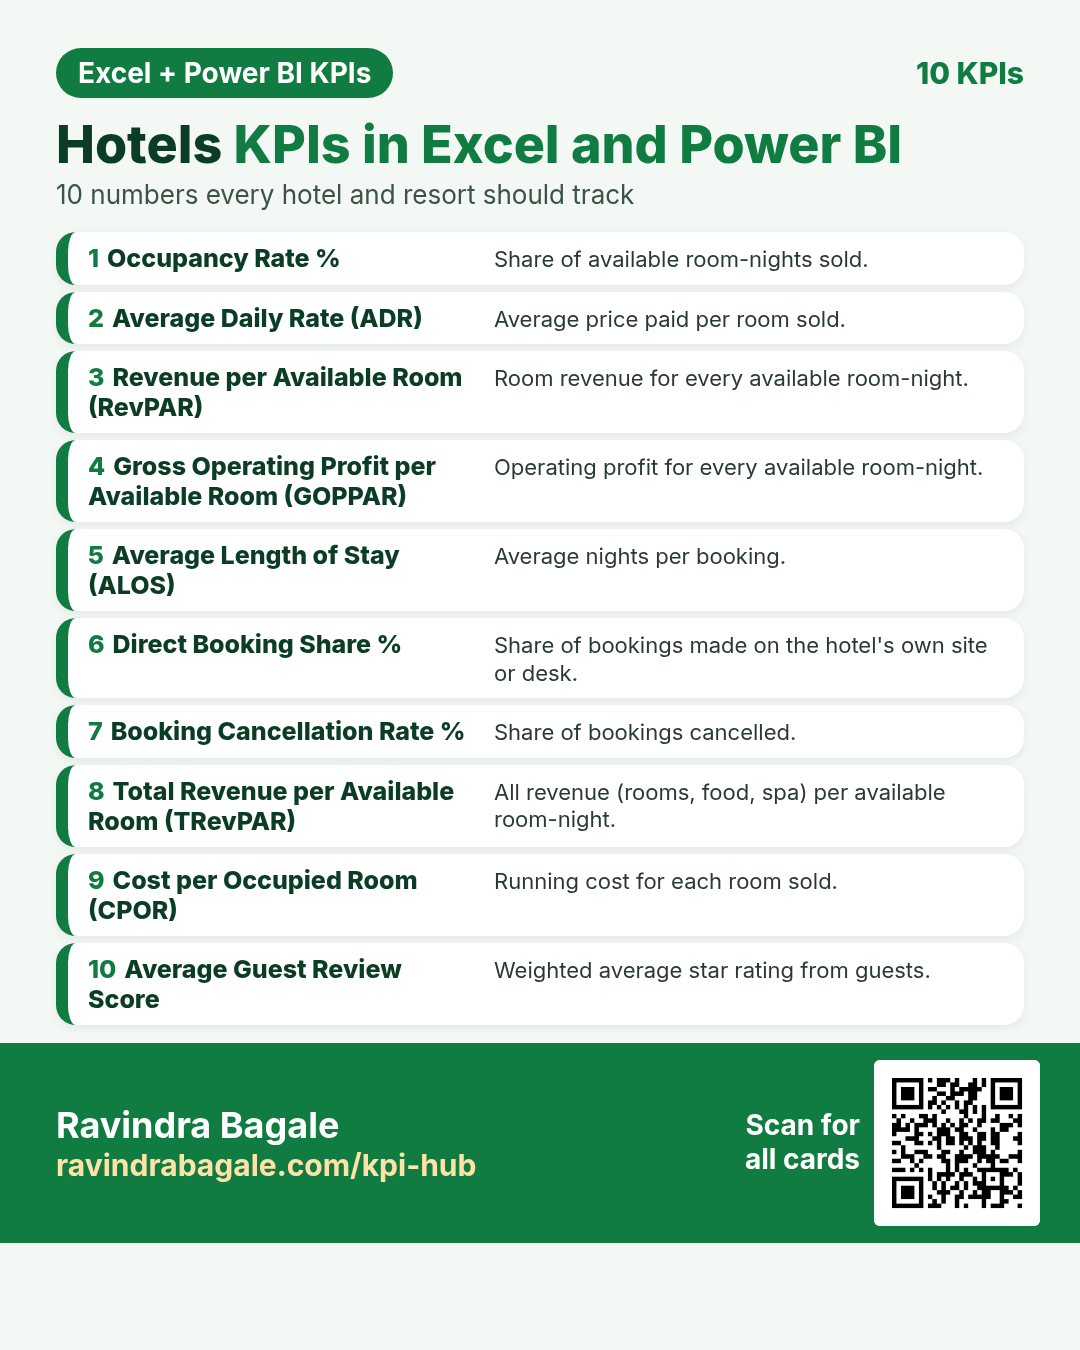
Hotels KPIs in Excel and Power BI
Ten important KPIs for hotel and resort. Each card has what it is, why it matters, the Excel formula, the DAX measure and a tiny worked example. Every card shows the Excel formula next to the Power BI DAX measure. For Excel, put the card’s example table in cell A1 (labels in column A, numbers in column B).
About this data: All examples are made-up teaching numbers for hotels in Goa, Edinburgh, Miami, Vienna, Udaipur, Bath, Barcelona, Shimla, Seattle and Kochi, in ₹, £, $ and €. Table names (Bookings, Hotel, Revenue, Costs, Reviews) are sample names.
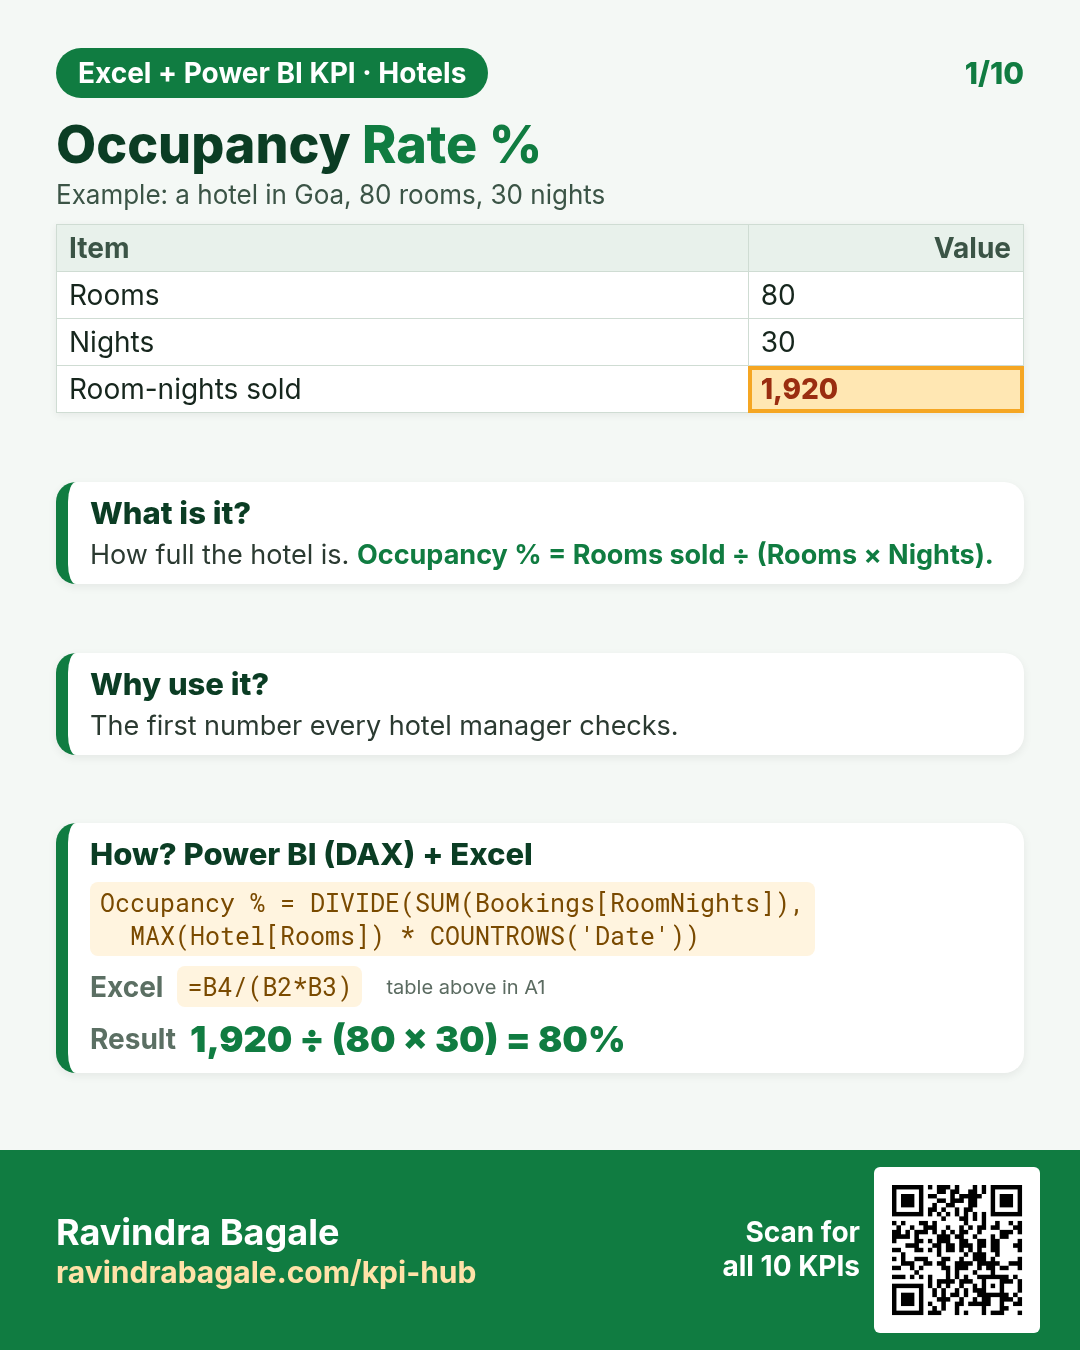
DAX: Occupancy % = DIVIDE(SUM(Bookings[RoomNights]), MAX(Hotel[Rooms]) * COUNTROWS('Date'))Excel: =B4/(B2*B3)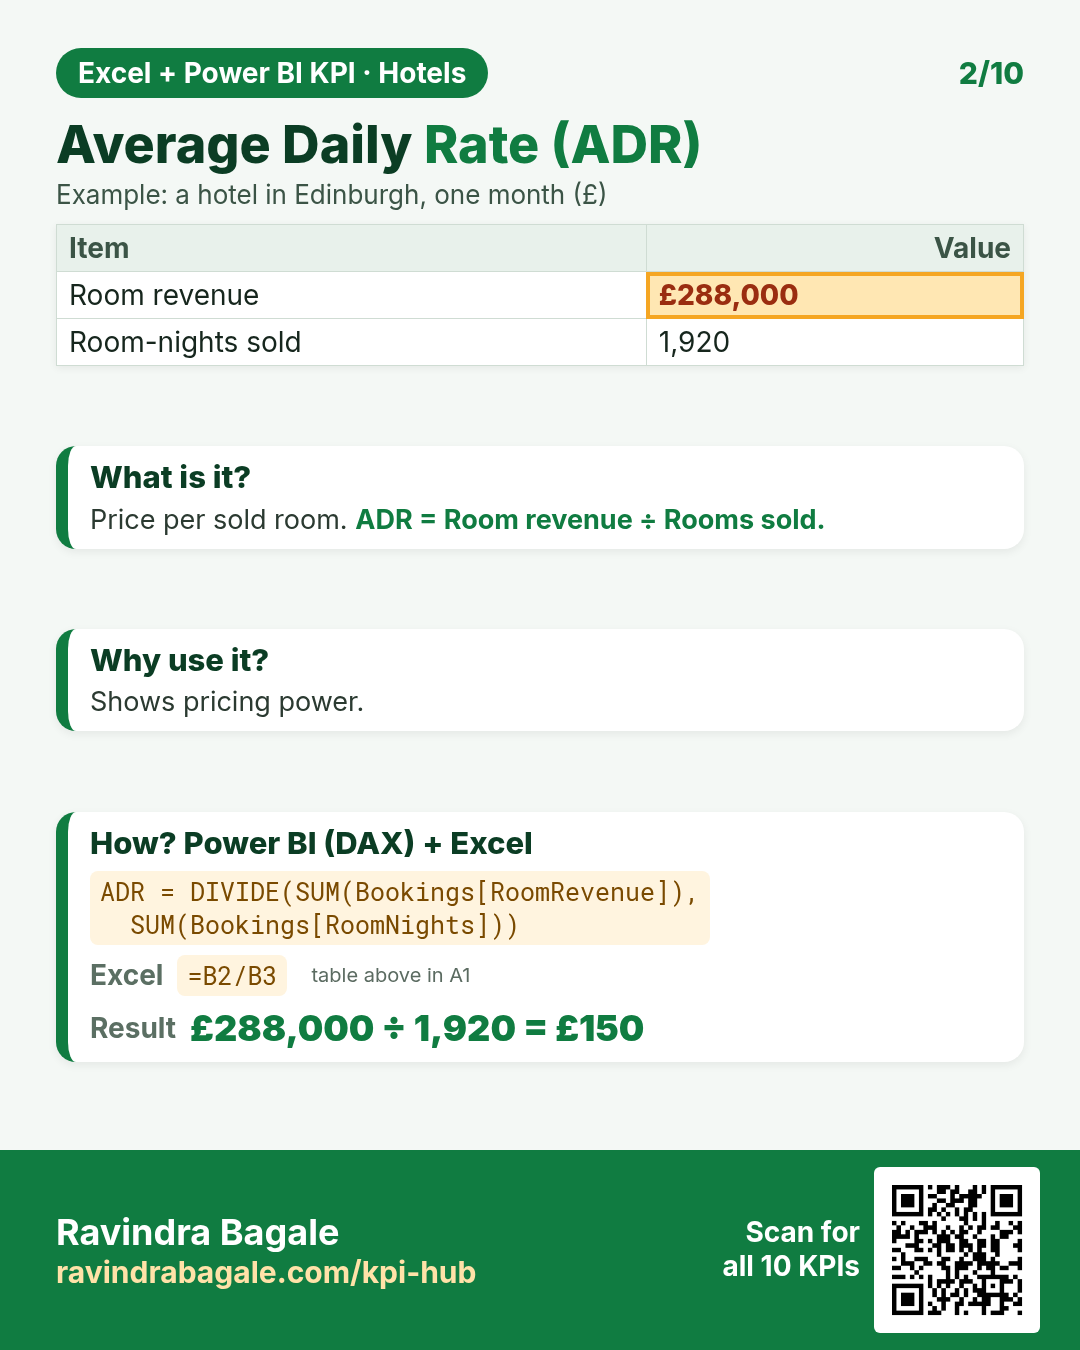
DAX: ADR = DIVIDE(SUM(Bookings[RoomRevenue]), SUM(Bookings[RoomNights]))Excel: =B2/B3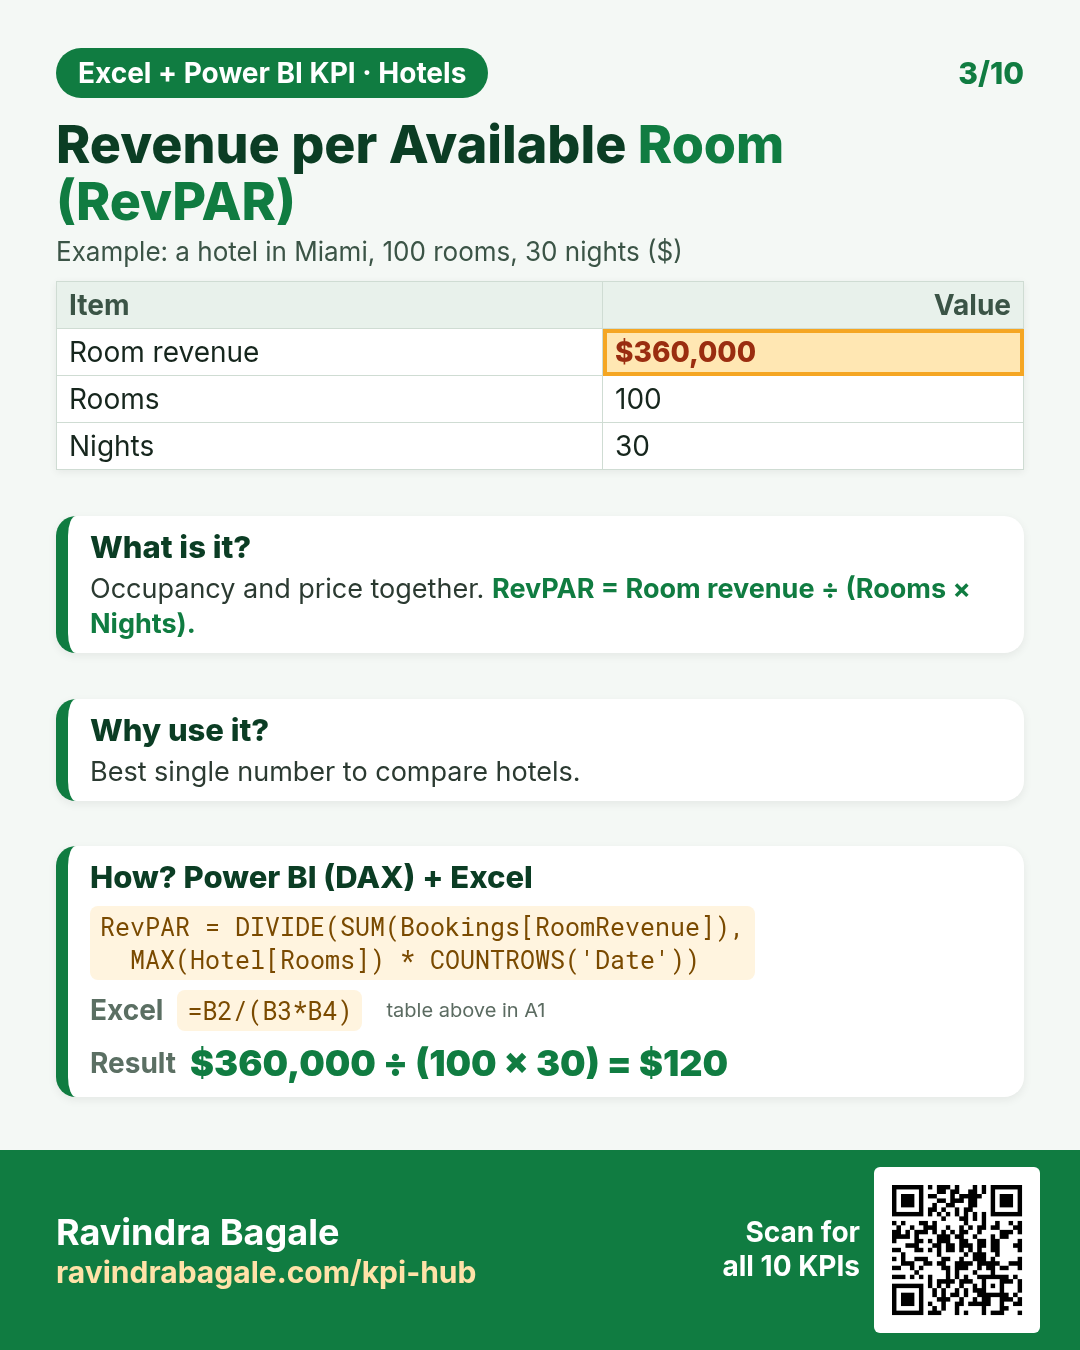
DAX: RevPAR = DIVIDE(SUM(Bookings[RoomRevenue]), MAX(Hotel[Rooms]) * COUNTROWS('Date'))Excel: =B2/(B3*B4)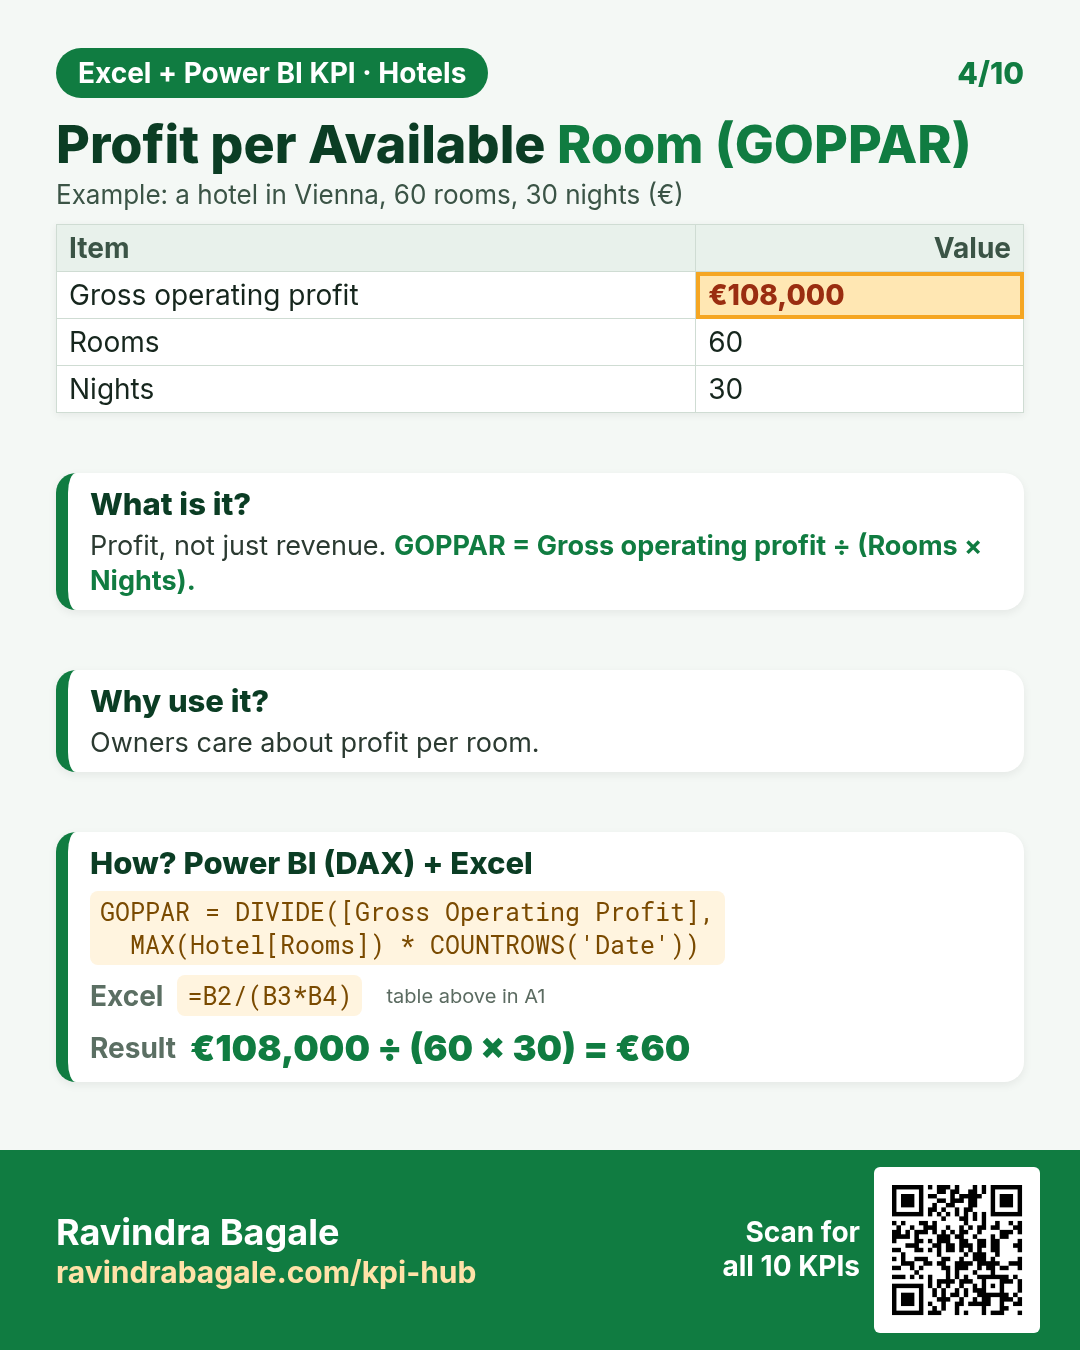
DAX: GOPPAR = DIVIDE([Gross Operating Profit], MAX(Hotel[Rooms]) * COUNTROWS('Date'))Excel: =B2/(B3*B4)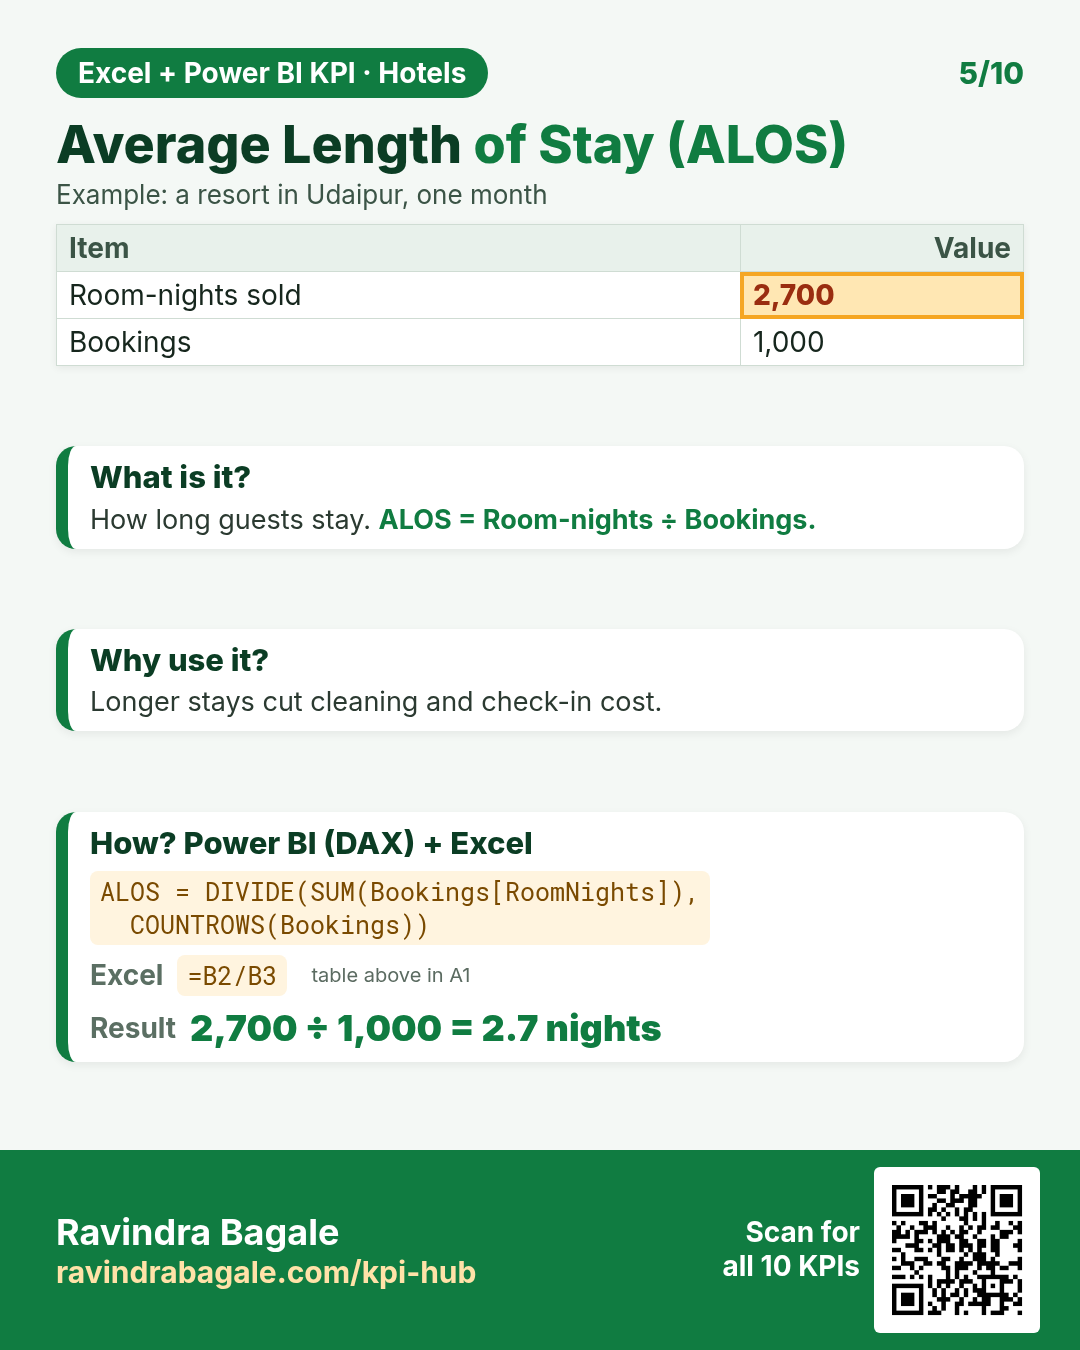
DAX: ALOS = DIVIDE(SUM(Bookings[RoomNights]), COUNTROWS(Bookings))Excel: =B2/B3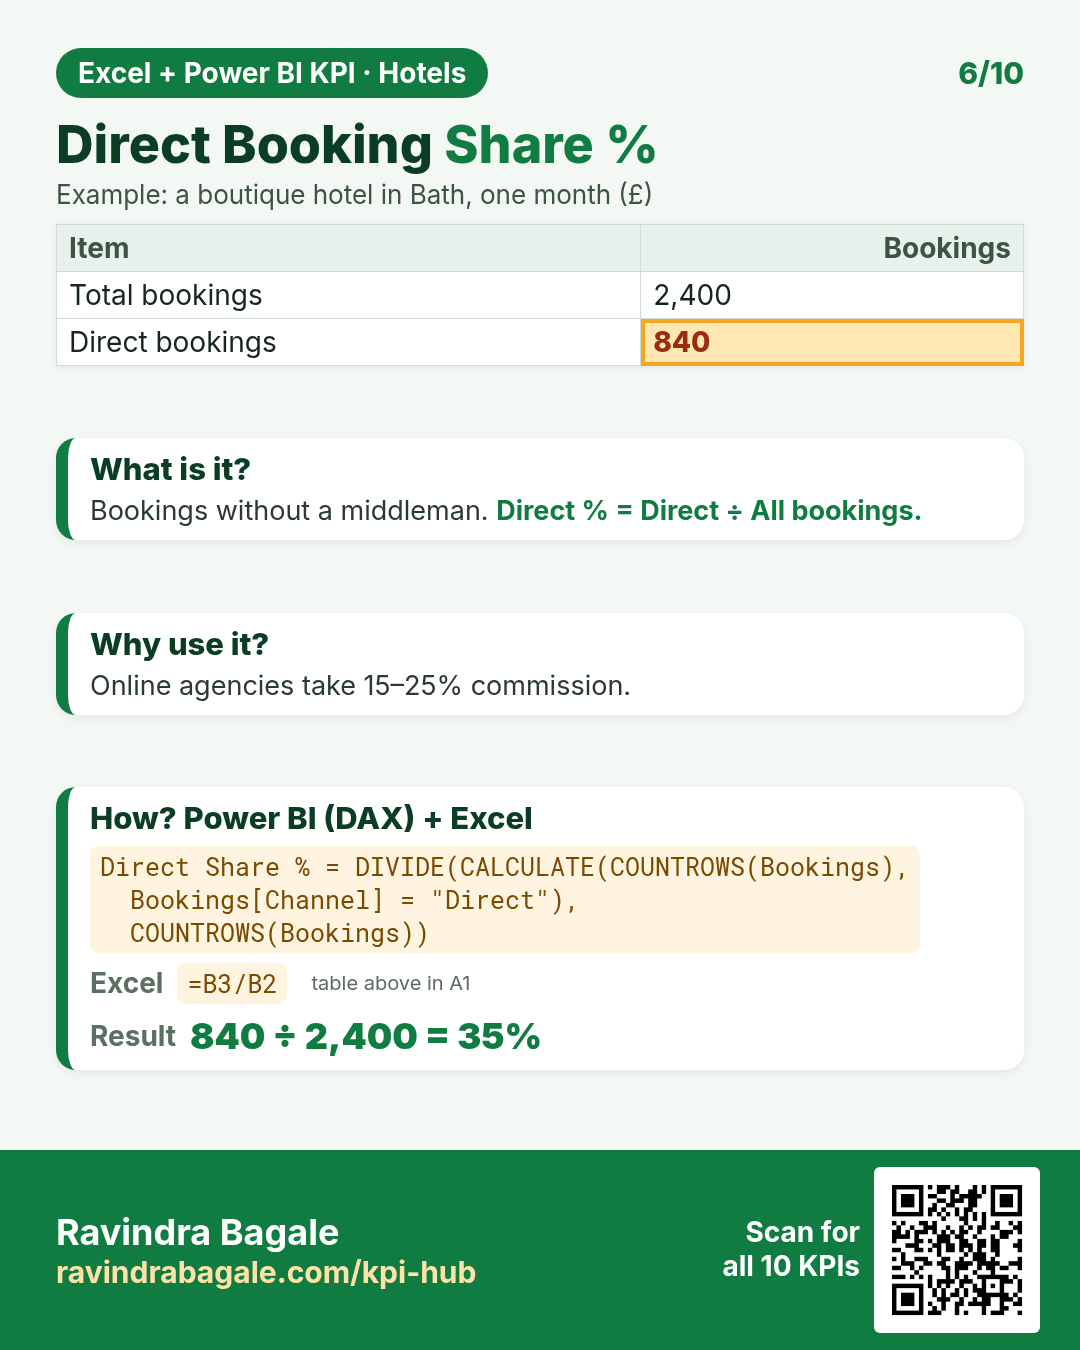
DAX: Direct Share % = DIVIDE(CALCULATE(COUNTROWS(Bookings), Bookings[Channel] = "Direct"), COUNTROWS(Bookings))Excel: =B3/B2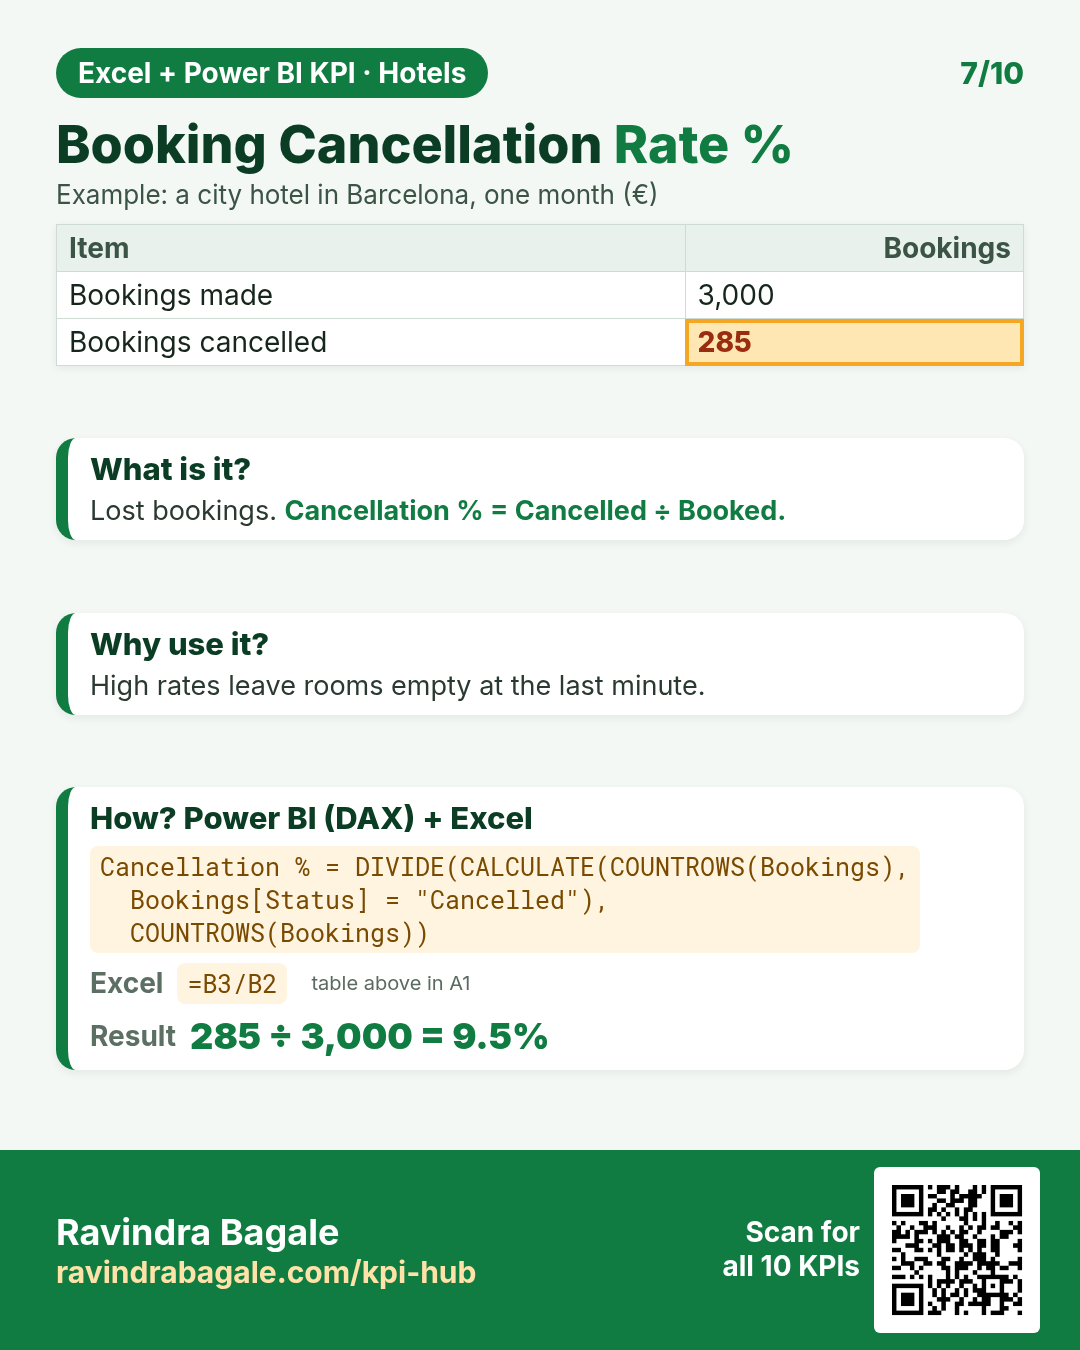
DAX: Cancellation % = DIVIDE(CALCULATE(COUNTROWS(Bookings), Bookings[Status] = "Cancelled"), COUNTROWS(Bookings))Excel: =B3/B2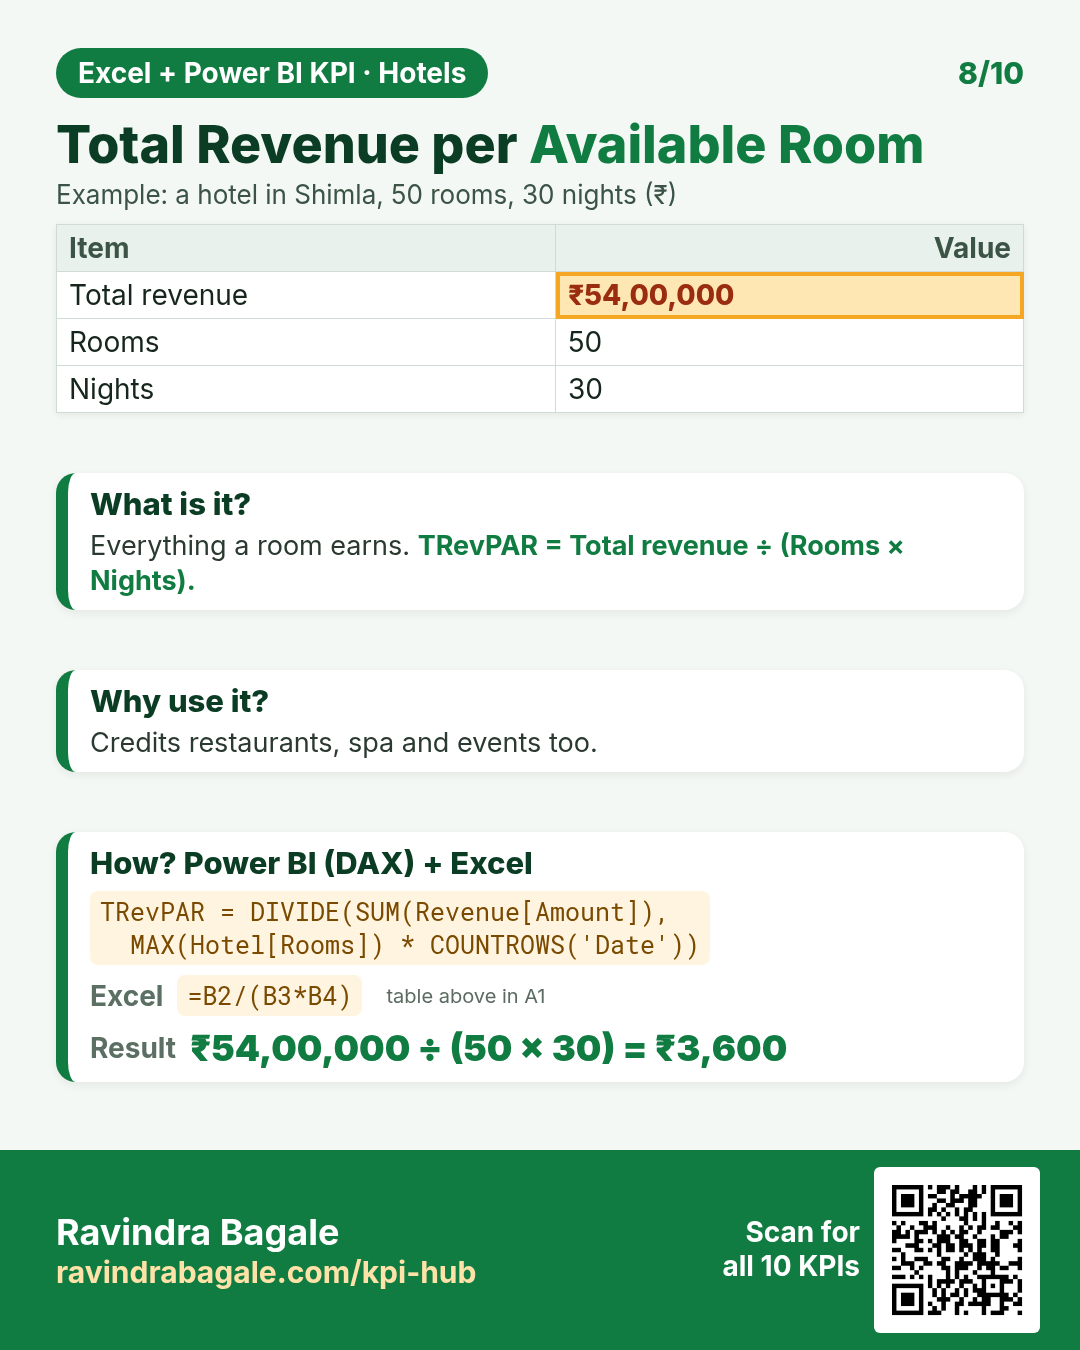
DAX: TRevPAR = DIVIDE(SUM(Revenue[Amount]), MAX(Hotel[Rooms]) * COUNTROWS('Date'))Excel: =B2/(B3*B4)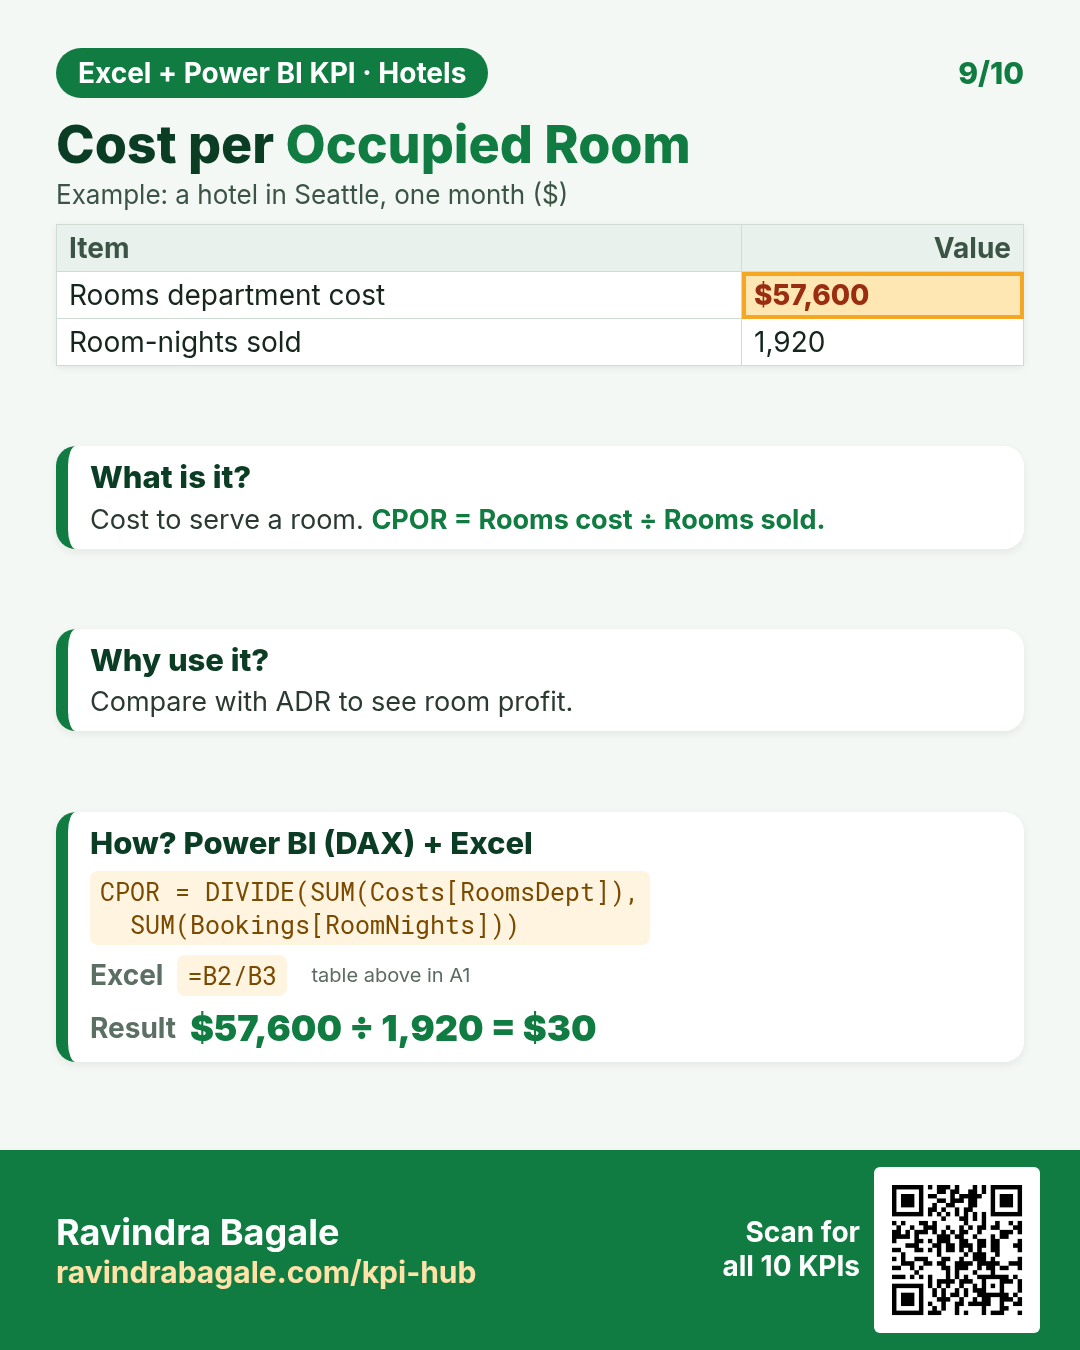
DAX: CPOR = DIVIDE(SUM(Costs[RoomsDept]), SUM(Bookings[RoomNights]))Excel: =B2/B3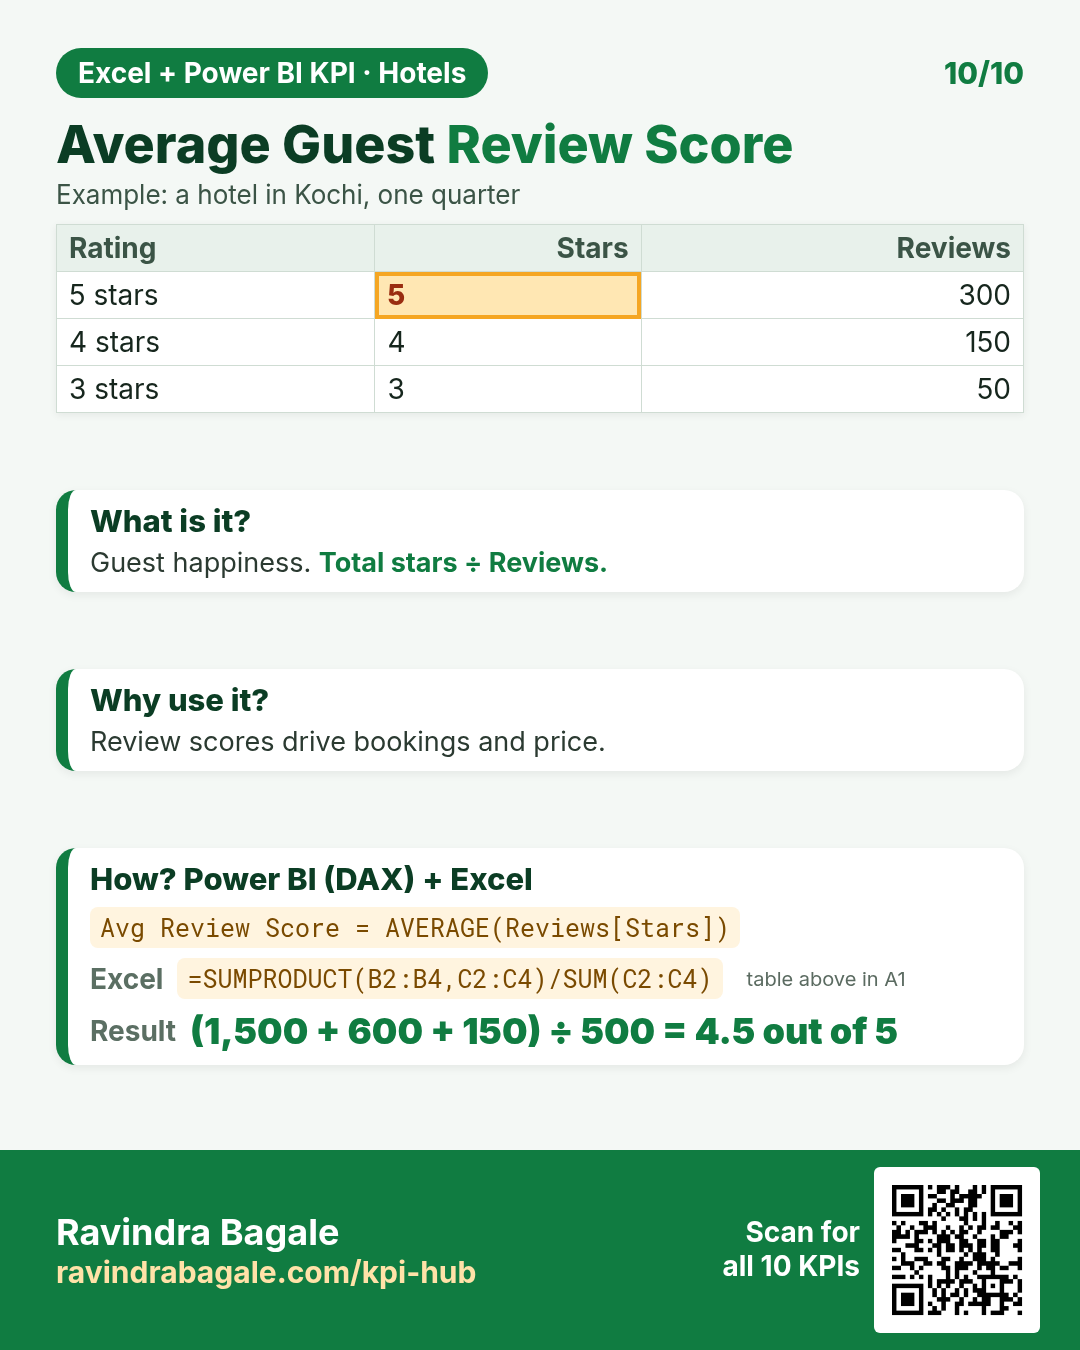
DAX: Avg Review Score = AVERAGE(Reviews[Stars])Excel: =SUMPRODUCT(B2:B4,C2:C4)/SUM(C2:C4)Quick quiz
1. Occupancy Rate %: Rooms 80, Nights 30, Room-nights sold 1,920. The answer is…
2. Average Daily Rate (ADR): Room revenue £288,000, Room-nights sold 1,920. The answer is…
3. Revenue per Available Room (RevPAR): Room revenue $360,000, Rooms 100, Nights 30. The answer is…
4. Which KPI means: “Operating profit for every available room-night.”