Retail Store KPIs in Excel and Power BI
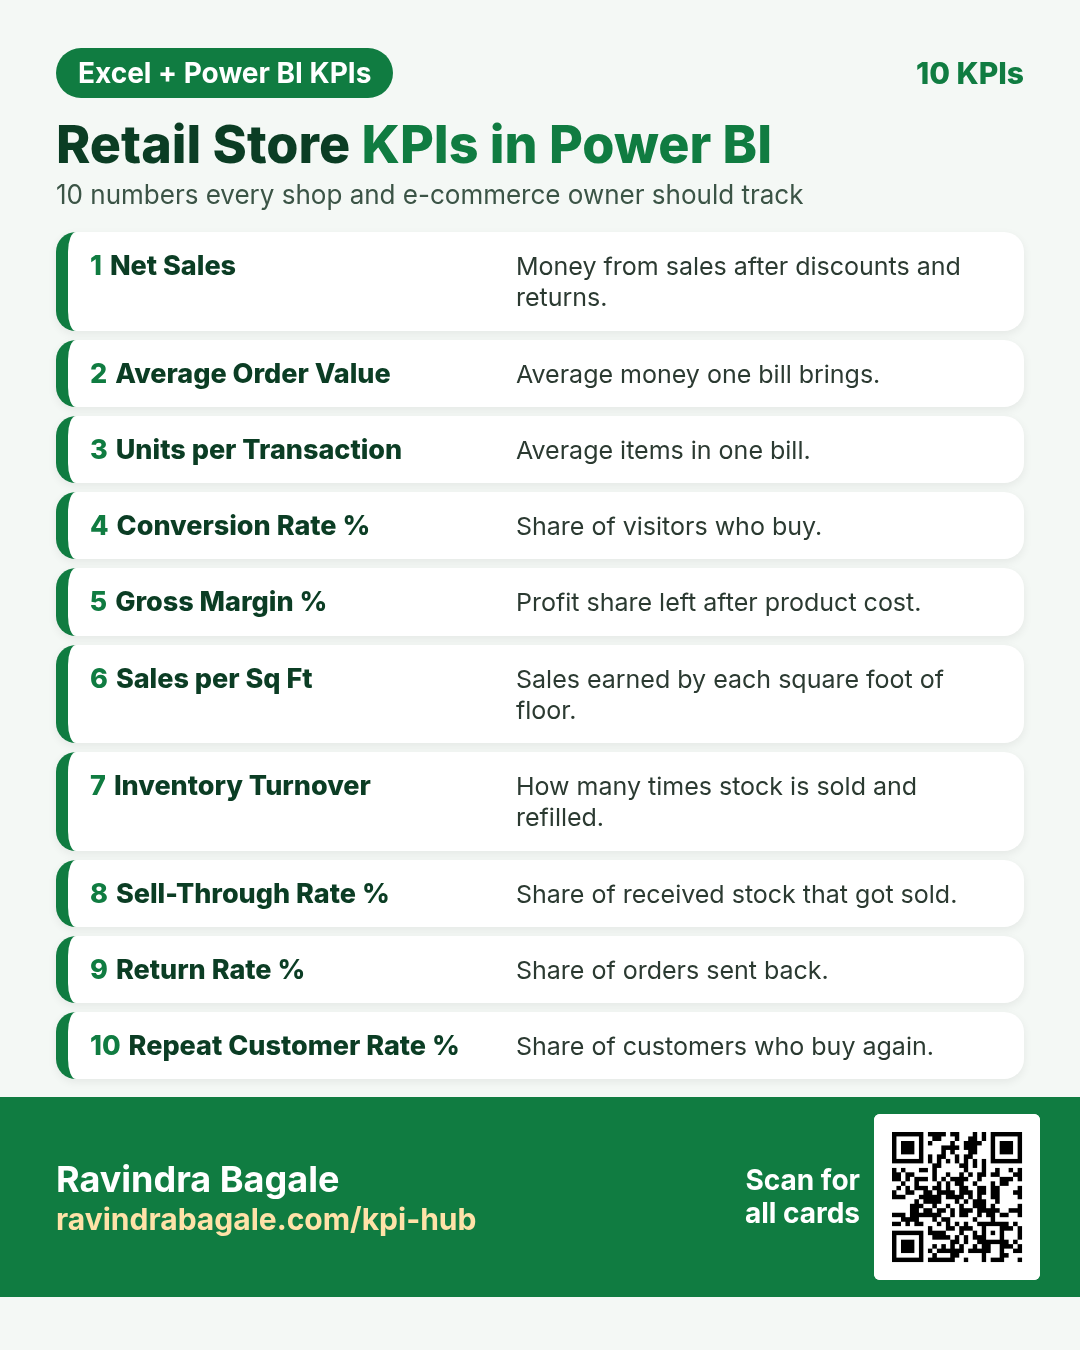
Ten important KPIs for a shop or online store. Each card has what it is, why it matters, the DAX measure and a tiny worked example. Every card shows the Excel formula next to the Power BI DAX measure. For Excel, put the card’s example table in cell A1 (labels in column A, numbers in column B).
About this data: All examples are made-up teaching numbers for shops in Mumbai, Leeds, Chennai, New York, Bengaluru, Dublin, Hyderabad, Toronto, Manchester and Pune, in ₹, £, $ and €. Table and column names (Sales, Traffic, Stock, Receipts, Returns, Store) are sample names; change them to match your model.
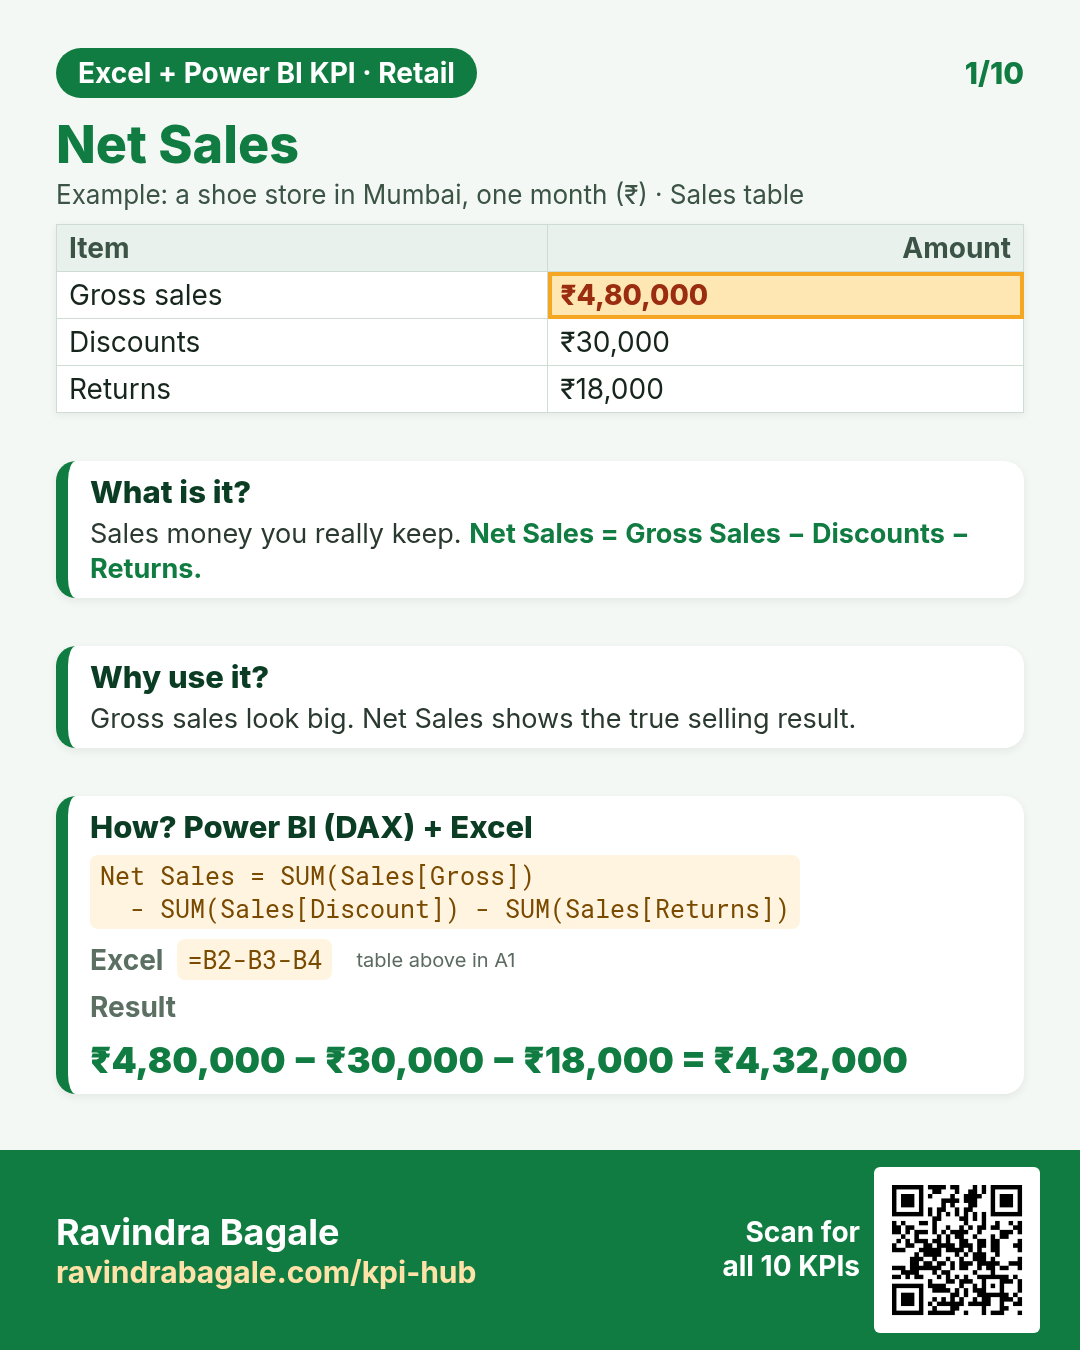
DAX: Net Sales = SUM(Sales[Gross]) - SUM(Sales[Discount]) - SUM(Sales[Returns])Excel: =B2-B3-B4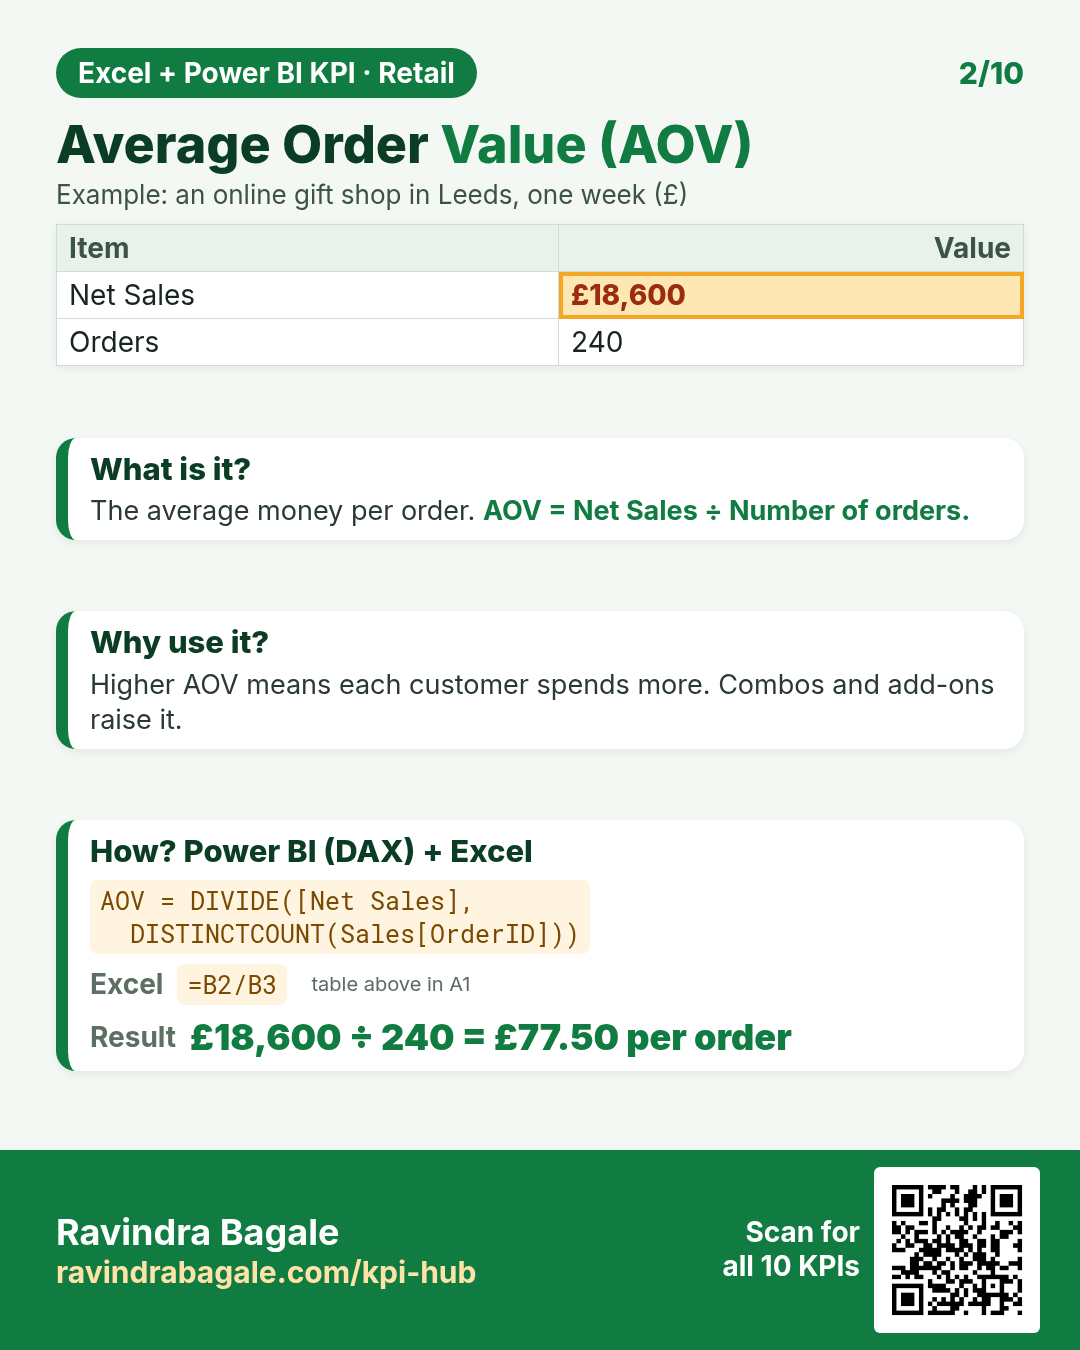
DAX: AOV = DIVIDE([Net Sales], DISTINCTCOUNT(Sales[OrderID]))Excel: =B2/B3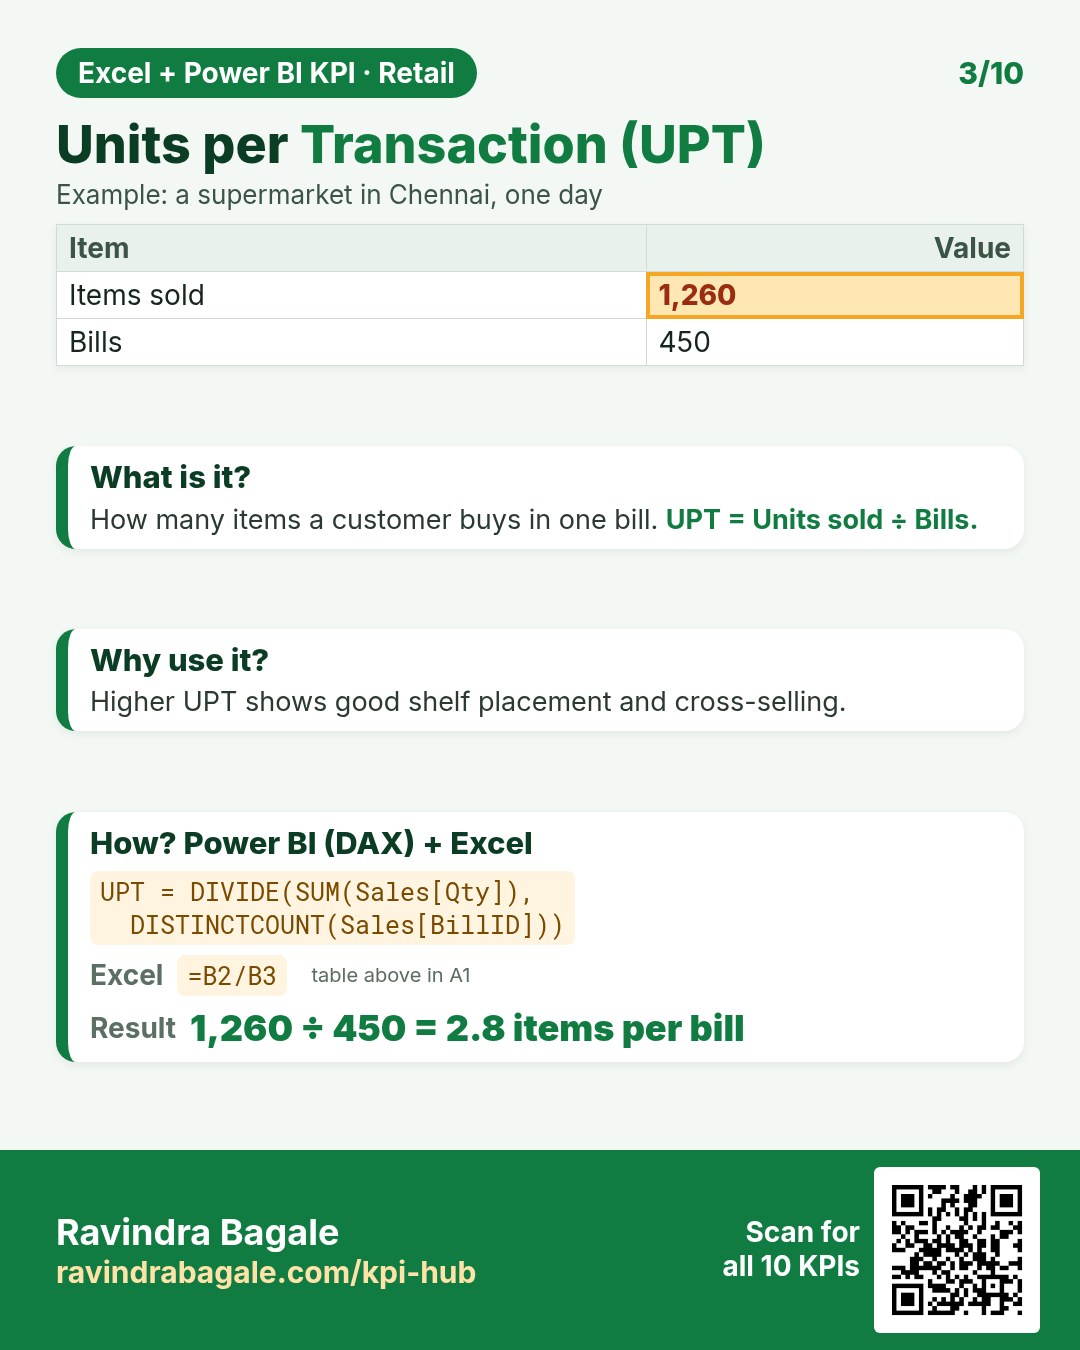
DAX: UPT = DIVIDE(SUM(Sales[Qty]), DISTINCTCOUNT(Sales[BillID]))Excel: =B2/B3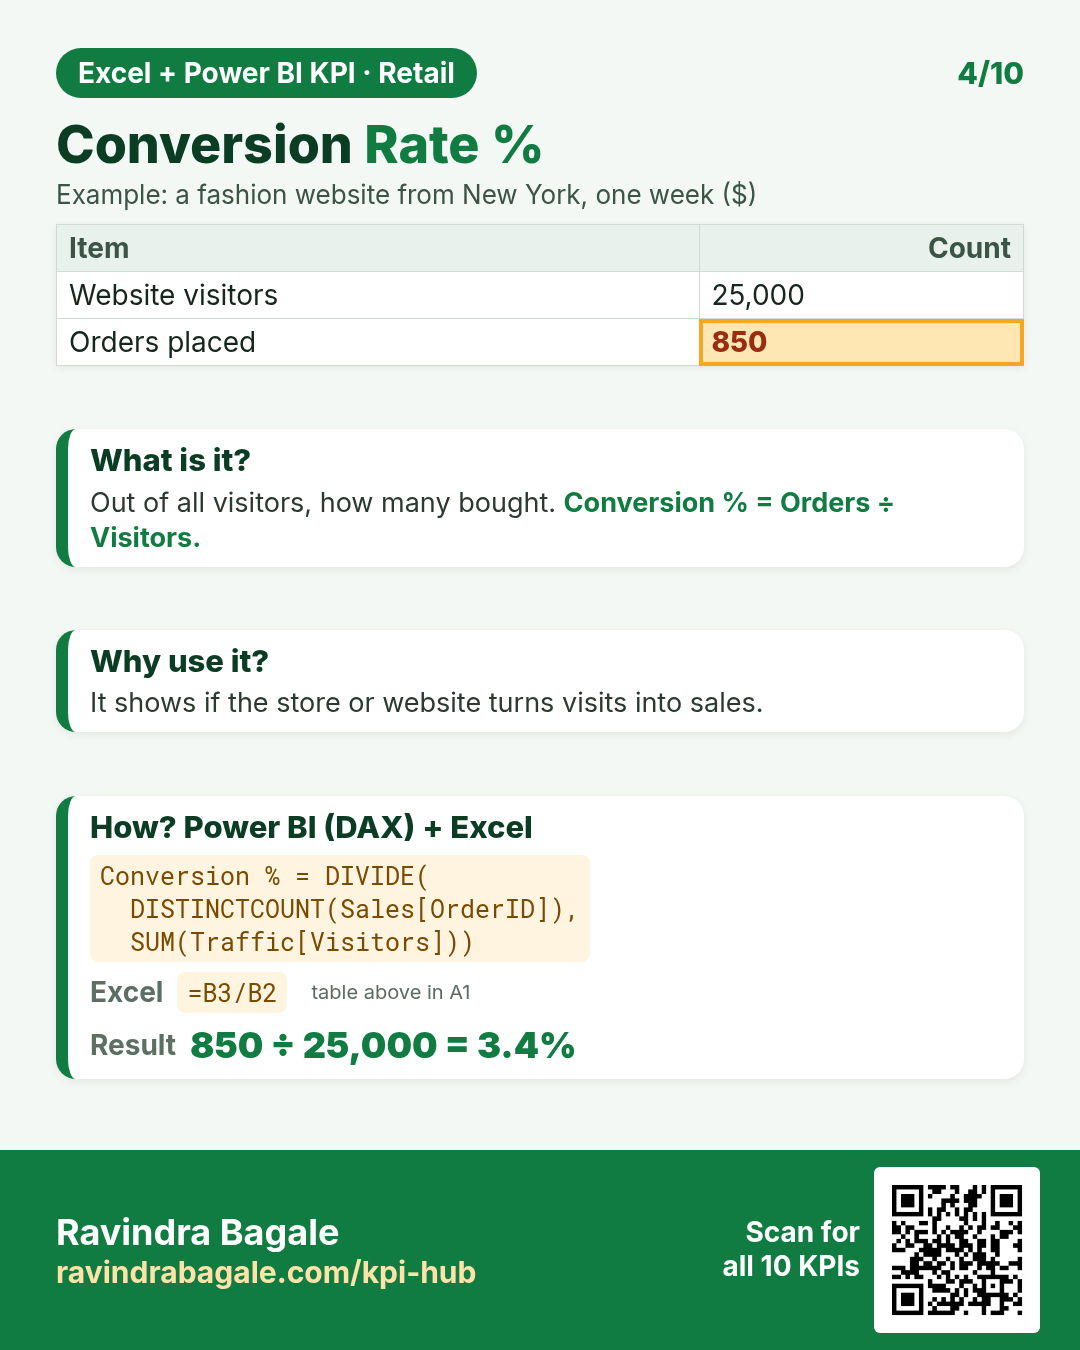
DAX: Conversion % = DIVIDE( DISTINCTCOUNT(Sales[OrderID]), SUM(Traffic[Visitors]))Excel: =B3/B2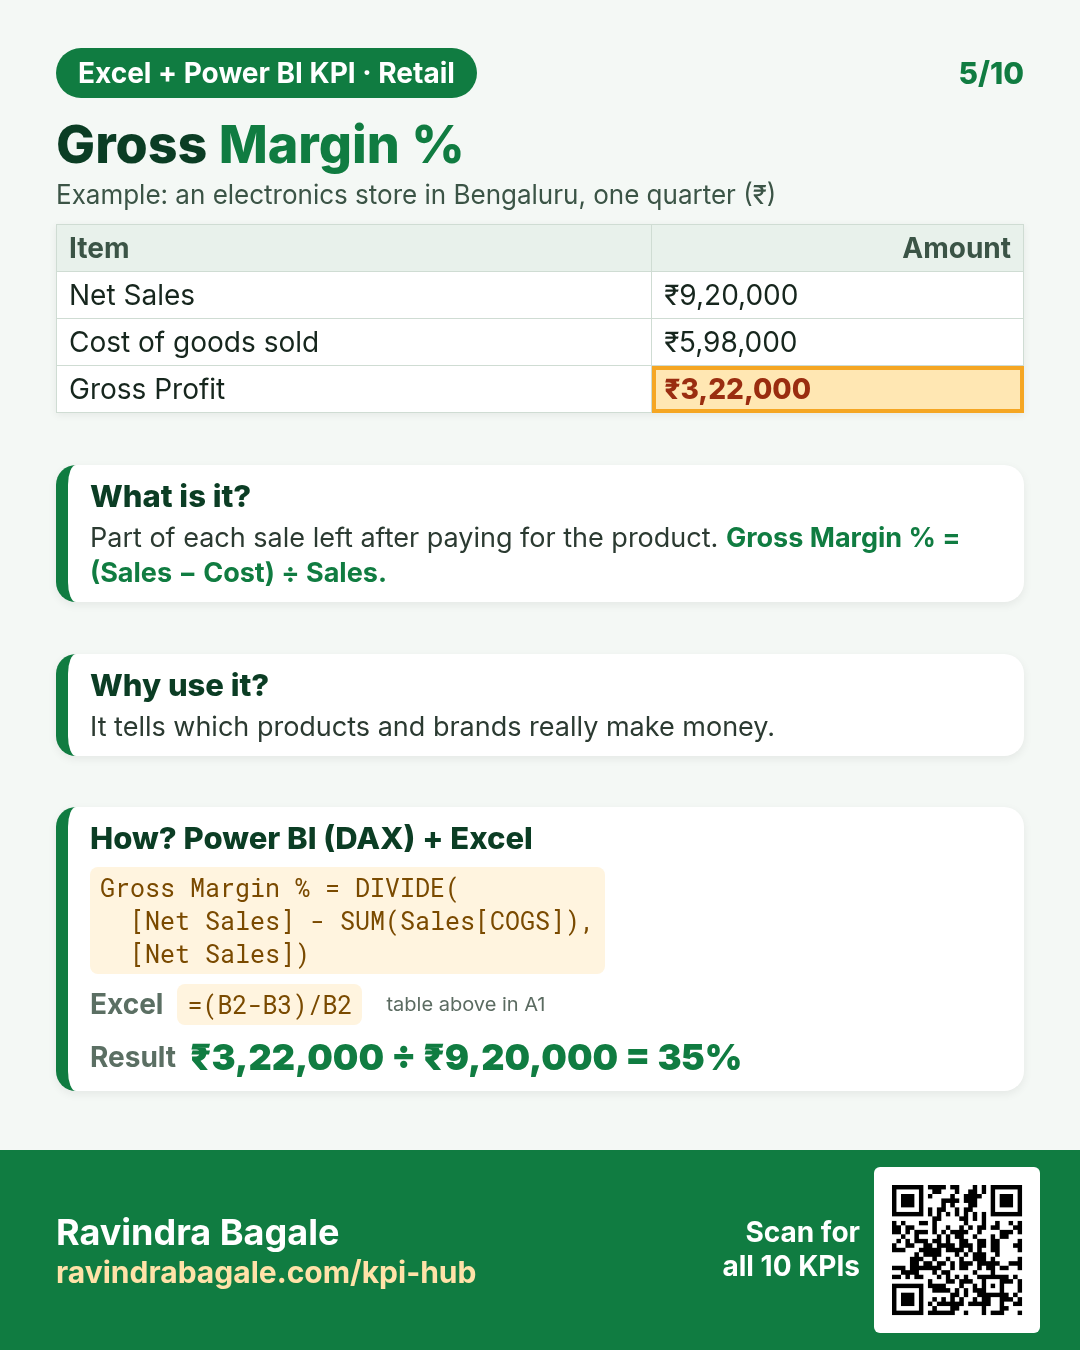
DAX: Gross Margin % = DIVIDE( [Net Sales] - SUM(Sales[COGS]), [Net Sales])Excel: =(B2-B3)/B2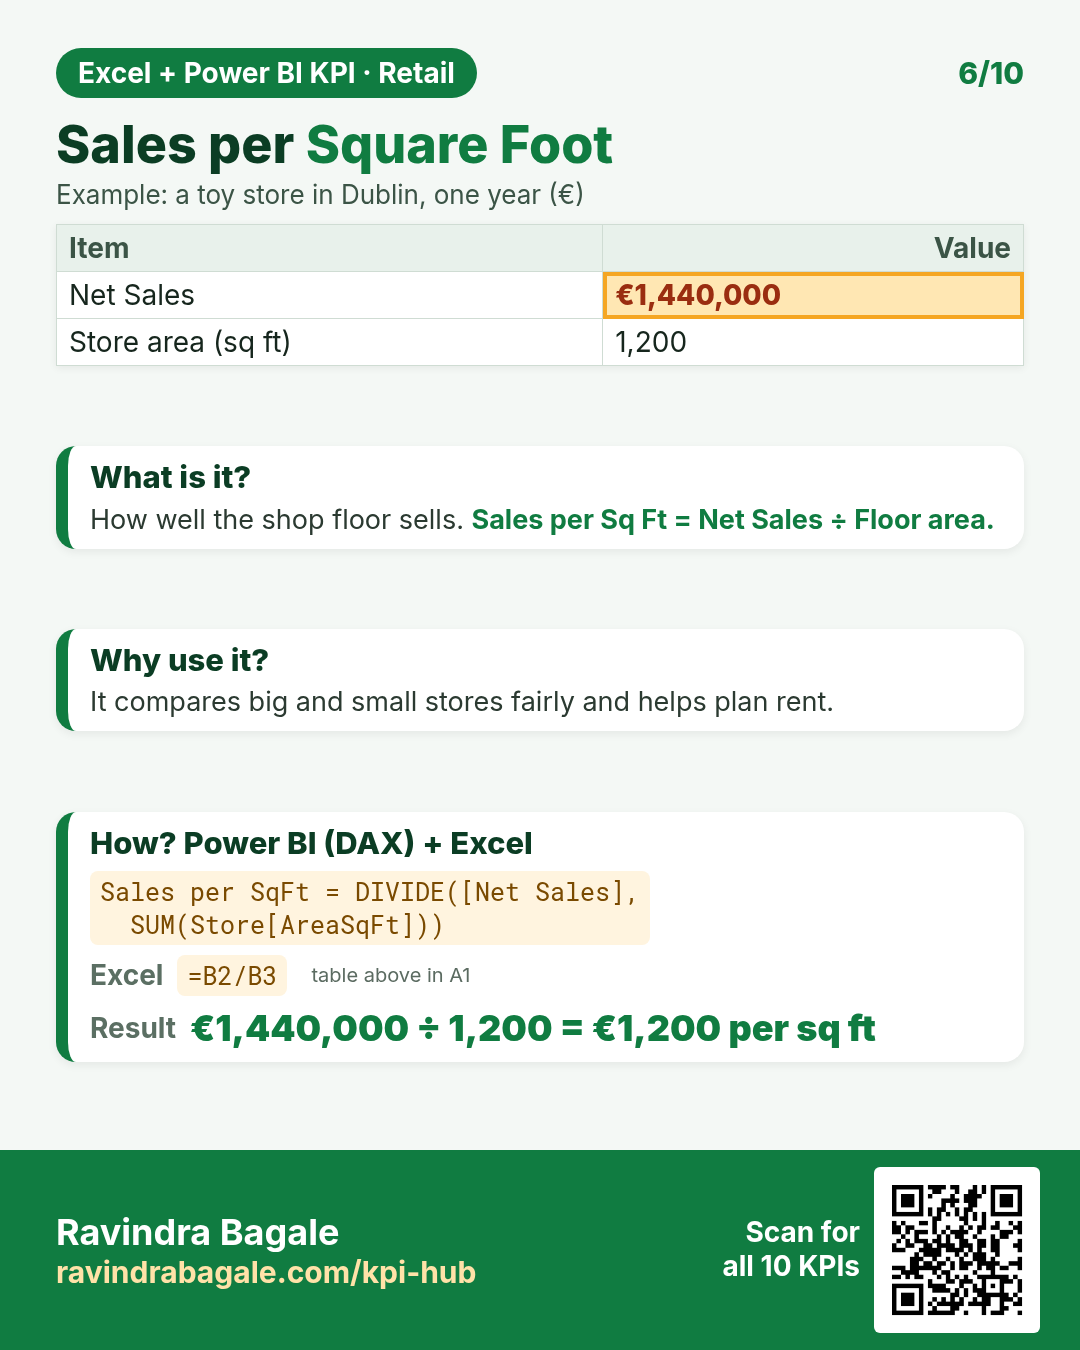
DAX: Sales per SqFt = DIVIDE([Net Sales], SUM(Store[AreaSqFt]))Excel: =B2/B3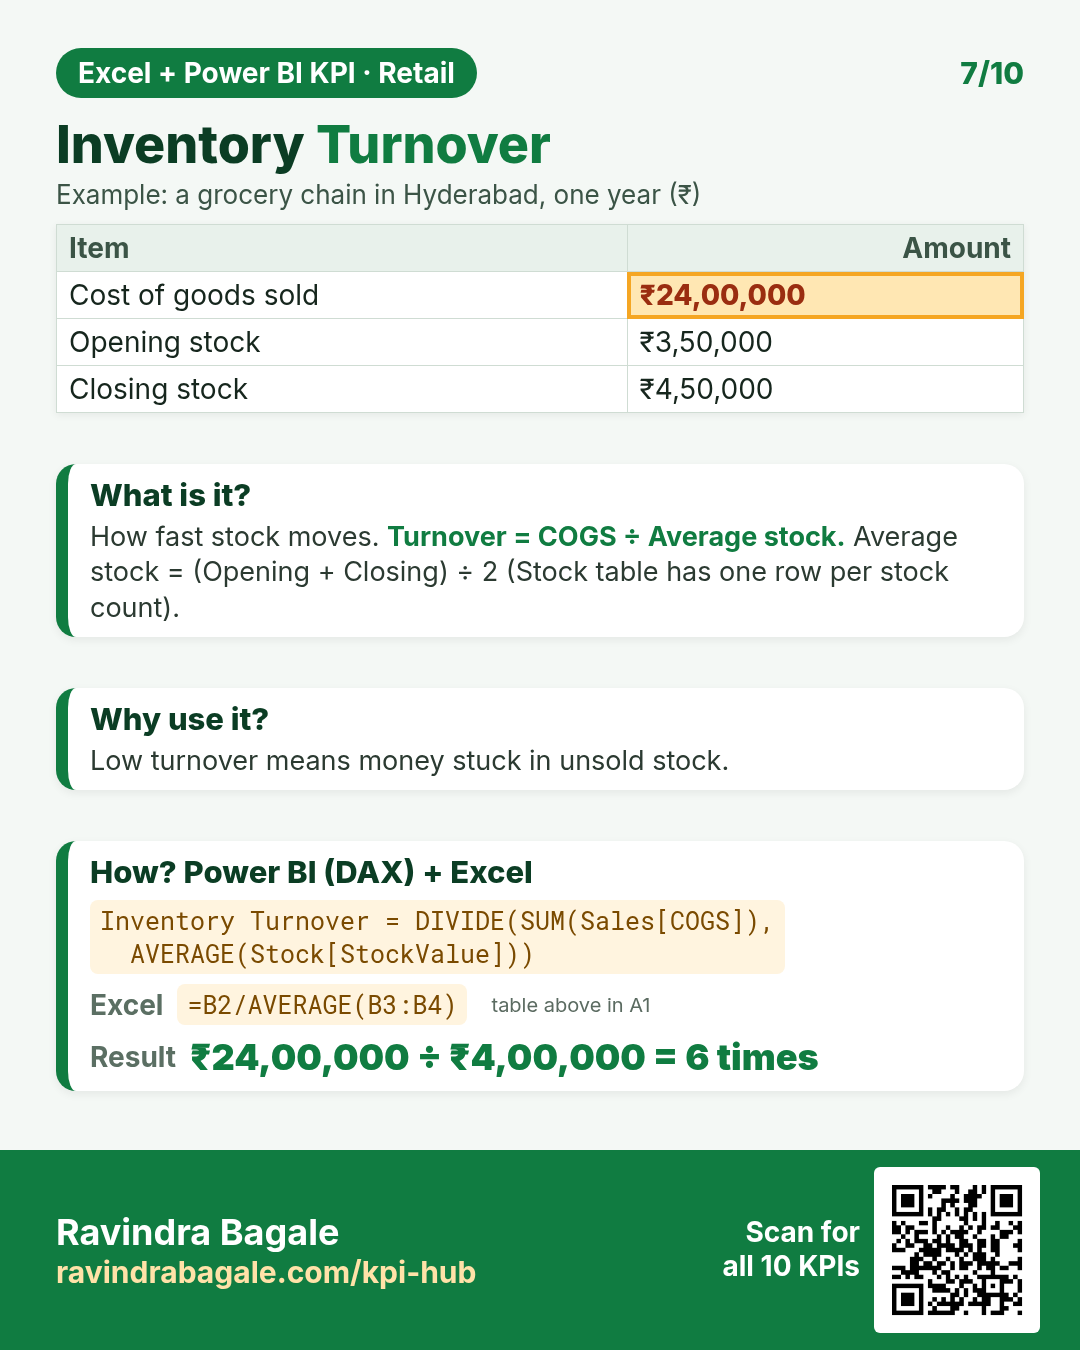
DAX: Inventory Turnover = DIVIDE(SUM(Sales[COGS]), AVERAGE(Stock[StockValue]))Excel: =B2/AVERAGE(B3:B4)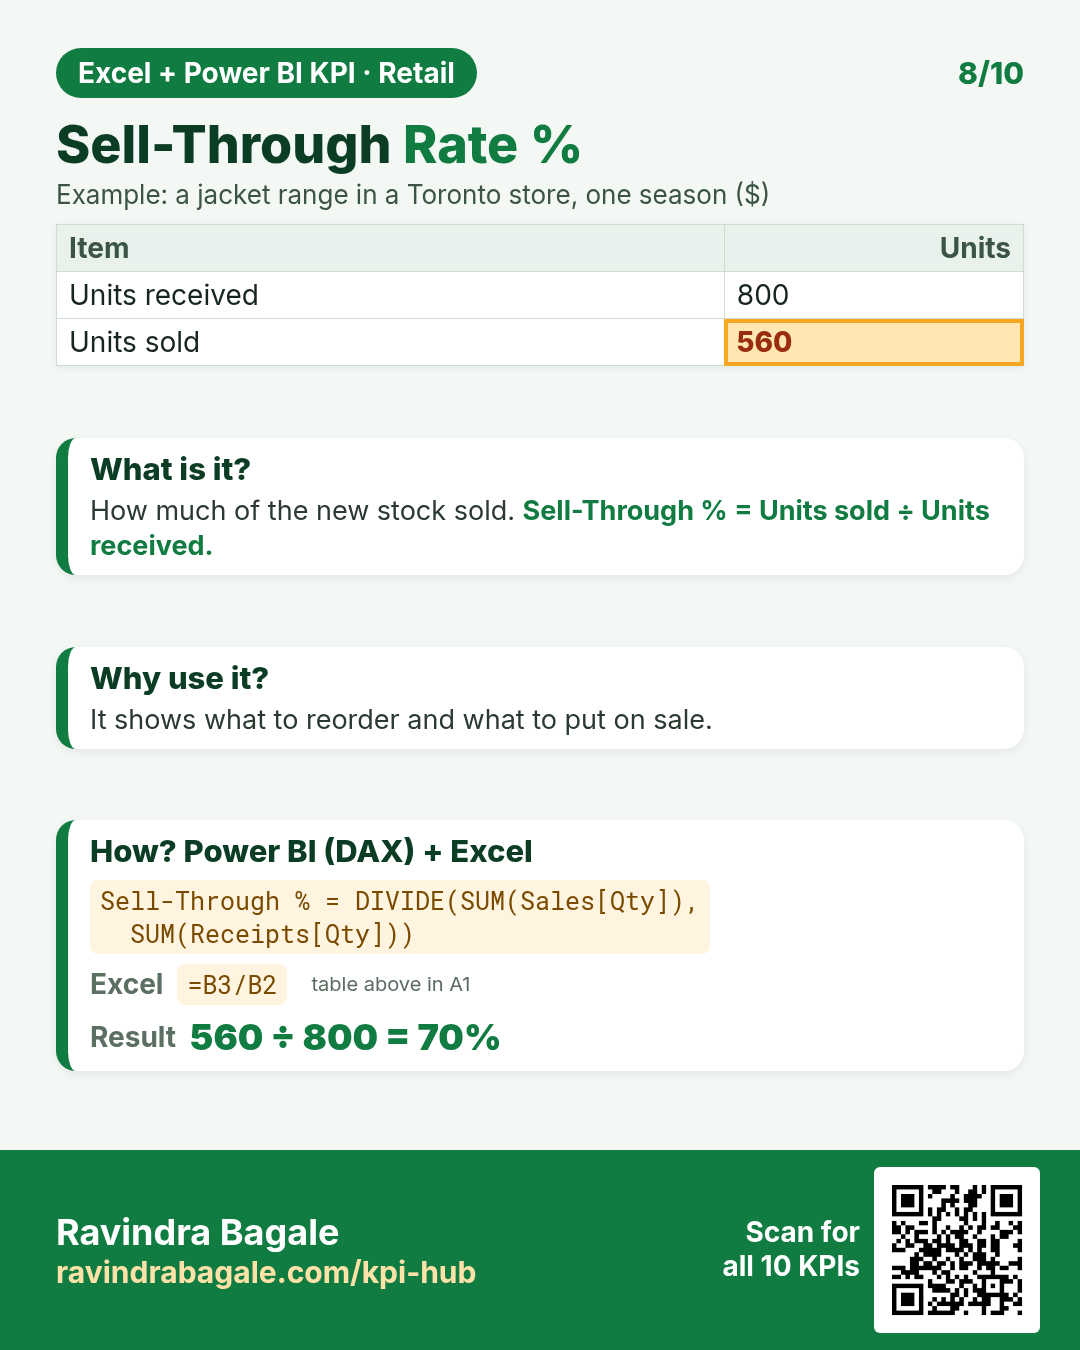
DAX: Sell-Through % = DIVIDE(SUM(Sales[Qty]), SUM(Receipts[Qty]))Excel: =B3/B2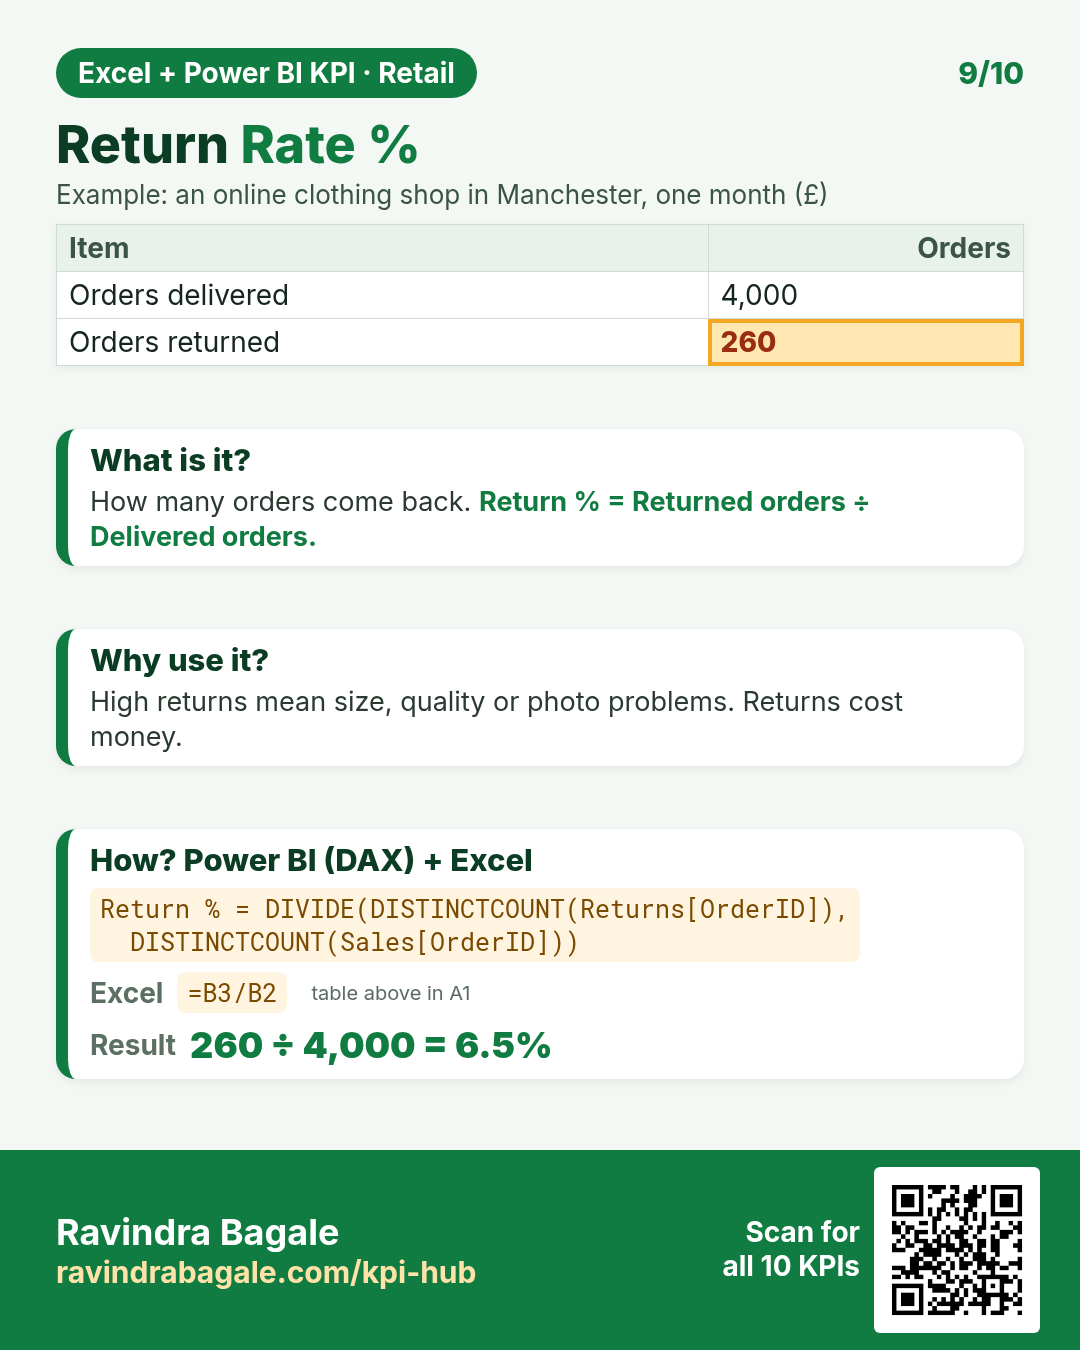
DAX: Return % = DIVIDE(DISTINCTCOUNT(Returns[OrderID]), DISTINCTCOUNT(Sales[OrderID]))Excel: =B3/B2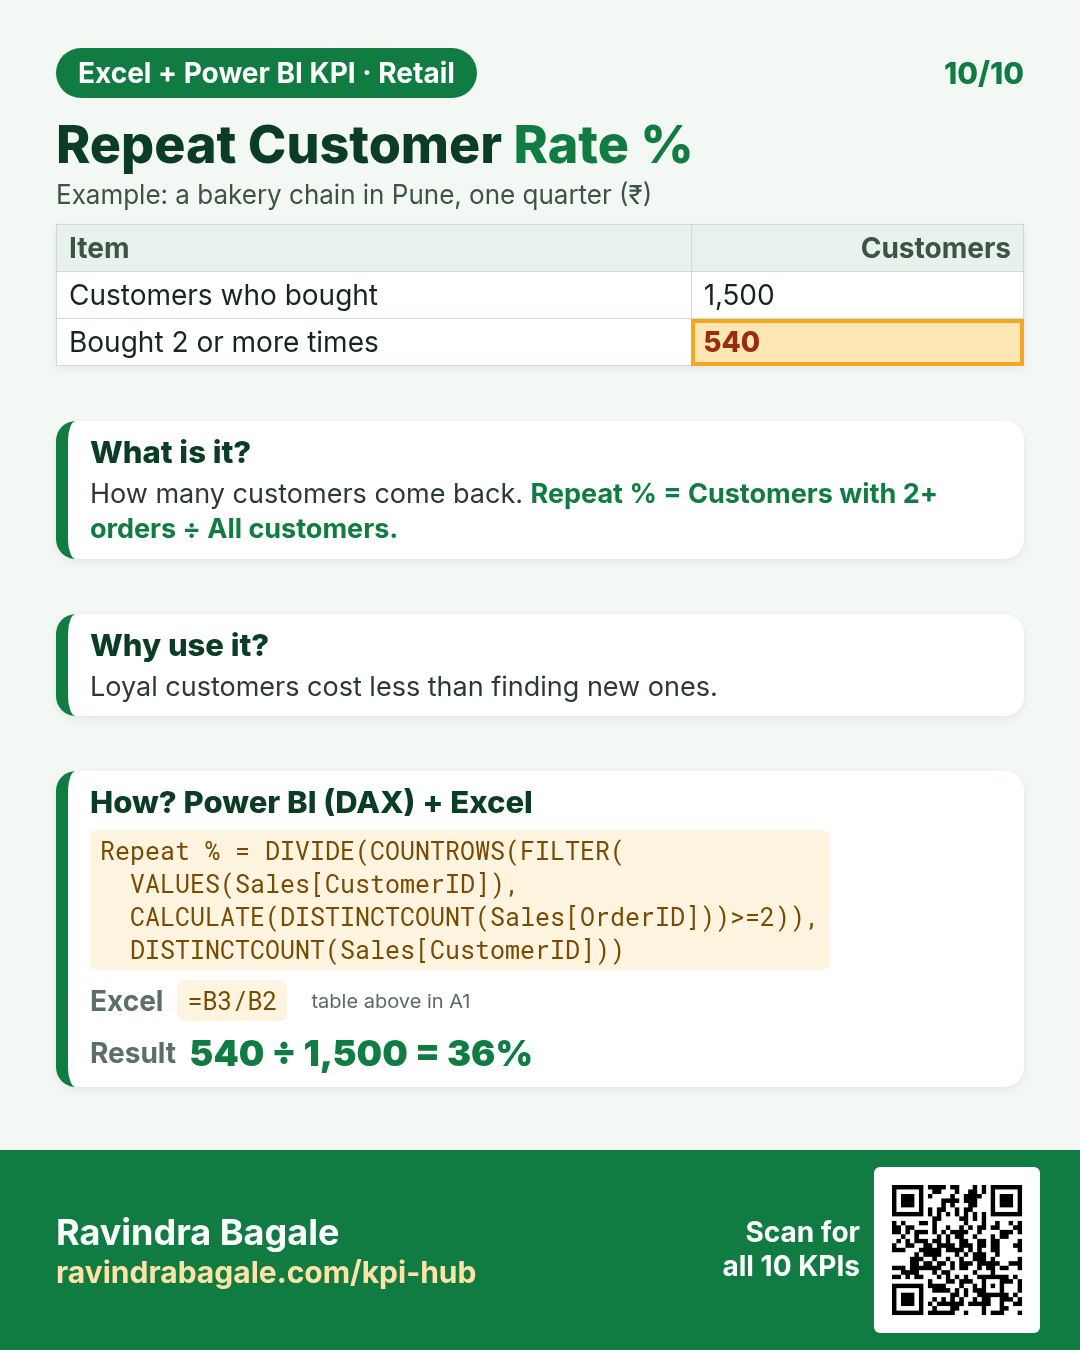
DAX: Repeat % = DIVIDE(COUNTROWS(FILTER( VALUES(Sales[CustomerID]), CALCULATE(DISTINCTCOUNT(Sales[OrderID]))>=2)), DISTINCTCOUNT(Sales[CustomerID]))Excel: =B3/B2Quick quiz
1. A shop has Gross Sales ₹50,000, discounts ₹4,000 and returns ₹1,000. Net Sales is…
2. Net Sales $9,000 from 300 orders. AOV is…
3. 2,000 visitors, 60 orders. Conversion Rate % is…
4. Which KPI tells you how fast stock is sold and refilled?