Telecom KPIs in Excel and Power BI
Ten important KPIs for mobile, broadband and fibre operator. Each card has what it is, why it matters, the Excel formula, the DAX measure and a tiny worked example. Every card shows the Excel formula next to the Power BI DAX measure. For Excel, put the card’s example table in cell A1 (labels in column A, numbers in column B).
About this data: All examples are made-up teaching numbers for operators in India, Manchester, Texas, Pune, Madrid, Lucknow, Berlin, Kerala, Florida and Liverpool, in ₹, £, $ and €. Table names (Billing, Subscribers, Outages, Calls, Usage, Marketing, Complaints) are sample names.

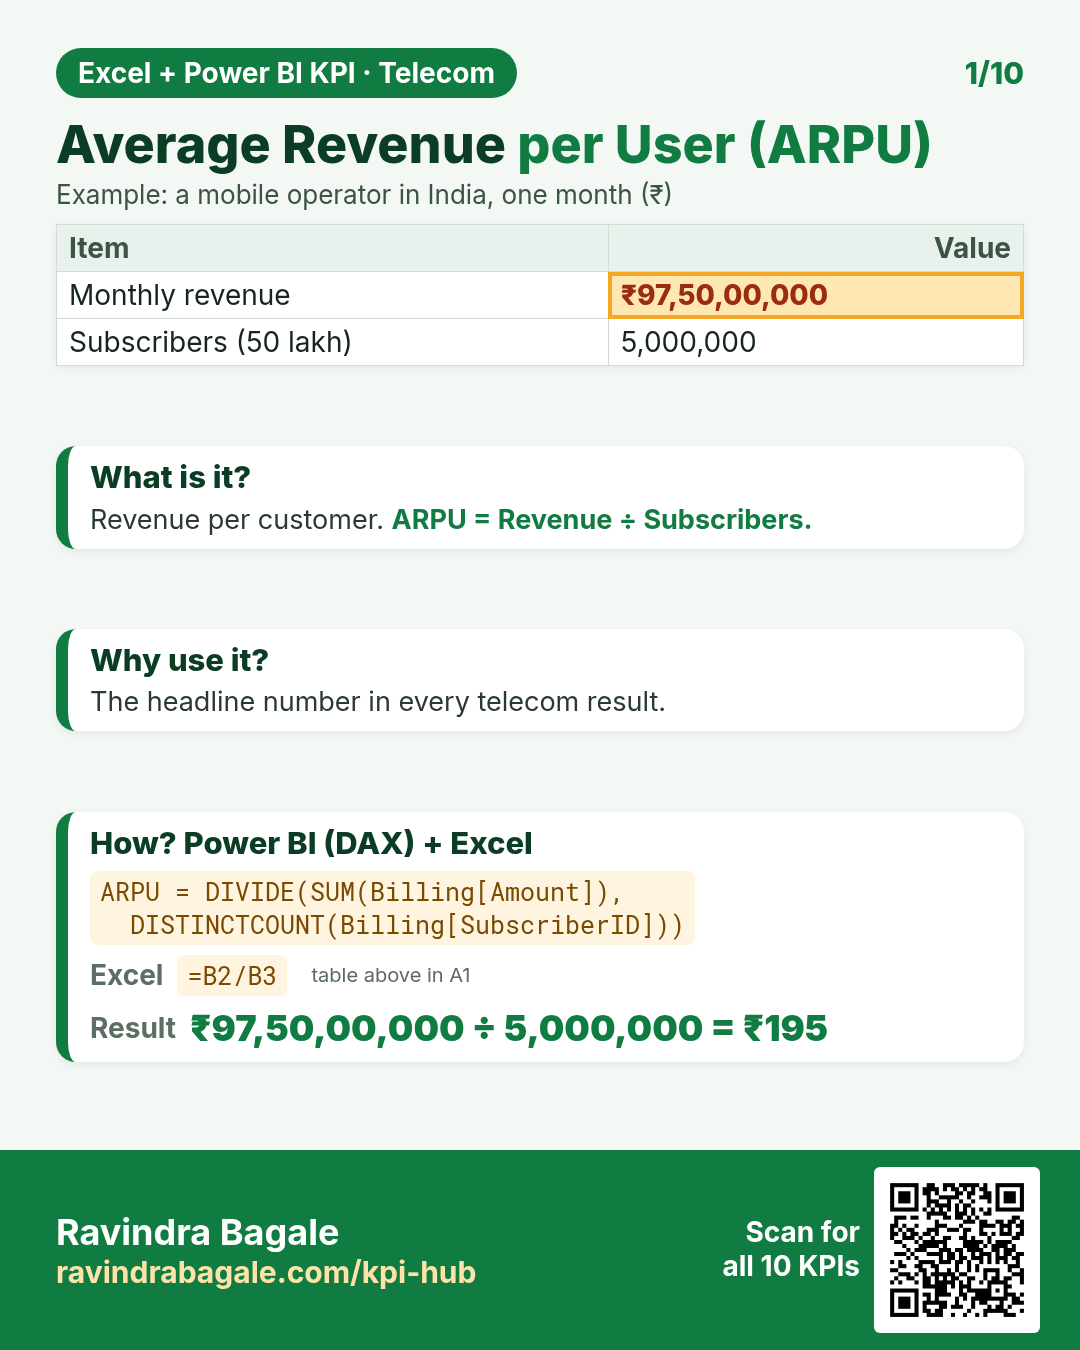
DAX: ARPU = DIVIDE(SUM(Billing[Amount]), DISTINCTCOUNT(Billing[SubscriberID]))Excel: =B2/B3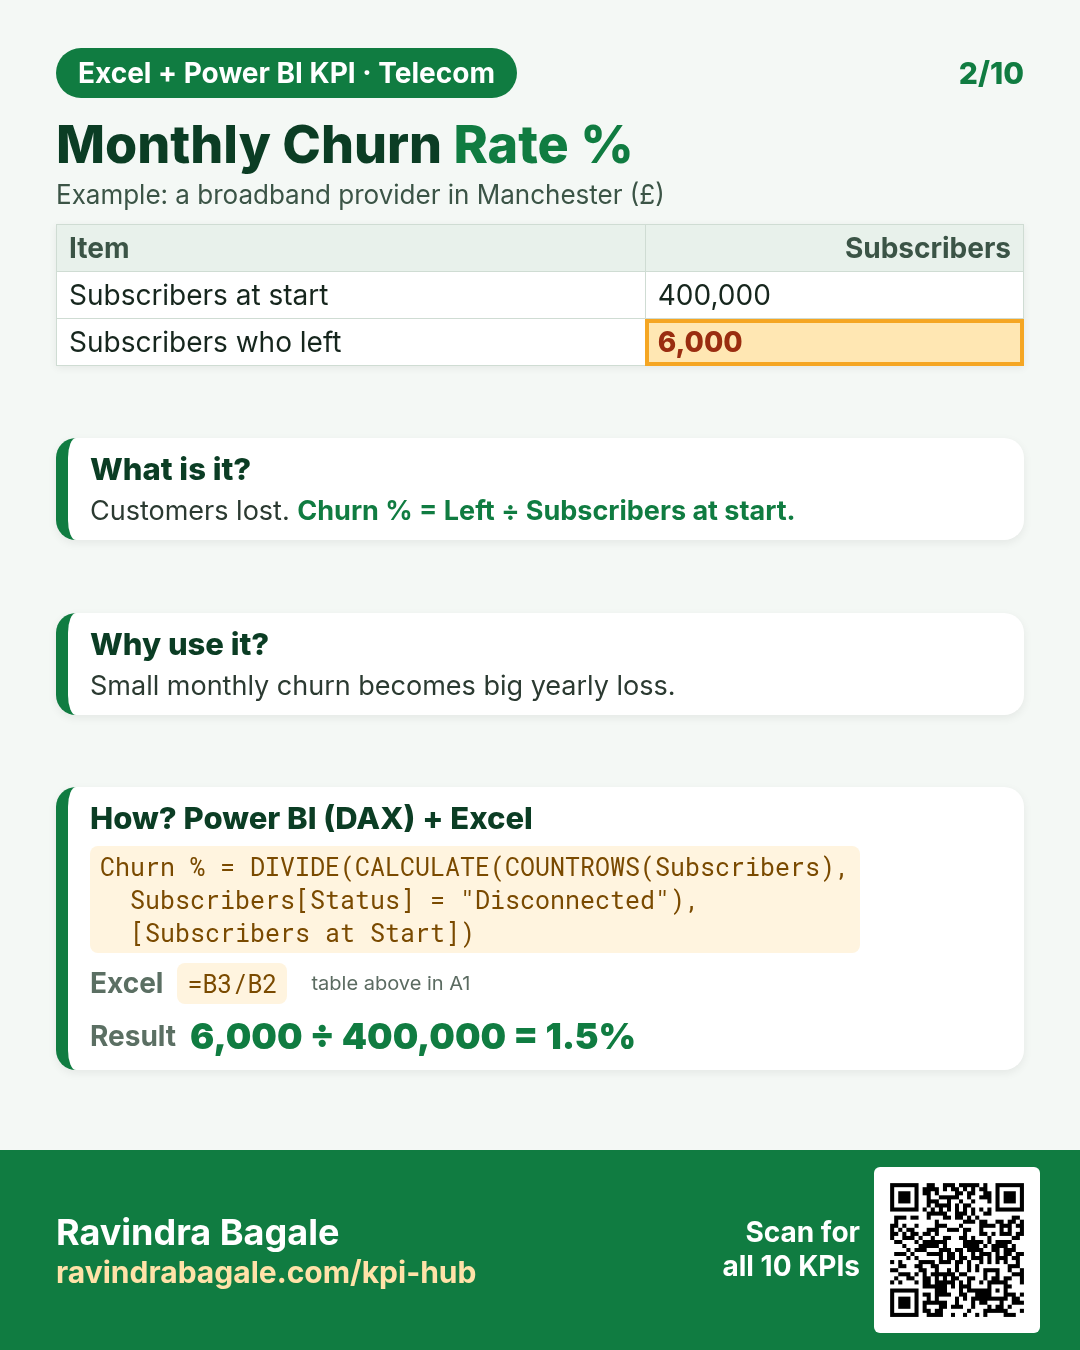
DAX: Churn % = DIVIDE(CALCULATE(COUNTROWS(Subscribers), Subscribers[Status] = "Disconnected"), [Subscribers at Start])Excel: =B3/B2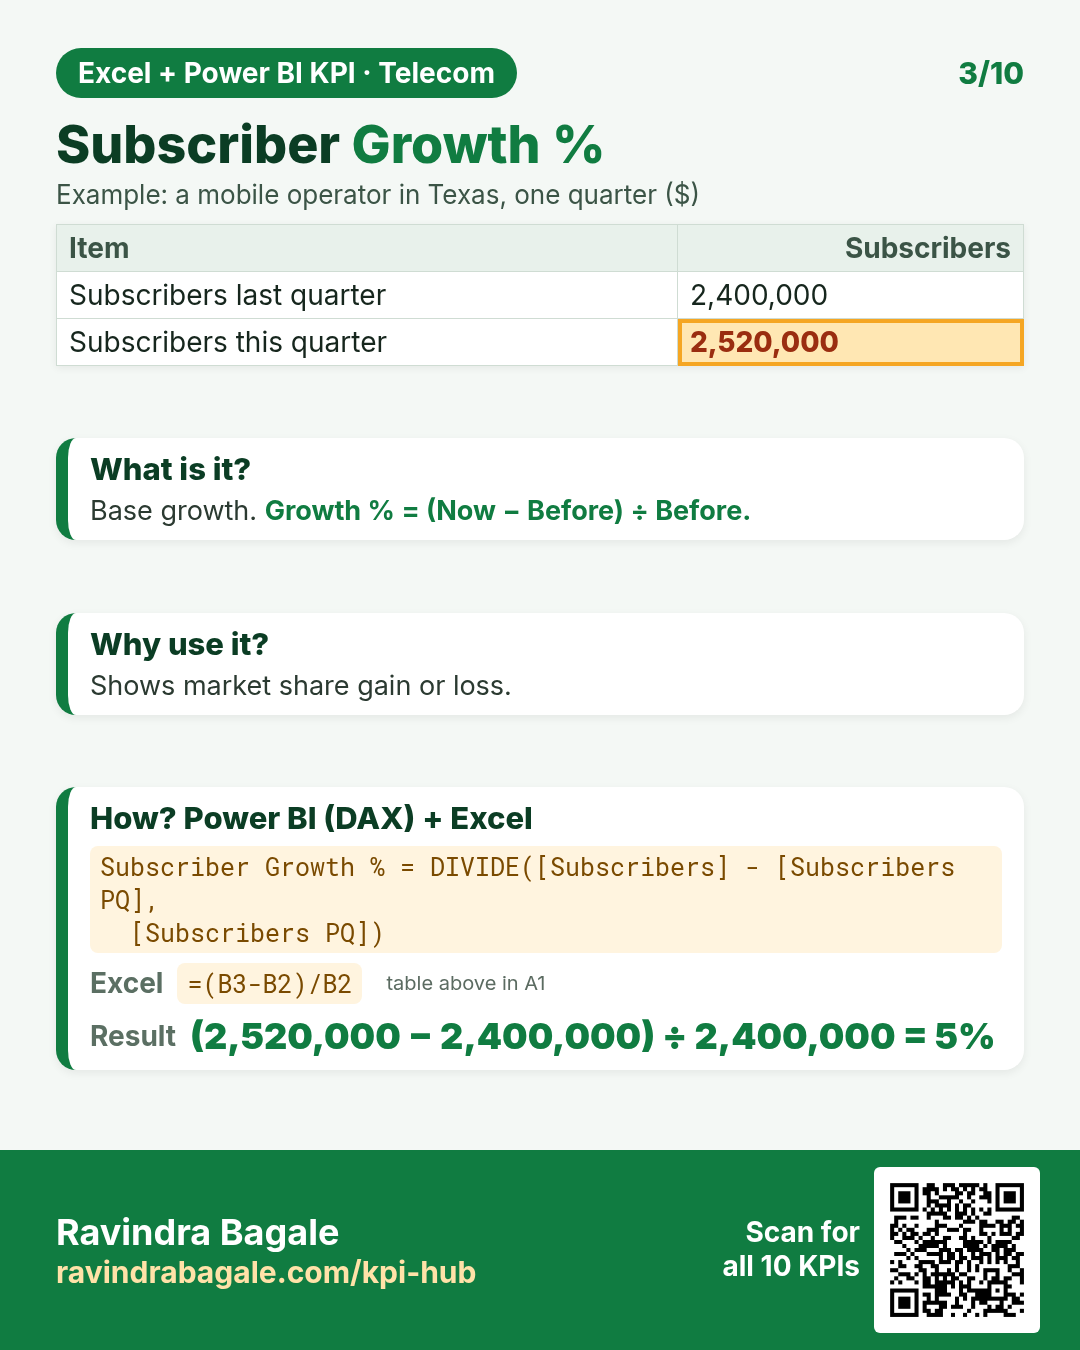
DAX: Subscriber Growth % = DIVIDE([Subscribers] - [Subscribers PQ], [Subscribers PQ])Excel: =(B3-B2)/B2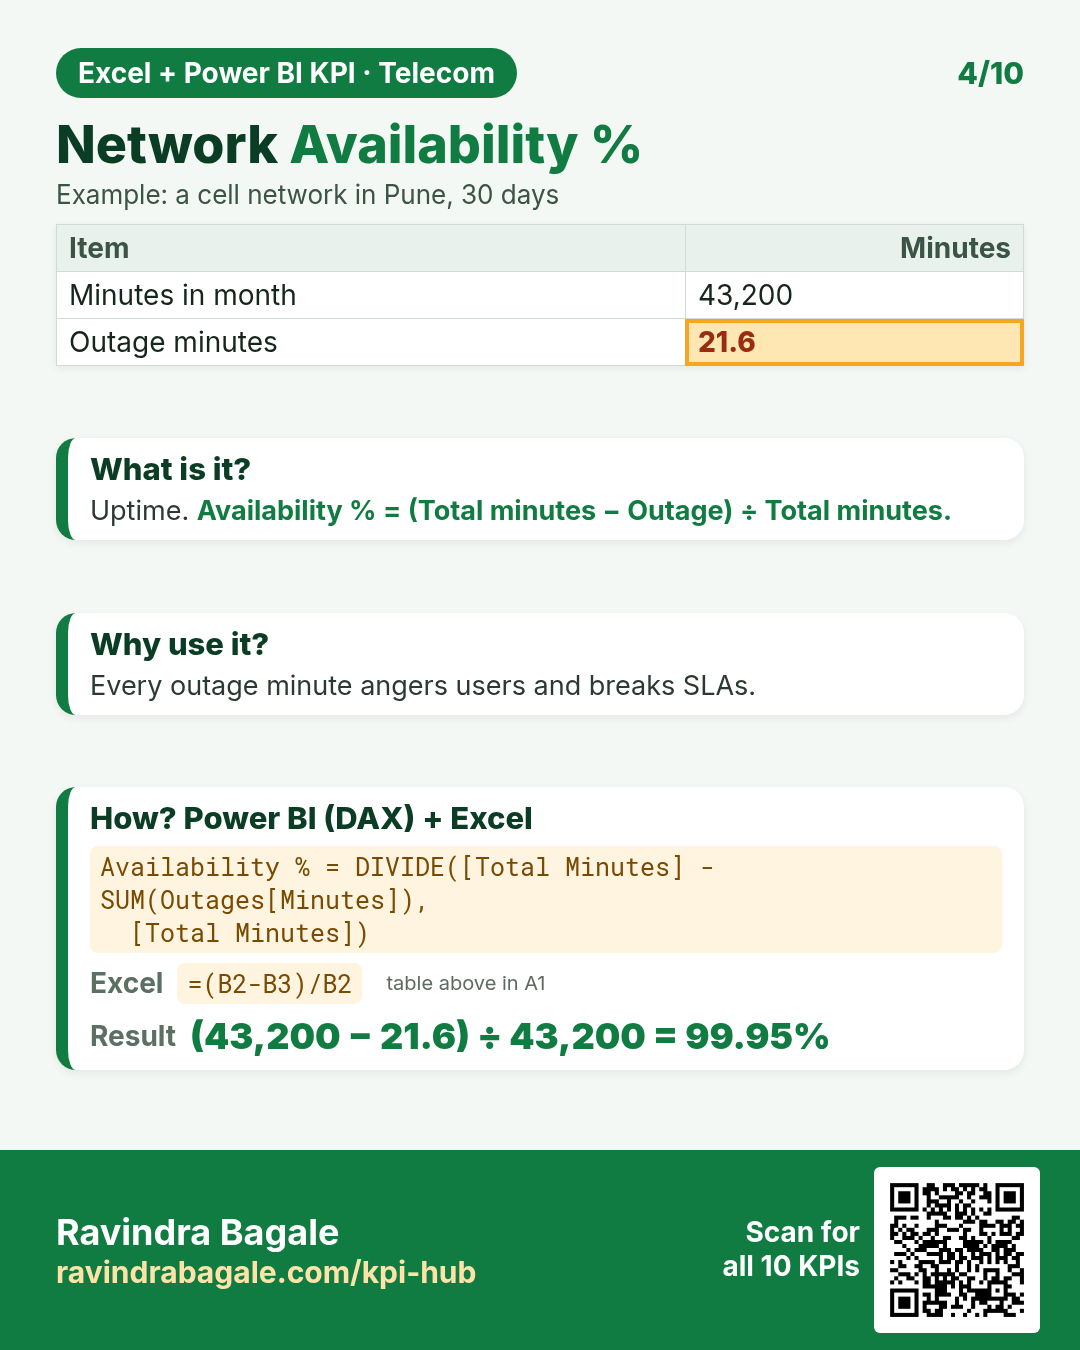
DAX: Availability % = DIVIDE([Total Minutes] - SUM(Outages[Minutes]), [Total Minutes])Excel: =(B2-B3)/B2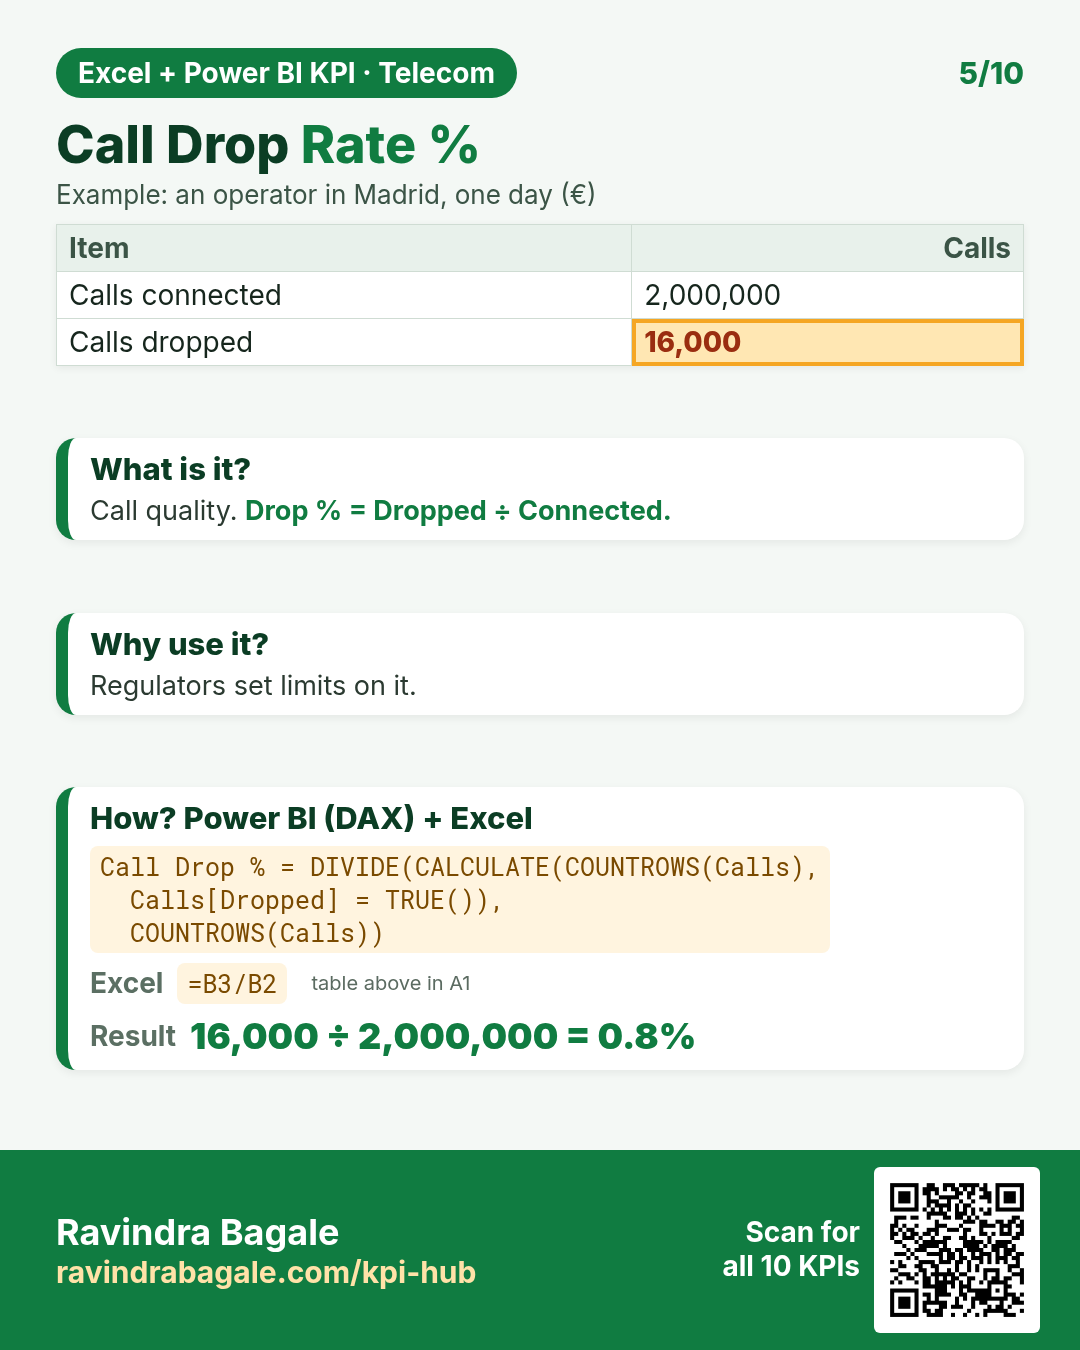
DAX: Call Drop % = DIVIDE(CALCULATE(COUNTROWS(Calls), Calls[Dropped] = TRUE()), COUNTROWS(Calls))Excel: =B3/B2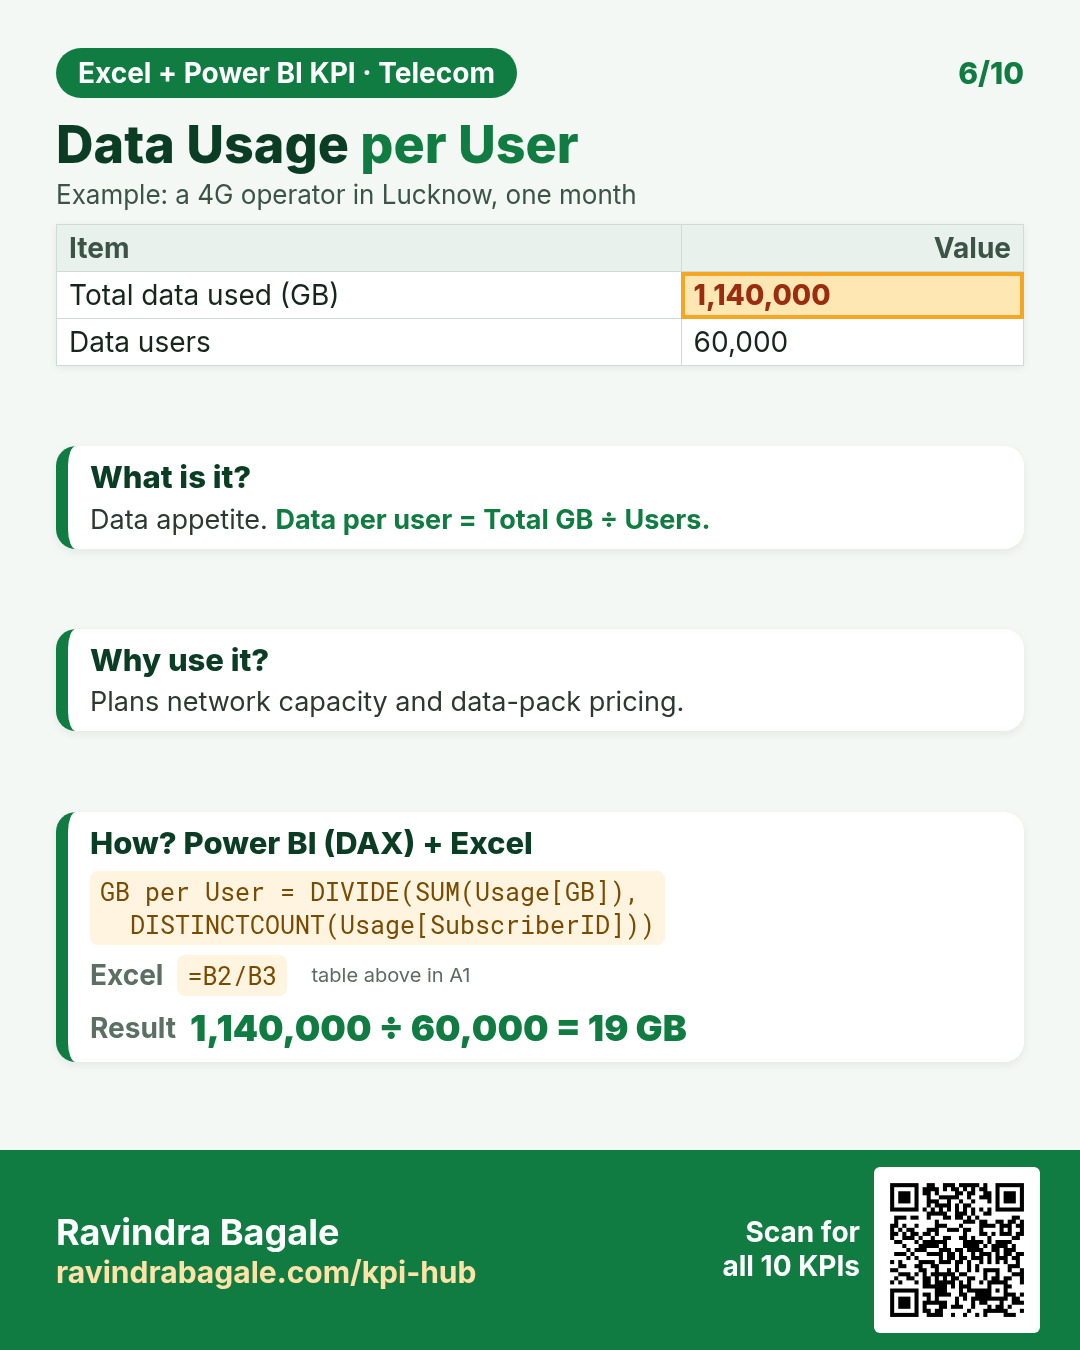
DAX: GB per User = DIVIDE(SUM(Usage[GB]), DISTINCTCOUNT(Usage[SubscriberID]))Excel: =B2/B3
DAX: CAC = DIVIDE(SUM(Marketing[Spend]), [New Subscribers])Excel: =B2/B3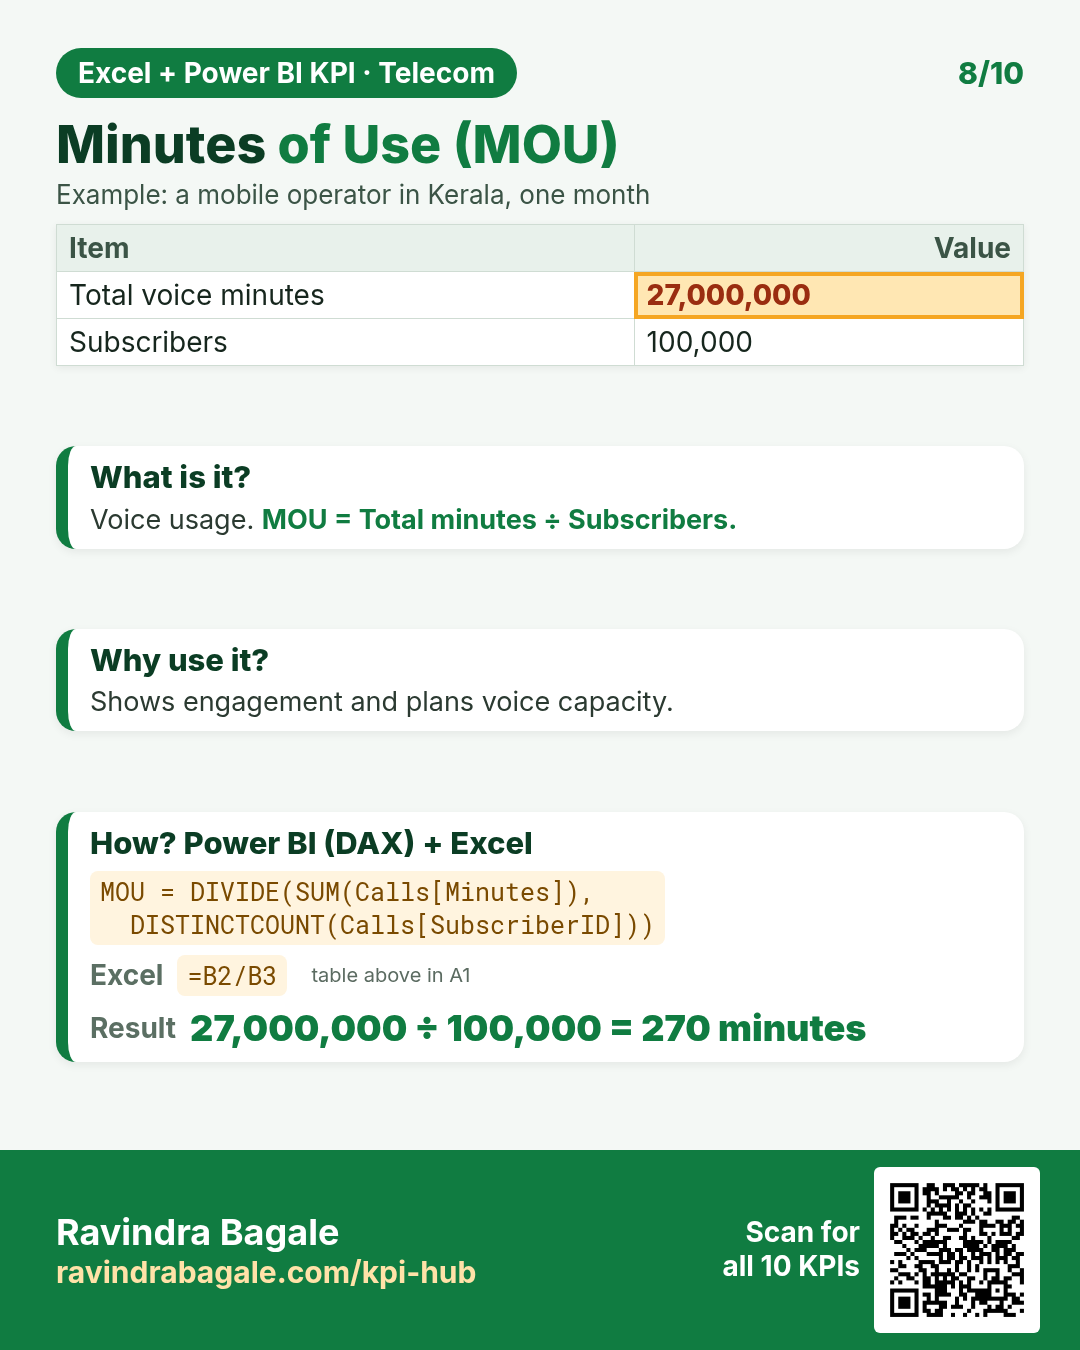
DAX: MOU = DIVIDE(SUM(Calls[Minutes]), DISTINCTCOUNT(Calls[SubscriberID]))Excel: =B2/B3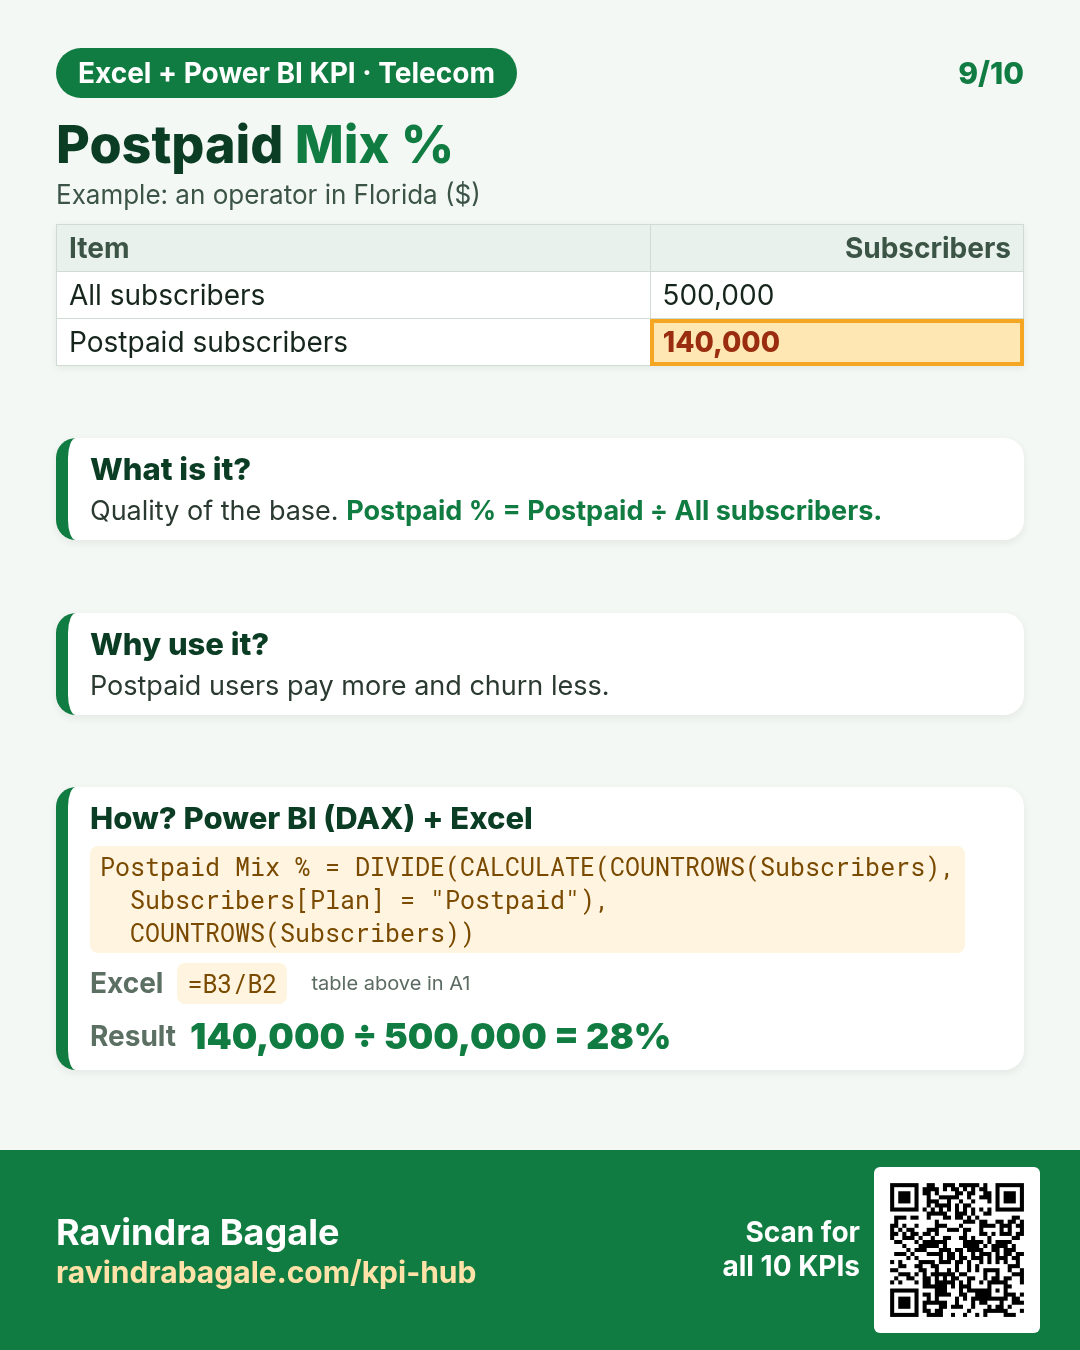
DAX: Postpaid Mix % = DIVIDE(CALCULATE(COUNTROWS(Subscribers), Subscribers[Plan] = "Postpaid"), COUNTROWS(Subscribers))Excel: =B3/B2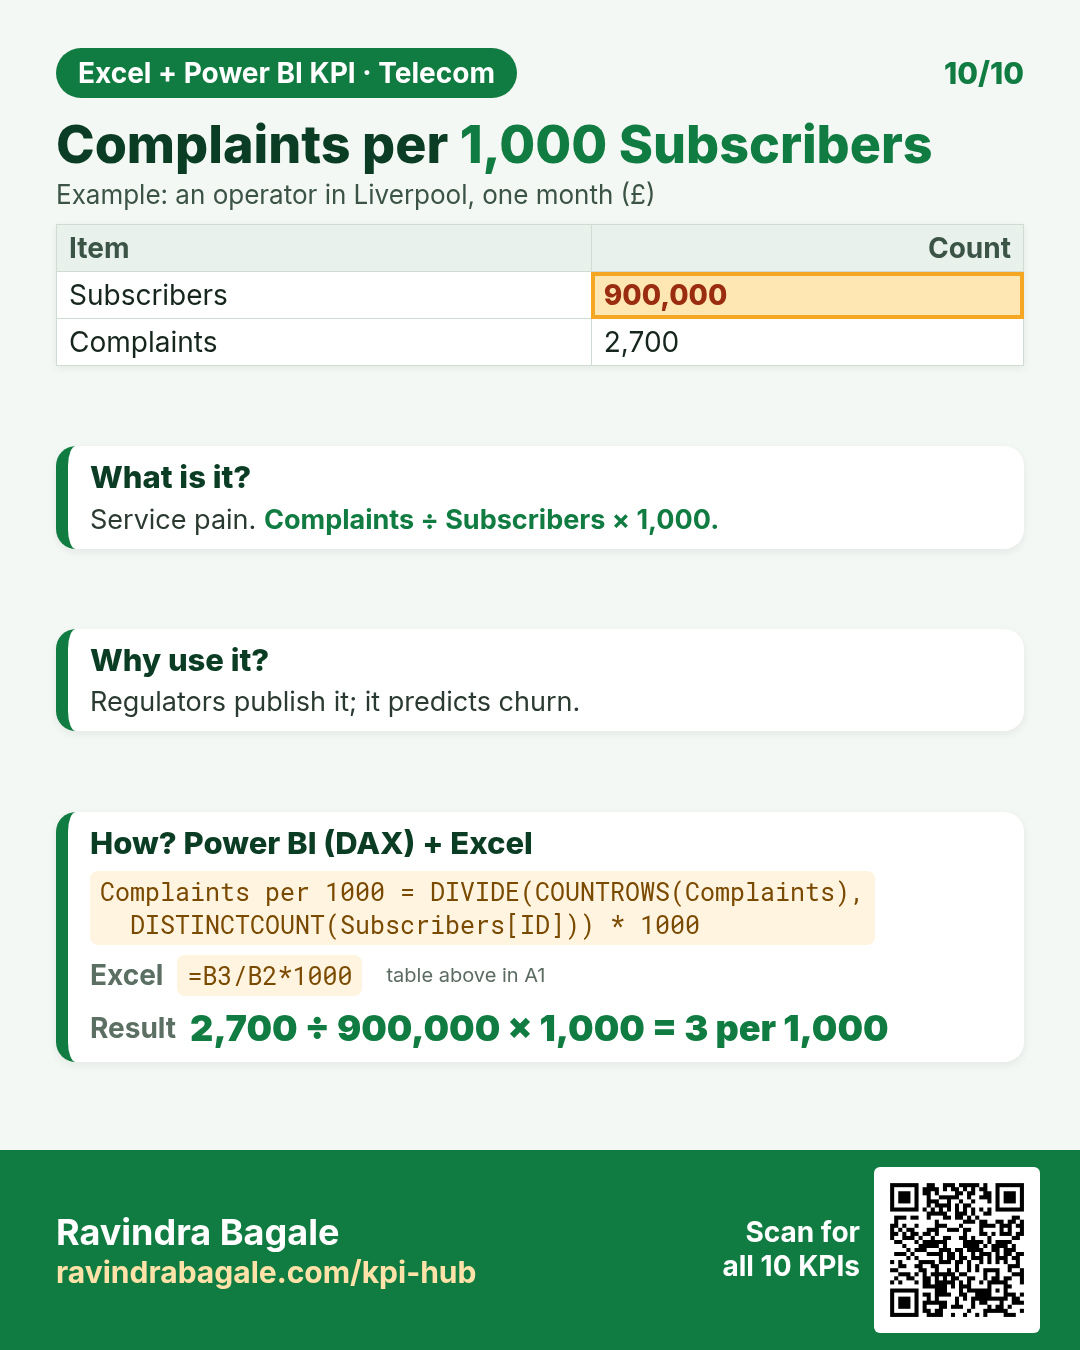
DAX: Complaints per 1000 = DIVIDE(COUNTROWS(Complaints), DISTINCTCOUNT(Subscribers[ID])) * 1000Excel: =B3/B2*1000Quick quiz
1. Average Revenue per User (ARPU): Monthly revenue ₹97,50,00,000, Subscribers (50 lakh) 5,000,000. The answer is…
2. Monthly Churn Rate %: Subscribers at start 400,000, Subscribers who left 6,000. The answer is…
3. Subscriber Growth %: Subscribers last quarter 2,400,000, Subscribers this quarter 2,520,000. The answer is…
4. Which KPI means: “Share of time the network was up.”