Insurance KPIs in Excel and Power BI
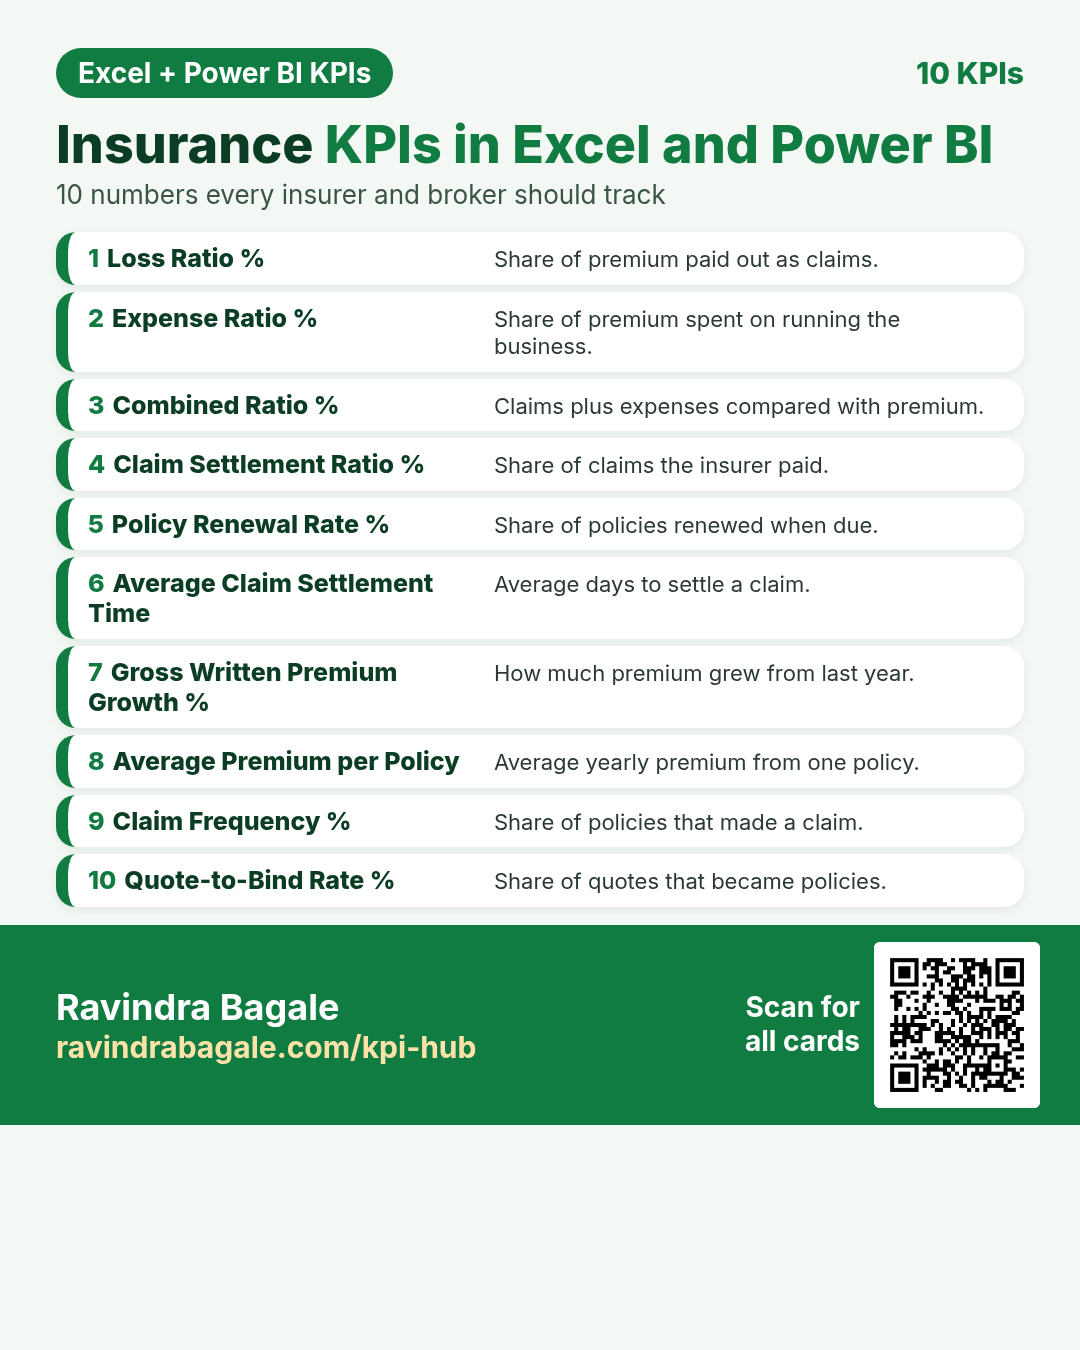
Ten important KPIs for insurer and broker. Each card has what it is, why it matters, the Excel formula, the DAX measure and a tiny worked example. Every card shows the Excel formula next to the Power BI DAX measure. For Excel, put the card’s example table in cell A1 (labels in column A, numbers in column B).
About this data: All examples are made-up teaching numbers for insurers in Mumbai, London, Toronto, Pune, Dublin, Chicago, Chennai, Manchester, Madrid and Austin, in ₹, £, $ and €. Table names (Claims, Premiums, Expenses, Policies, Quotes) are sample names.
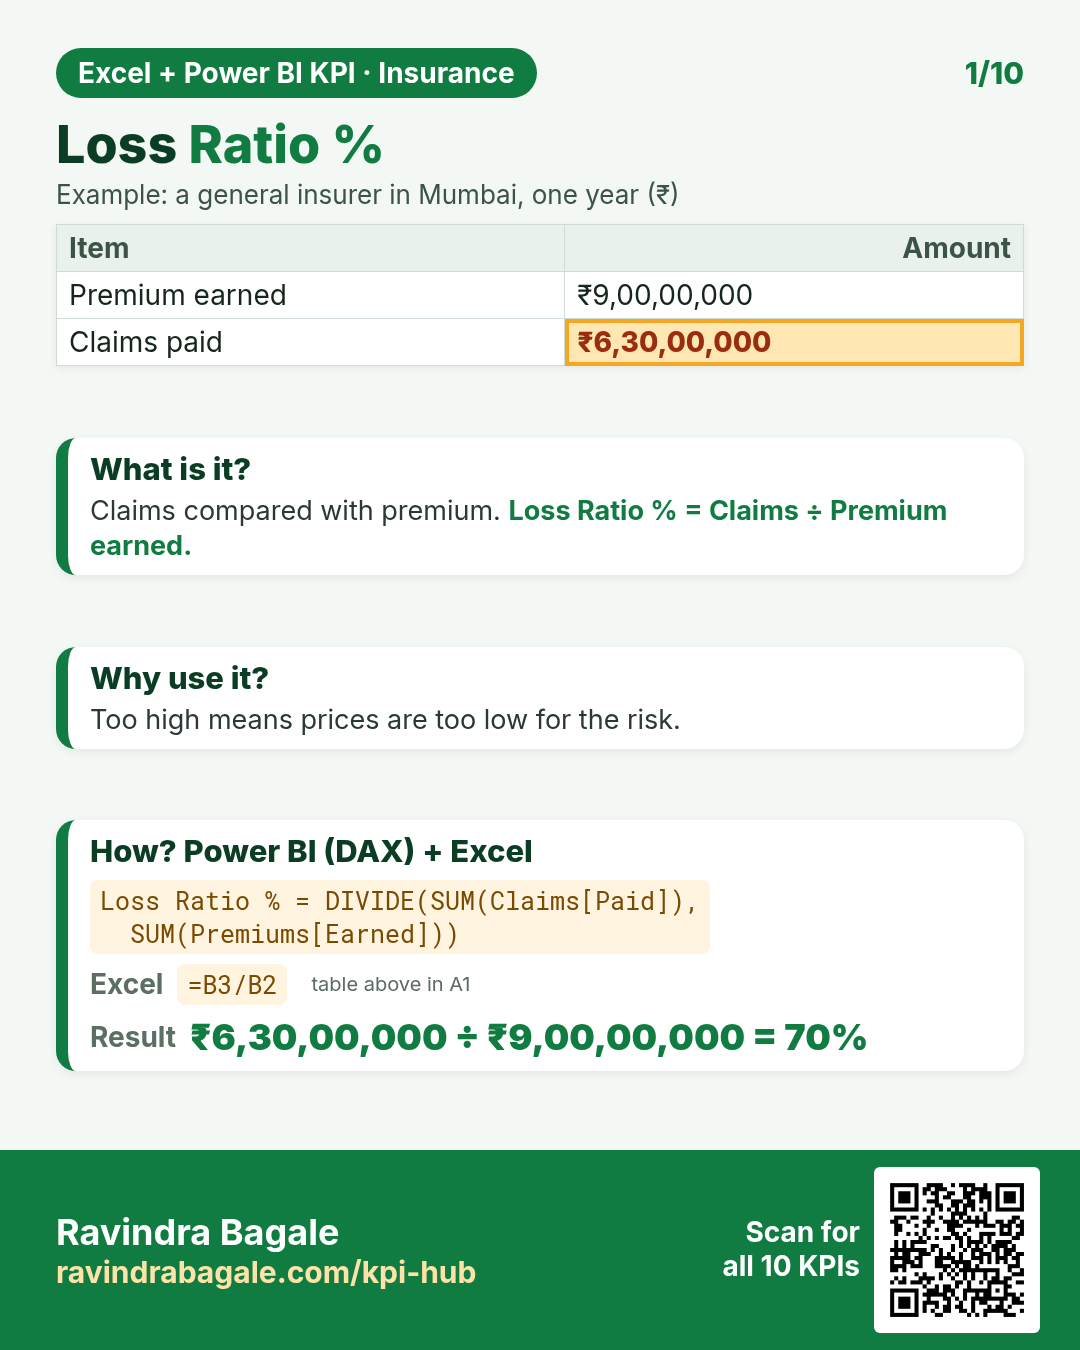
DAX: Loss Ratio % = DIVIDE(SUM(Claims[Paid]), SUM(Premiums[Earned]))Excel: =B3/B2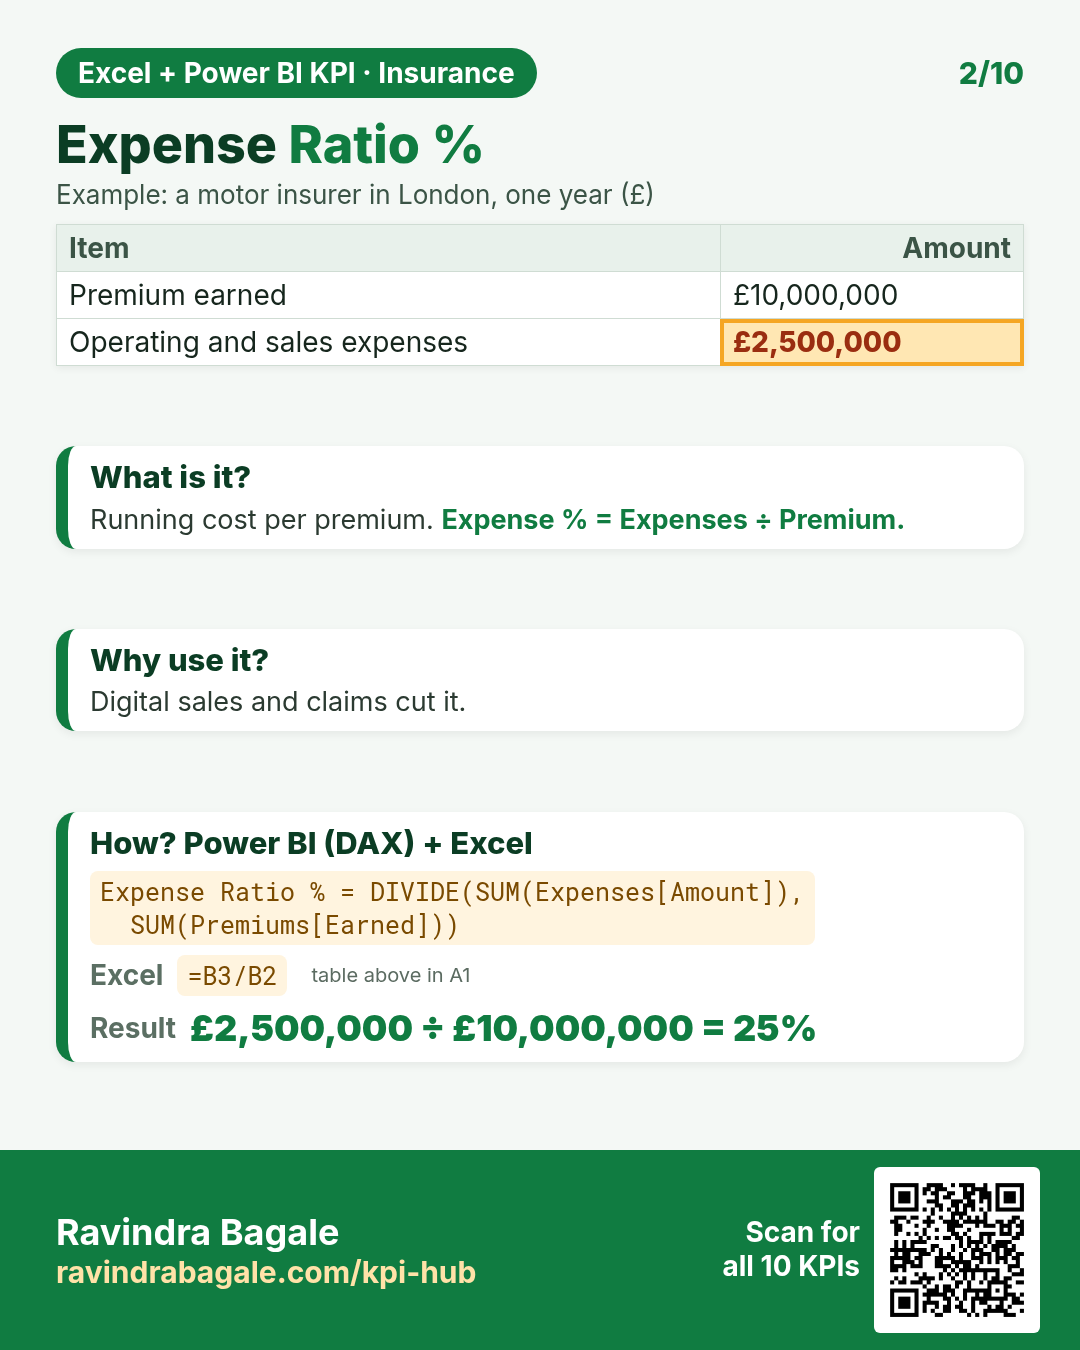
DAX: Expense Ratio % = DIVIDE(SUM(Expenses[Amount]), SUM(Premiums[Earned]))Excel: =B3/B2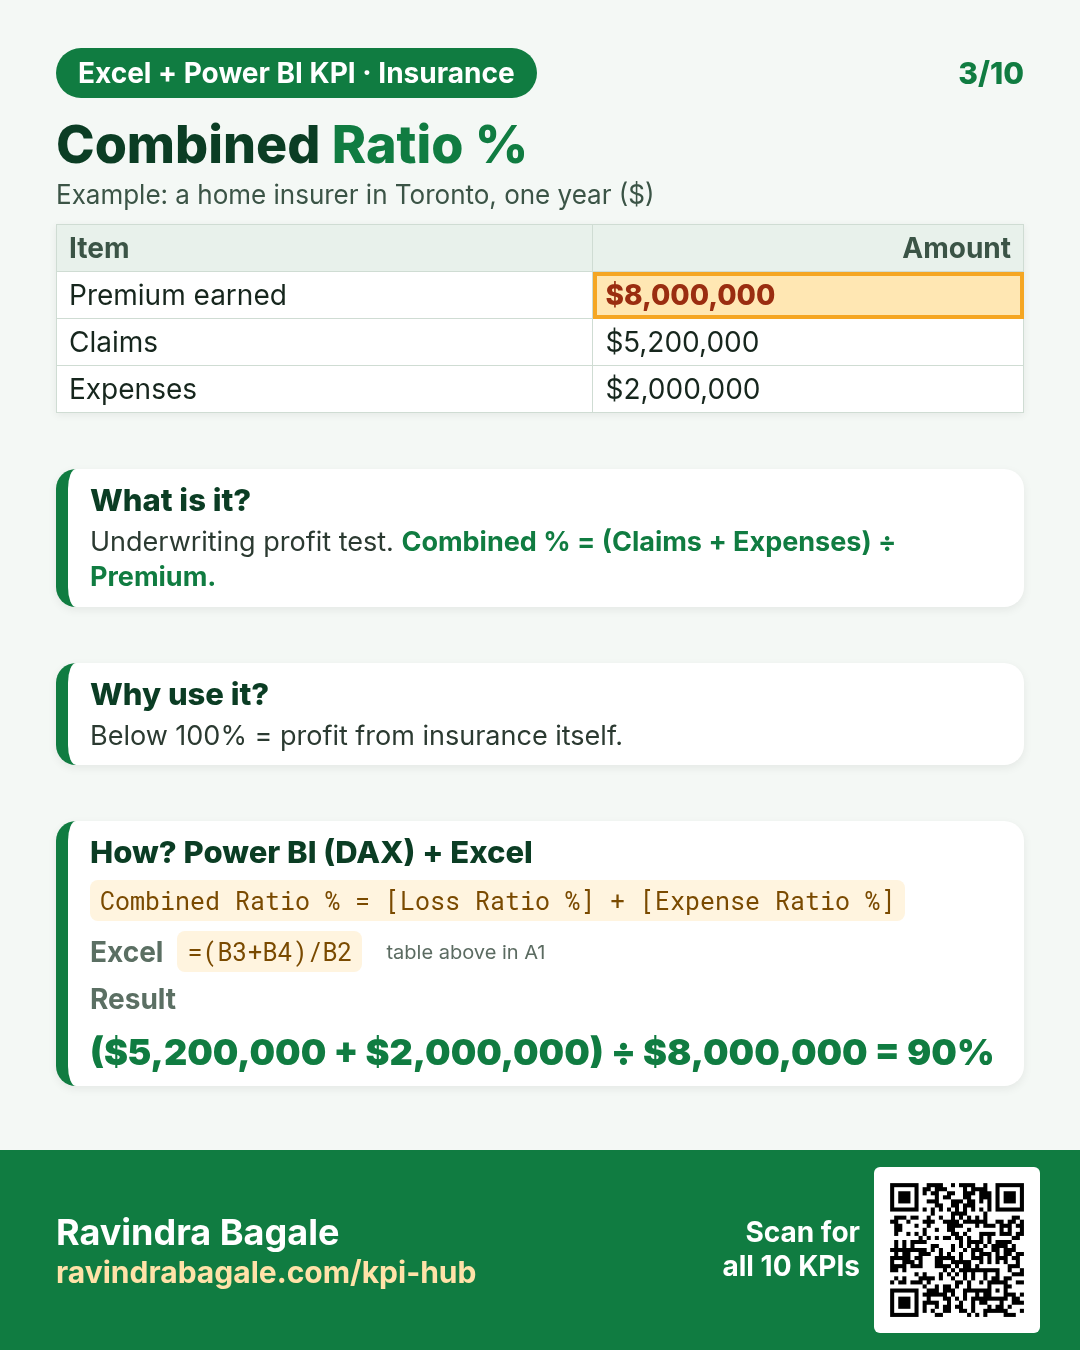
DAX: Combined Ratio % = [Loss Ratio %] + [Expense Ratio %]Excel: =(B3+B4)/B2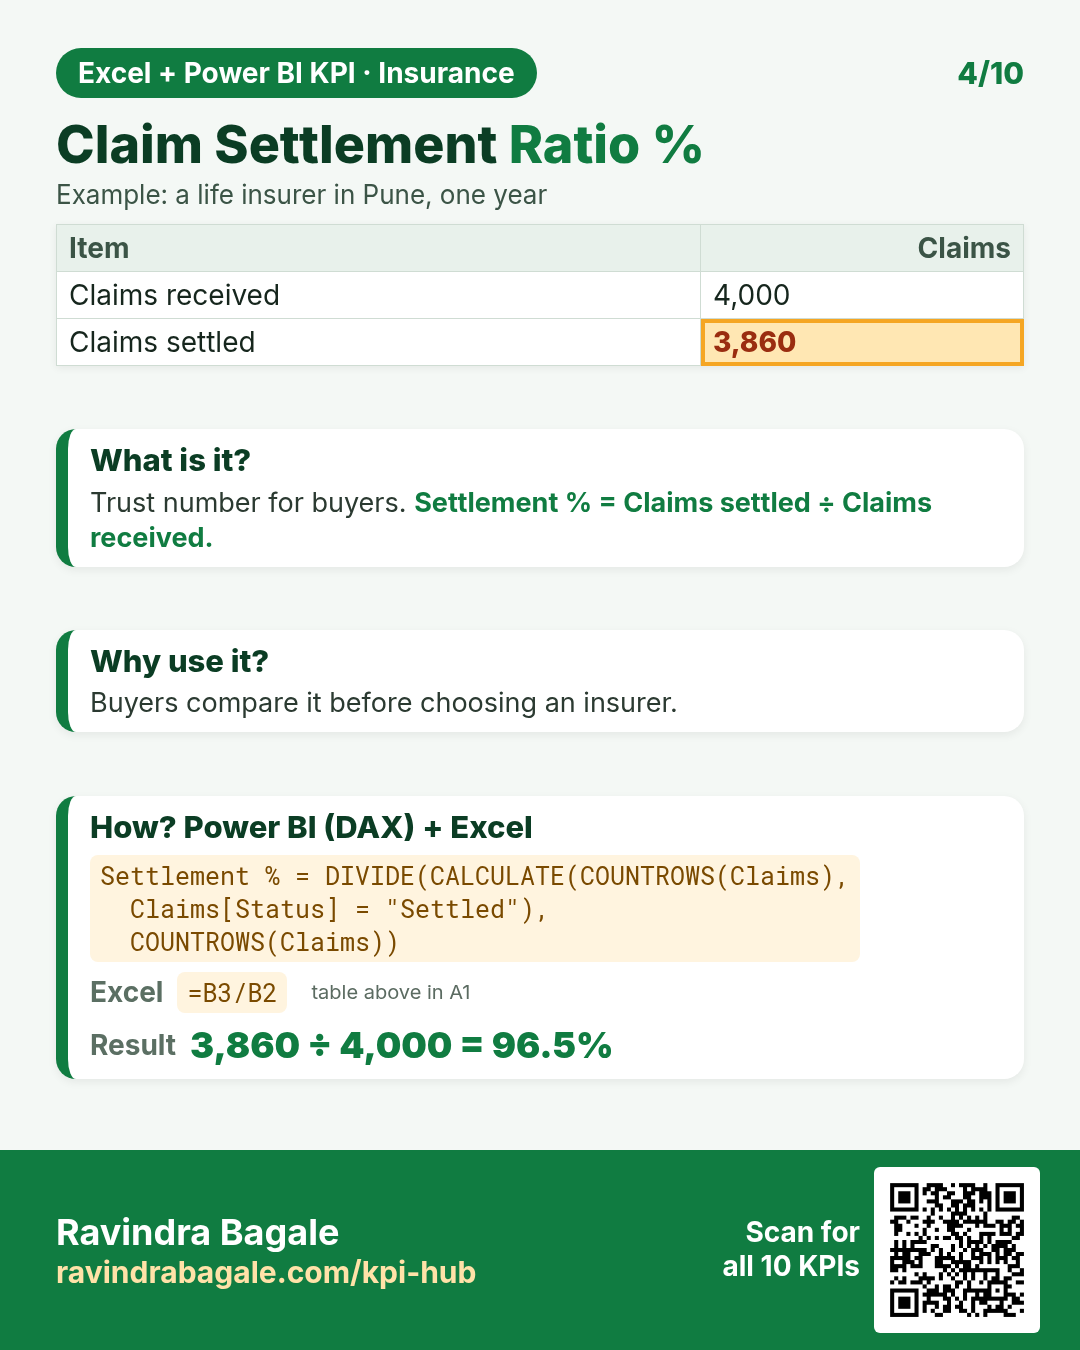
DAX: Settlement % = DIVIDE(CALCULATE(COUNTROWS(Claims), Claims[Status] = "Settled"), COUNTROWS(Claims))Excel: =B3/B2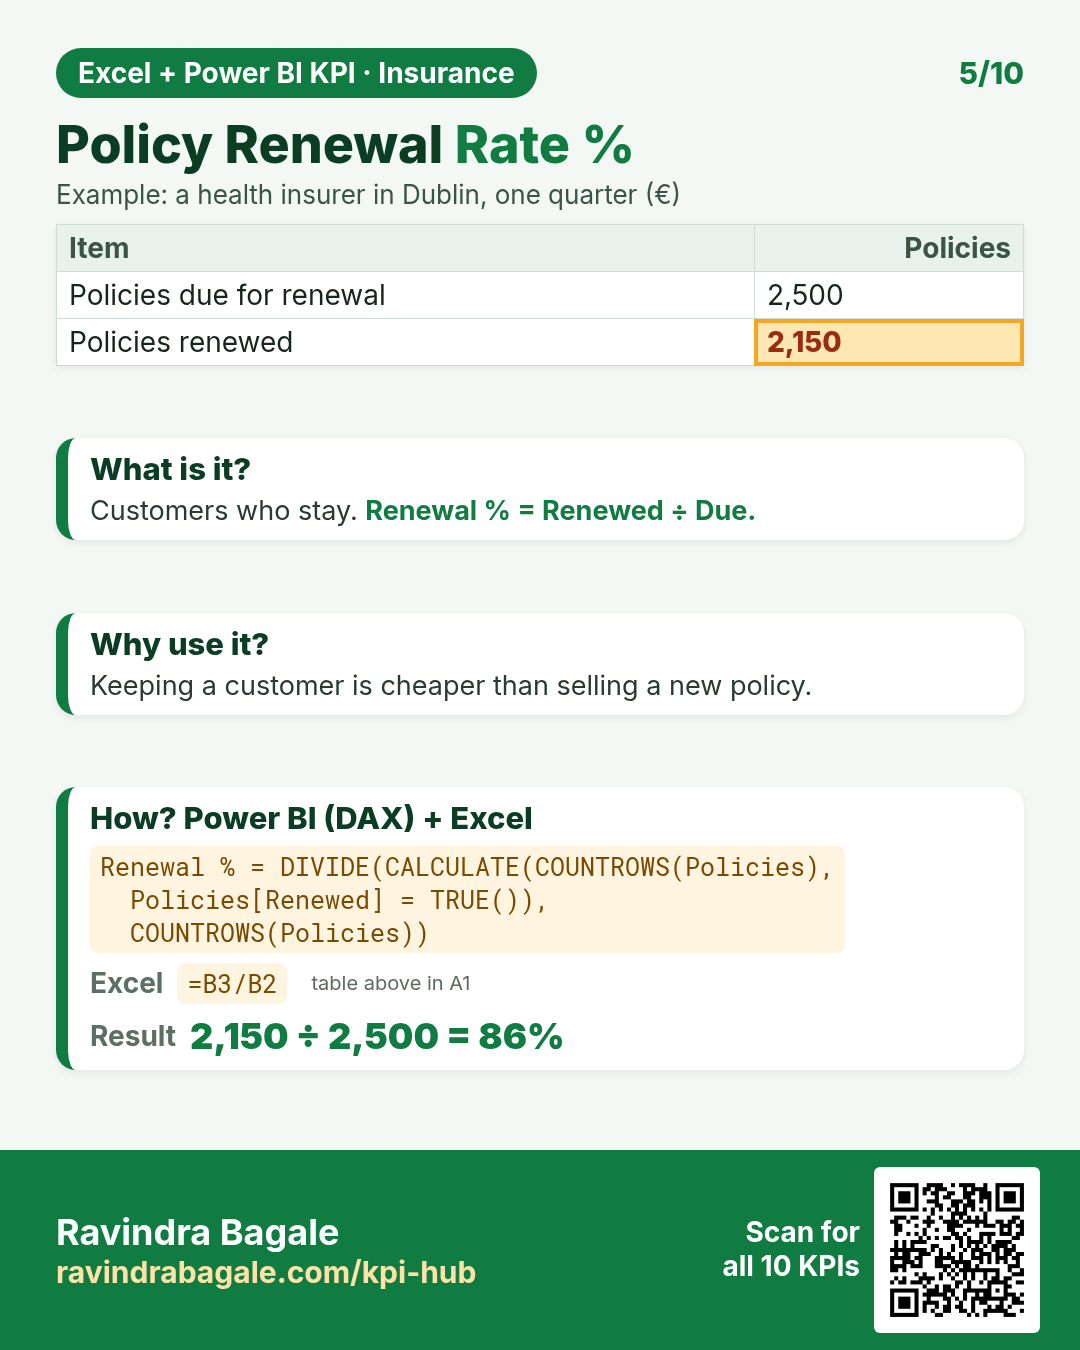
DAX: Renewal % = DIVIDE(CALCULATE(COUNTROWS(Policies), Policies[Renewed] = TRUE()), COUNTROWS(Policies))Excel: =B3/B2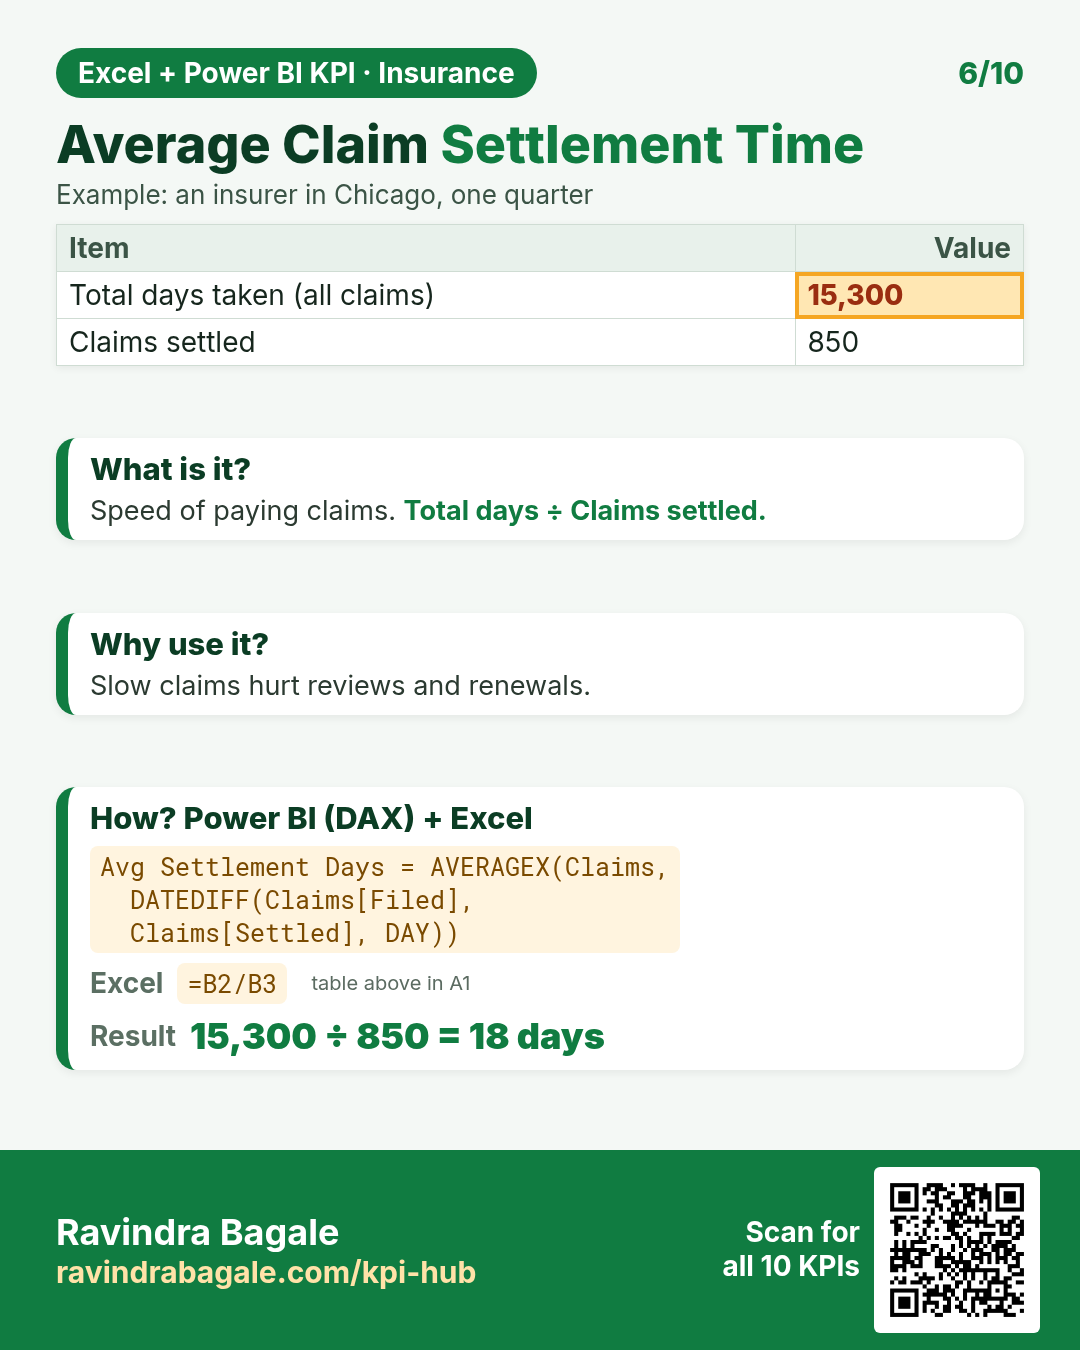
DAX: Avg Settlement Days = AVERAGEX(Claims, DATEDIFF(Claims[Filed], Claims[Settled], DAY))Excel: =B2/B3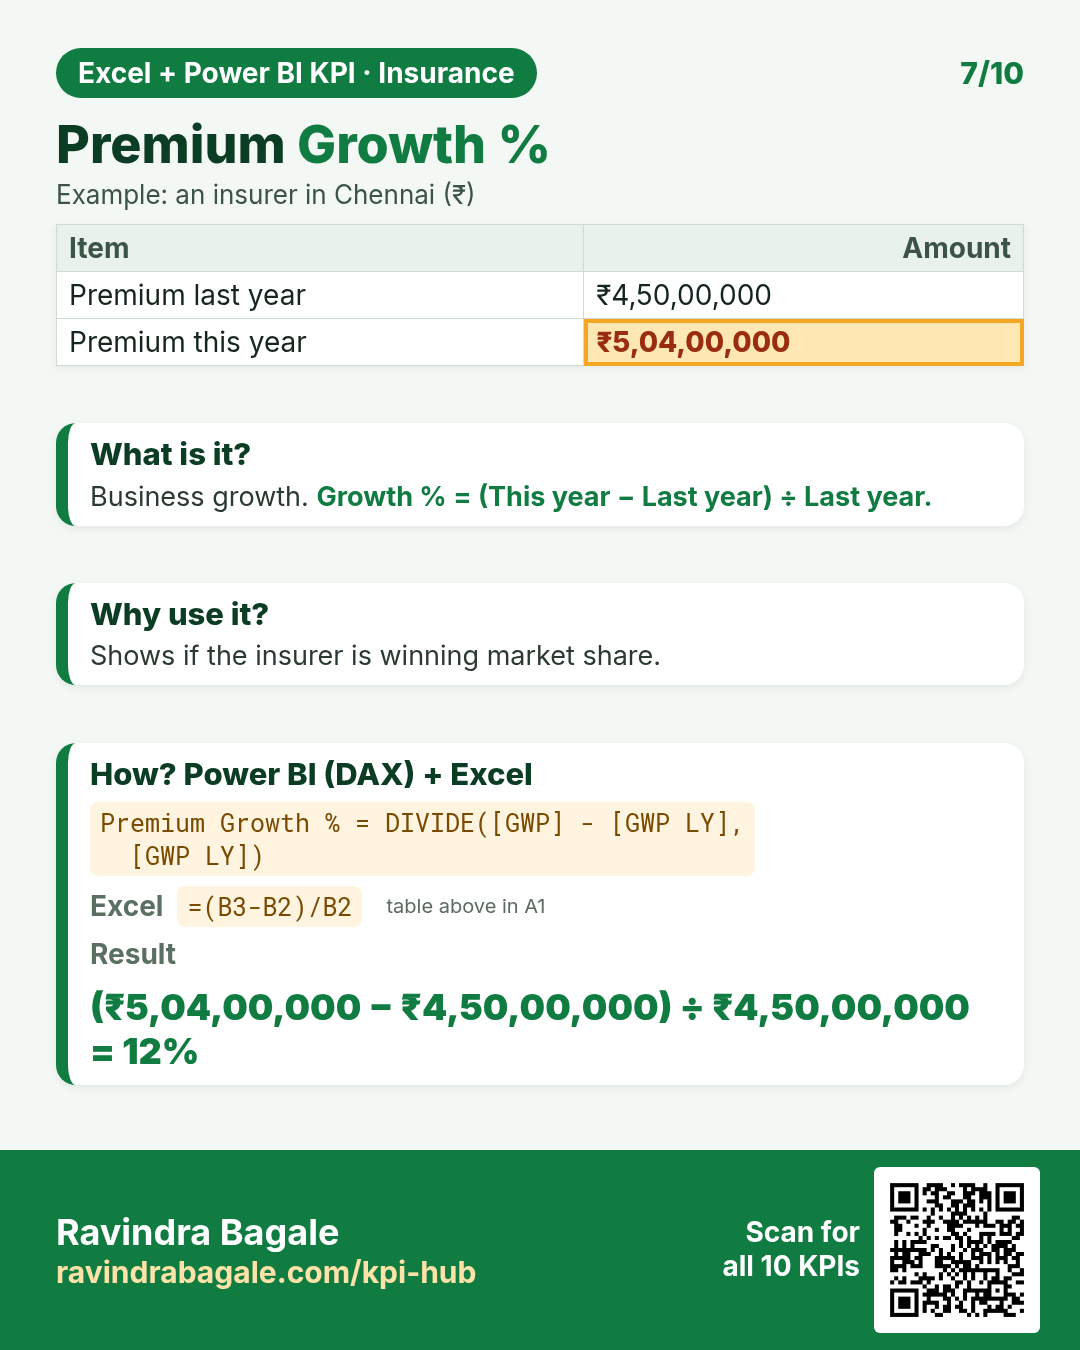
DAX: Premium Growth % = DIVIDE([GWP] - [GWP LY], [GWP LY])Excel: =(B3-B2)/B2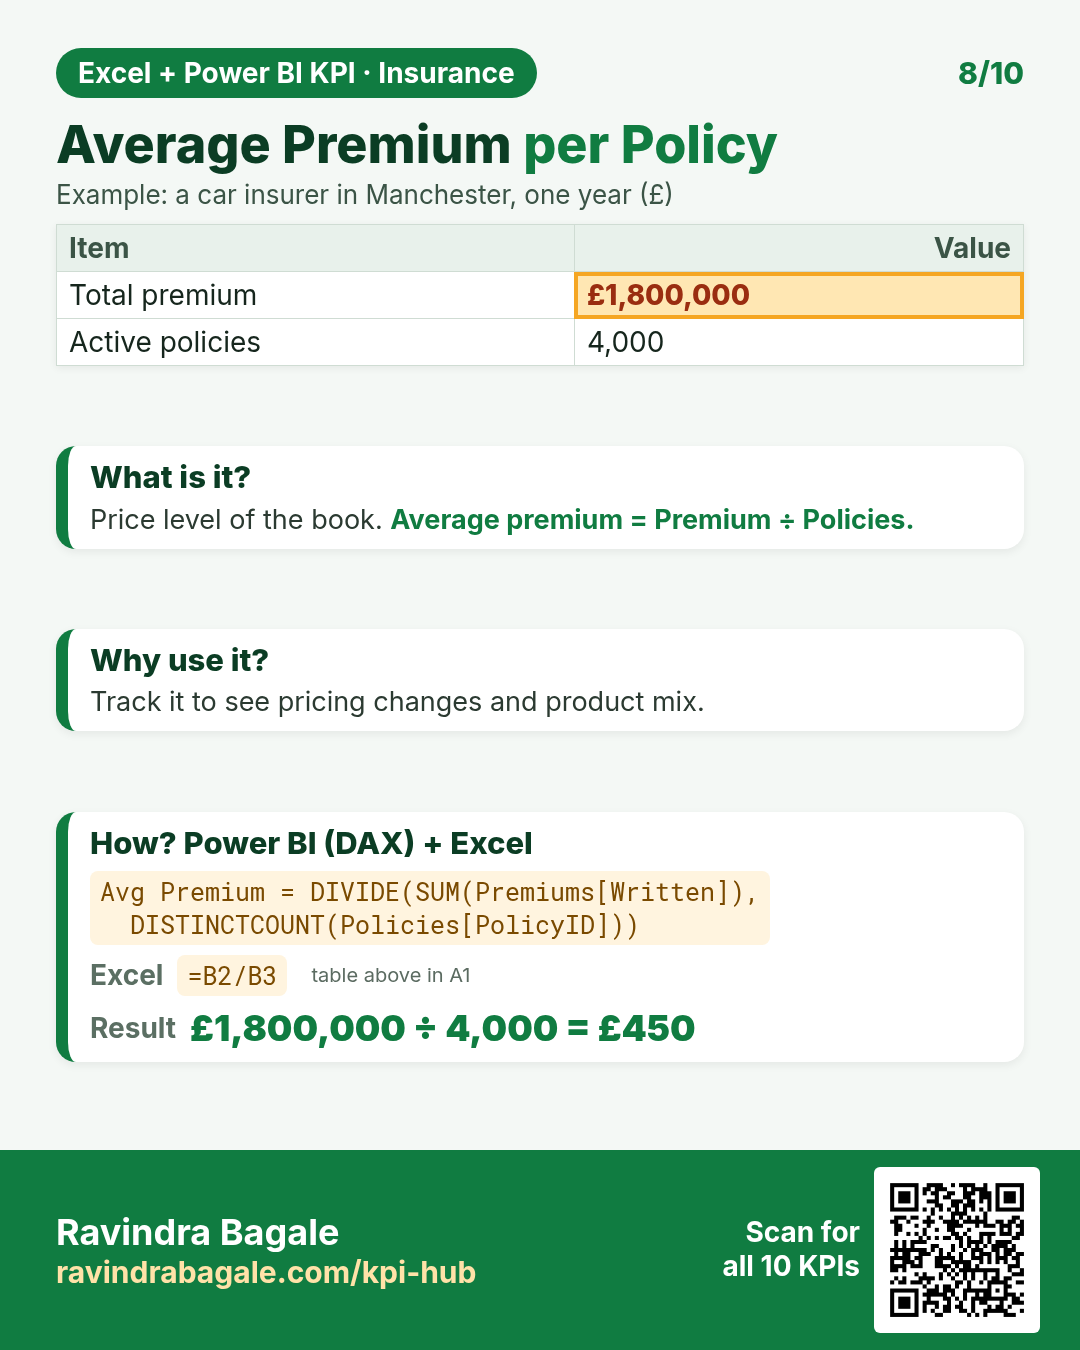
DAX: Avg Premium = DIVIDE(SUM(Premiums[Written]), DISTINCTCOUNT(Policies[PolicyID]))Excel: =B2/B3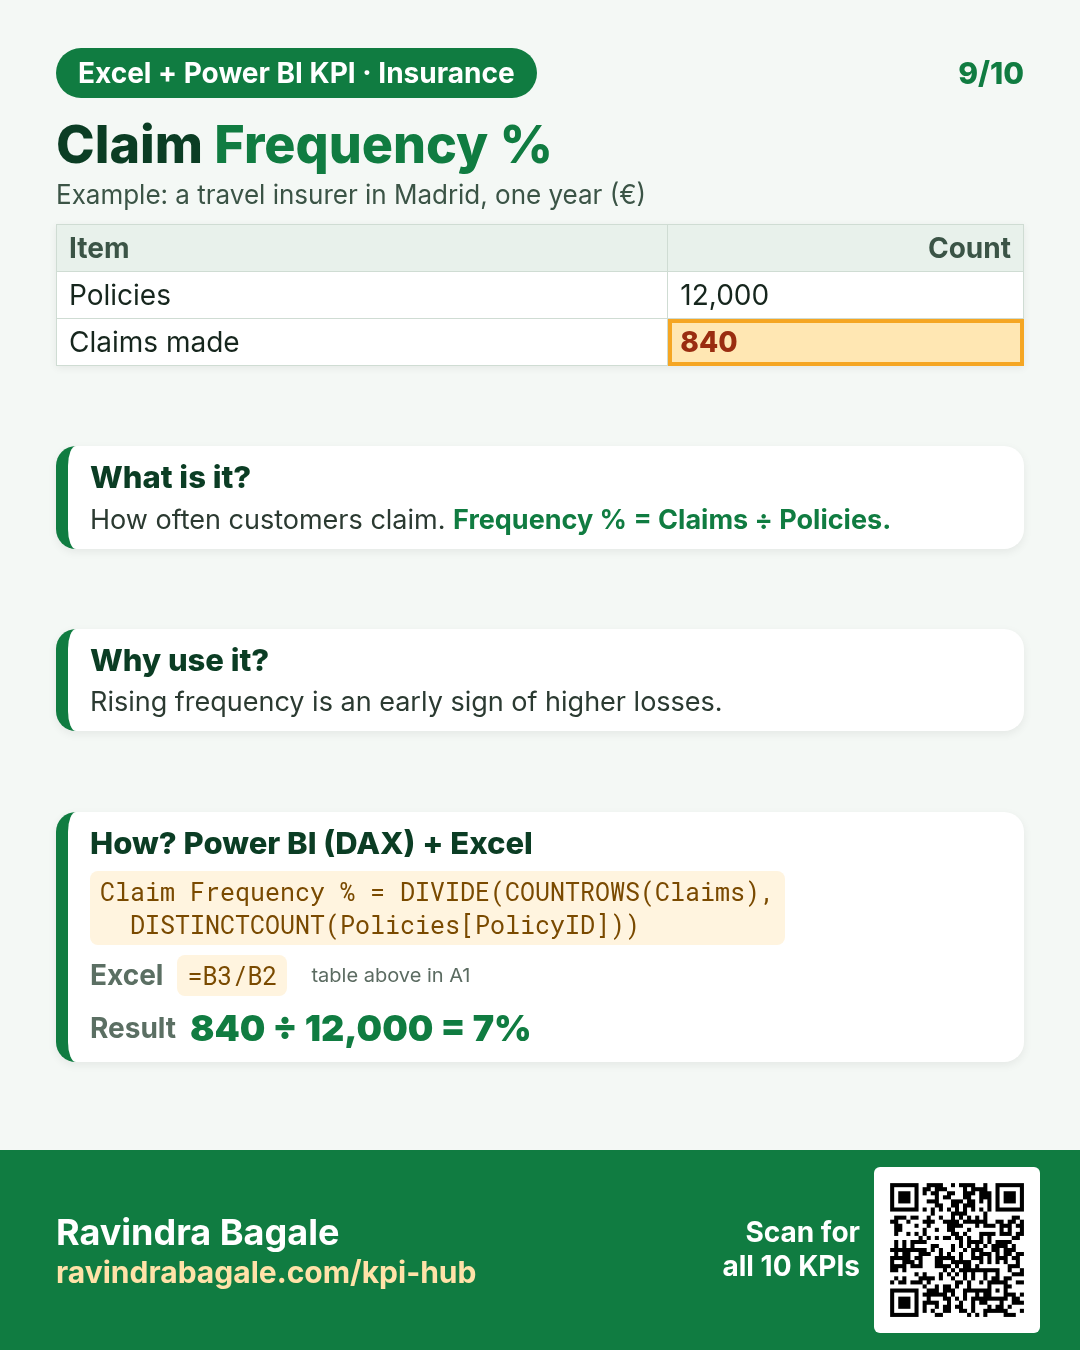
DAX: Claim Frequency % = DIVIDE(COUNTROWS(Claims), DISTINCTCOUNT(Policies[PolicyID]))Excel: =B3/B2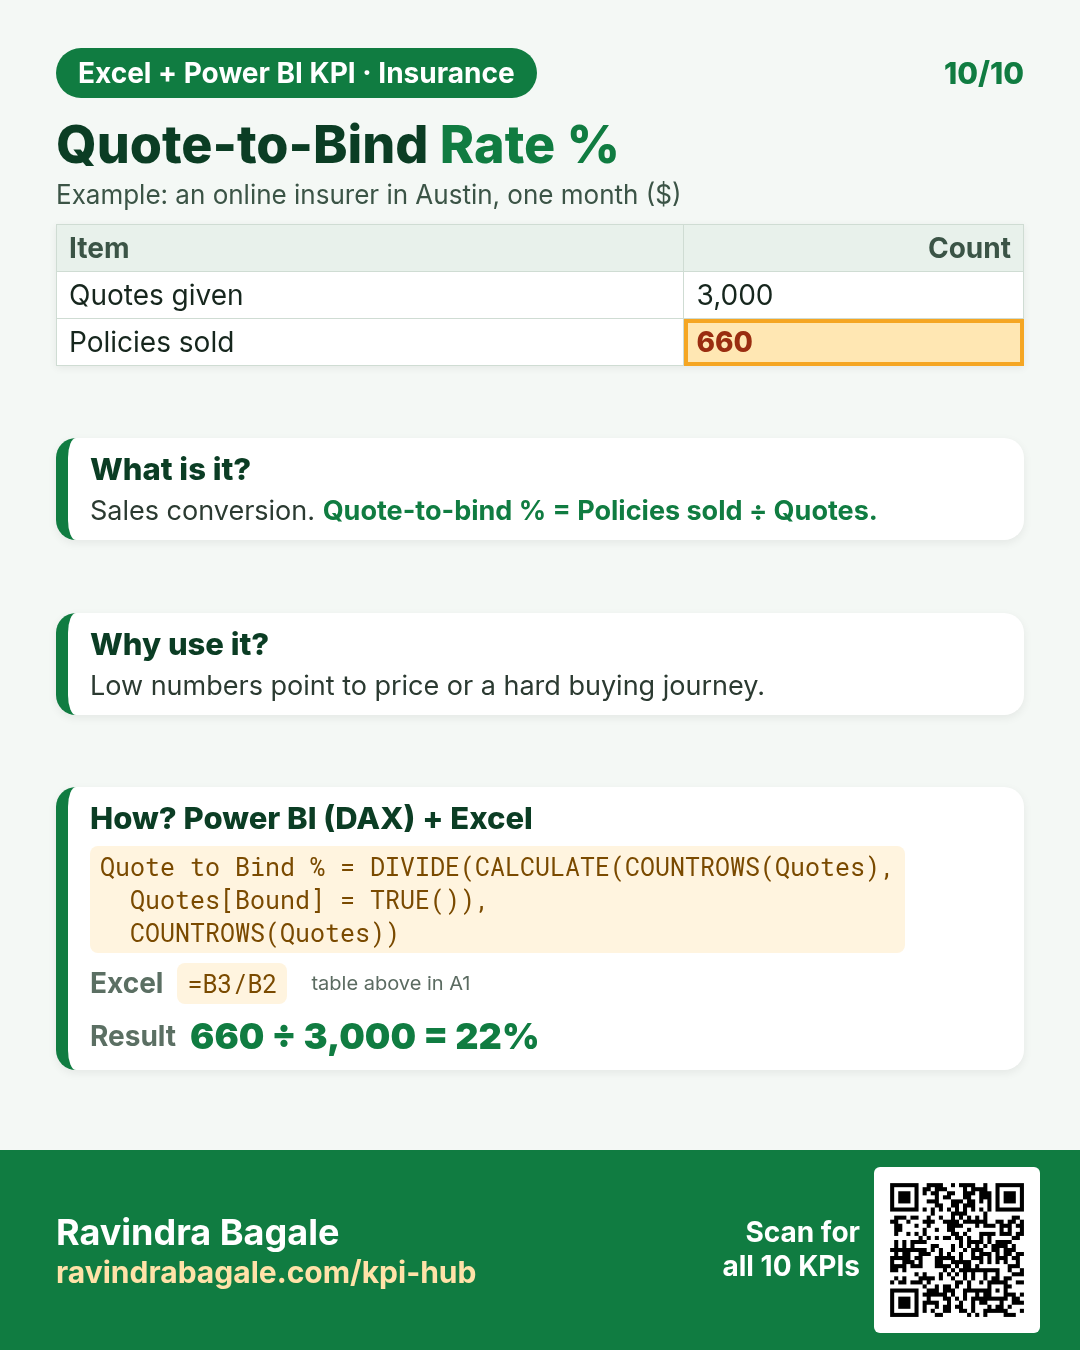
DAX: Quote to Bind % = DIVIDE(CALCULATE(COUNTROWS(Quotes), Quotes[Bound] = TRUE()), COUNTROWS(Quotes))Excel: =B3/B2Quick quiz
1. Loss Ratio %: Premium earned ₹9,00,00,000, Claims paid ₹6,30,00,000. The answer is…
2. Expense Ratio %: Premium earned £10,000,000, Operating and sales expenses £2,500,000. The answer is…
3. Combined Ratio %: Premium earned $8,000,000, Claims $5,200,000, Expenses $2,000,000. The answer is…
4. Which KPI means: “Share of claims the insurer paid.”