Café & Restaurant KPIs in Excel and Power BI
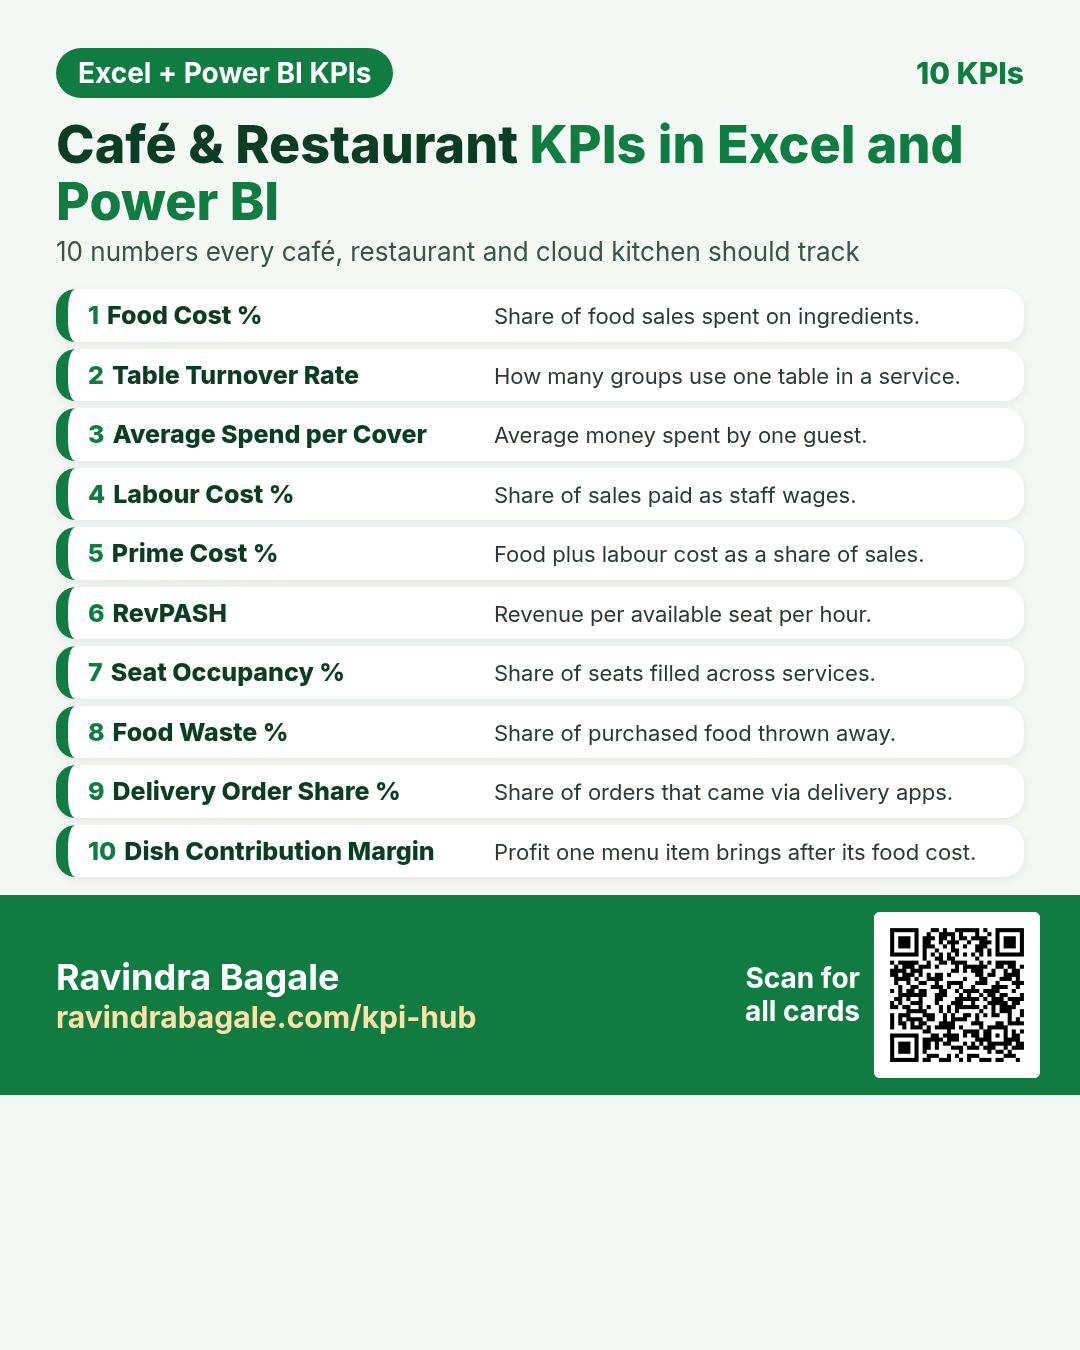
Ten important KPIs for café, restaurant and cloud kitchen. Each card has what it is, why it matters, the Excel formula, the DAX measure and a tiny worked example. Every card shows the Excel formula next to the Power BI DAX measure. For Excel, put the card’s example table in cell A1 (labels in column A, numbers in column B).
About this data: All examples are made-up teaching numbers for food businesses in Pune, London, New York, Paris, Bengaluru, Melbourne, Barcelona, Delhi, Leeds and Hyderabad, in ₹, £, $ and €. Table names (Sales, Orders, Purchases, Payroll, Venue, Tables, Waste) are sample names.
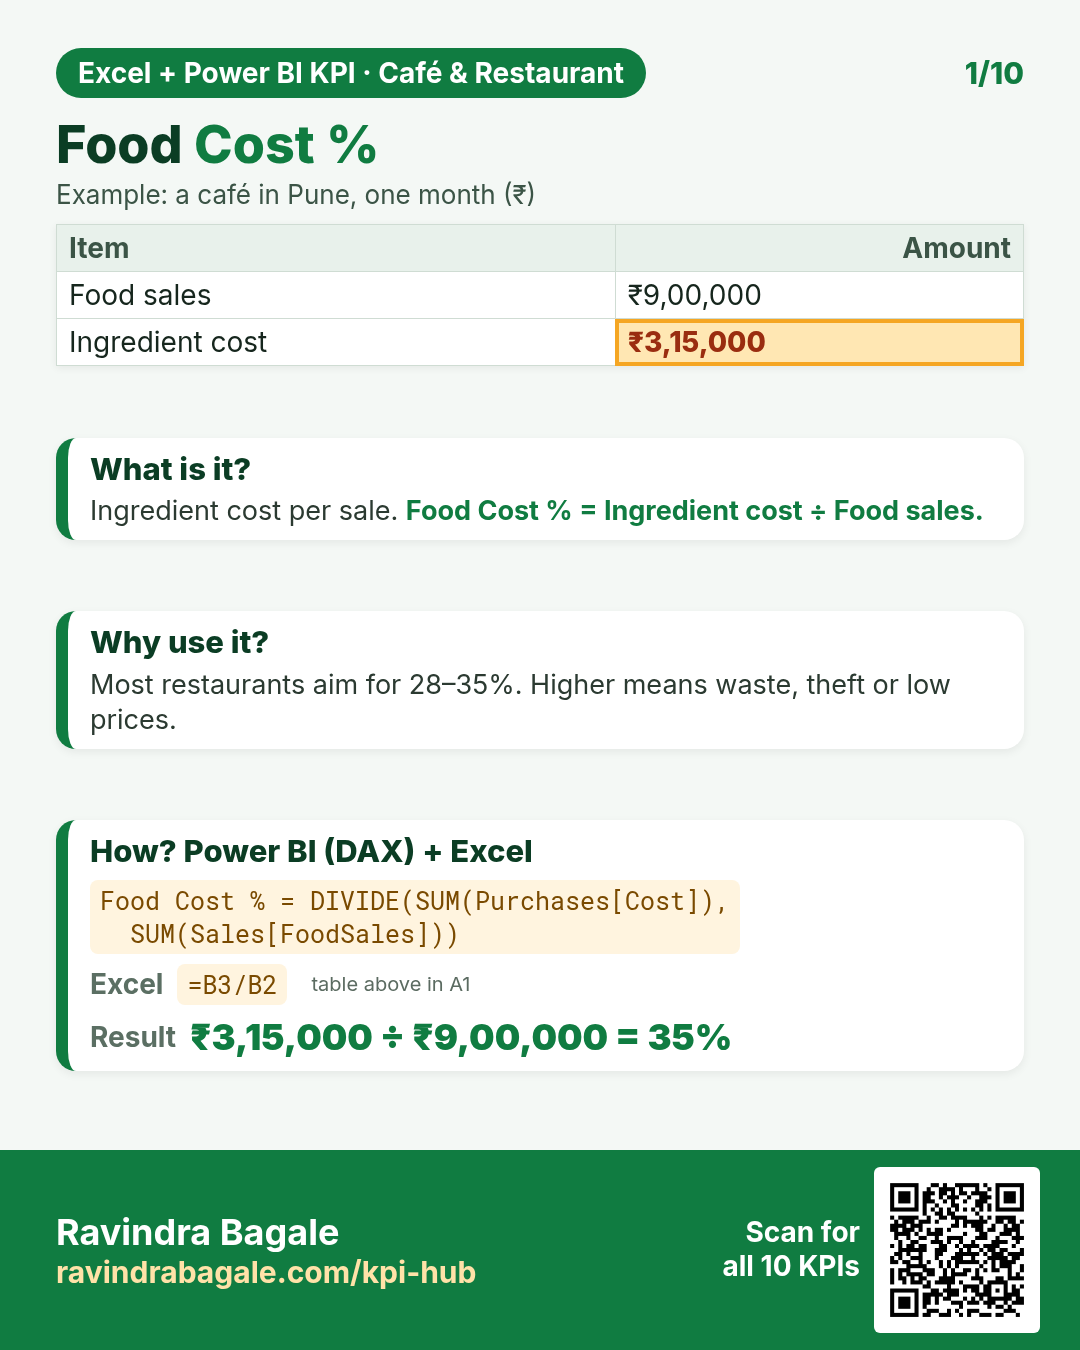
DAX: Food Cost % = DIVIDE(SUM(Purchases[Cost]), SUM(Sales[FoodSales]))Excel: =B3/B2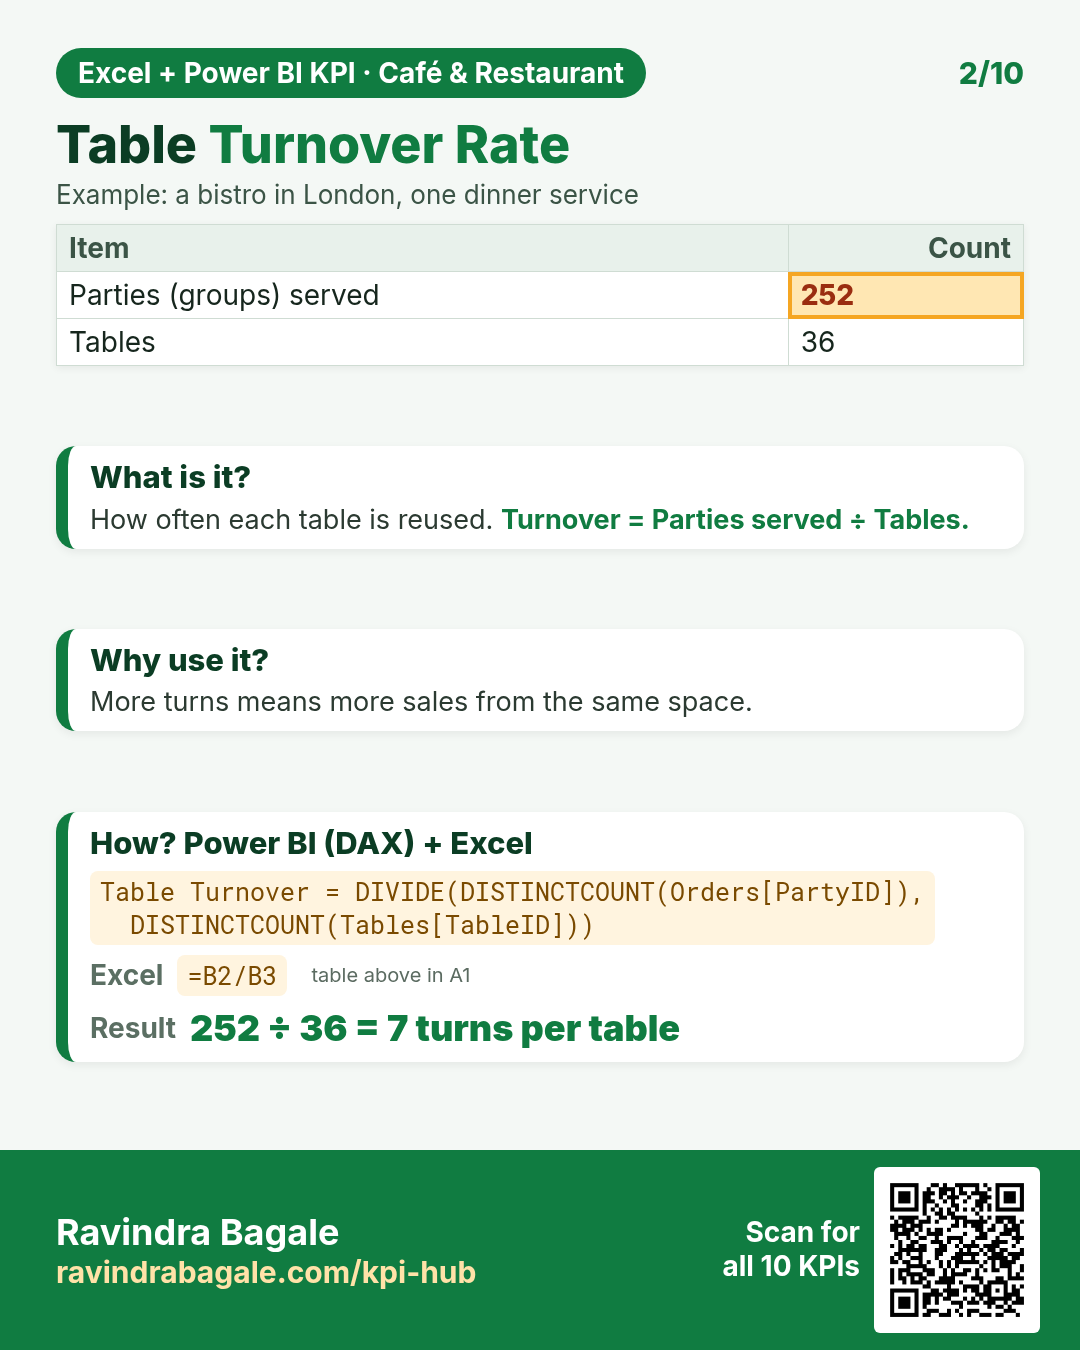
DAX: Table Turnover = DIVIDE(DISTINCTCOUNT(Orders[PartyID]), DISTINCTCOUNT(Tables[TableID]))Excel: =B2/B3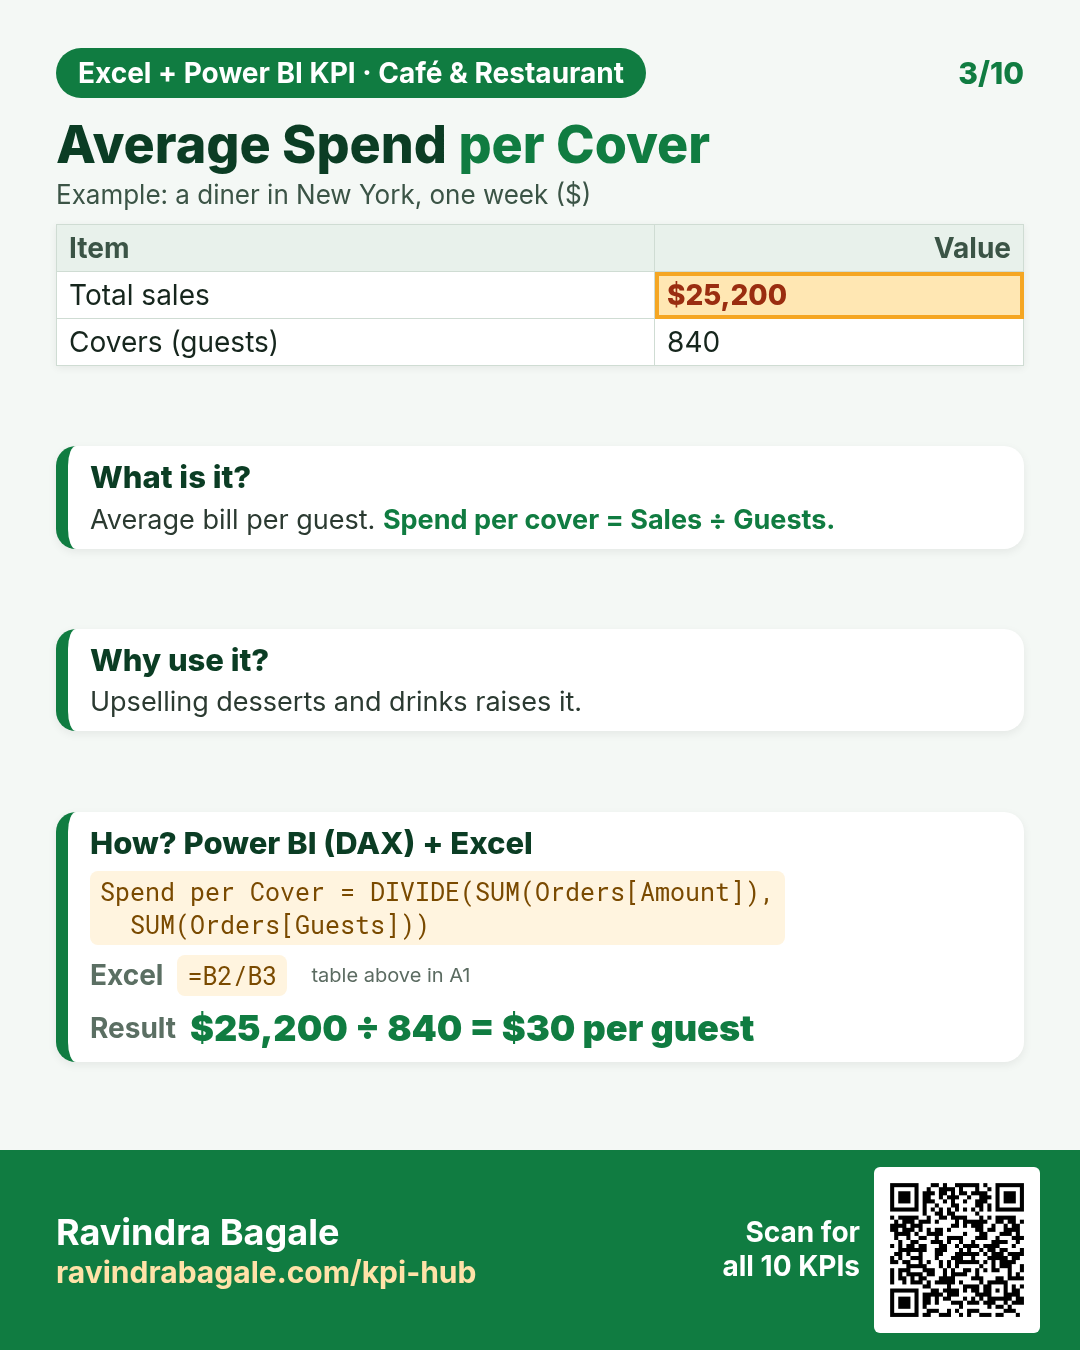
DAX: Spend per Cover = DIVIDE(SUM(Orders[Amount]), SUM(Orders[Guests]))Excel: =B2/B3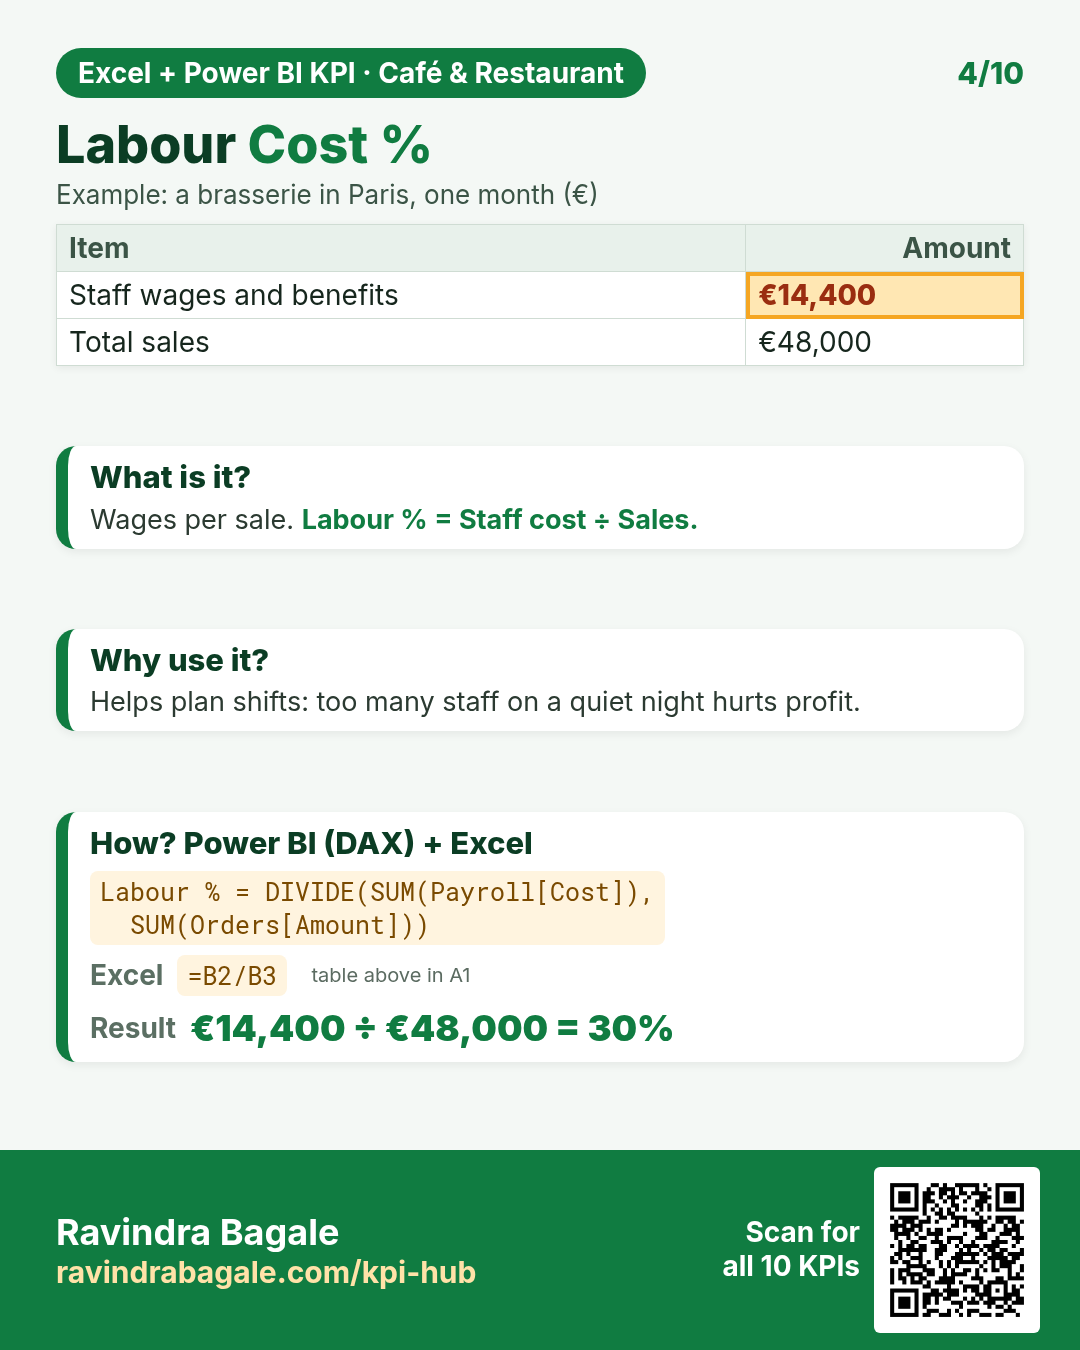
DAX: Labour % = DIVIDE(SUM(Payroll[Cost]), SUM(Orders[Amount]))Excel: =B2/B3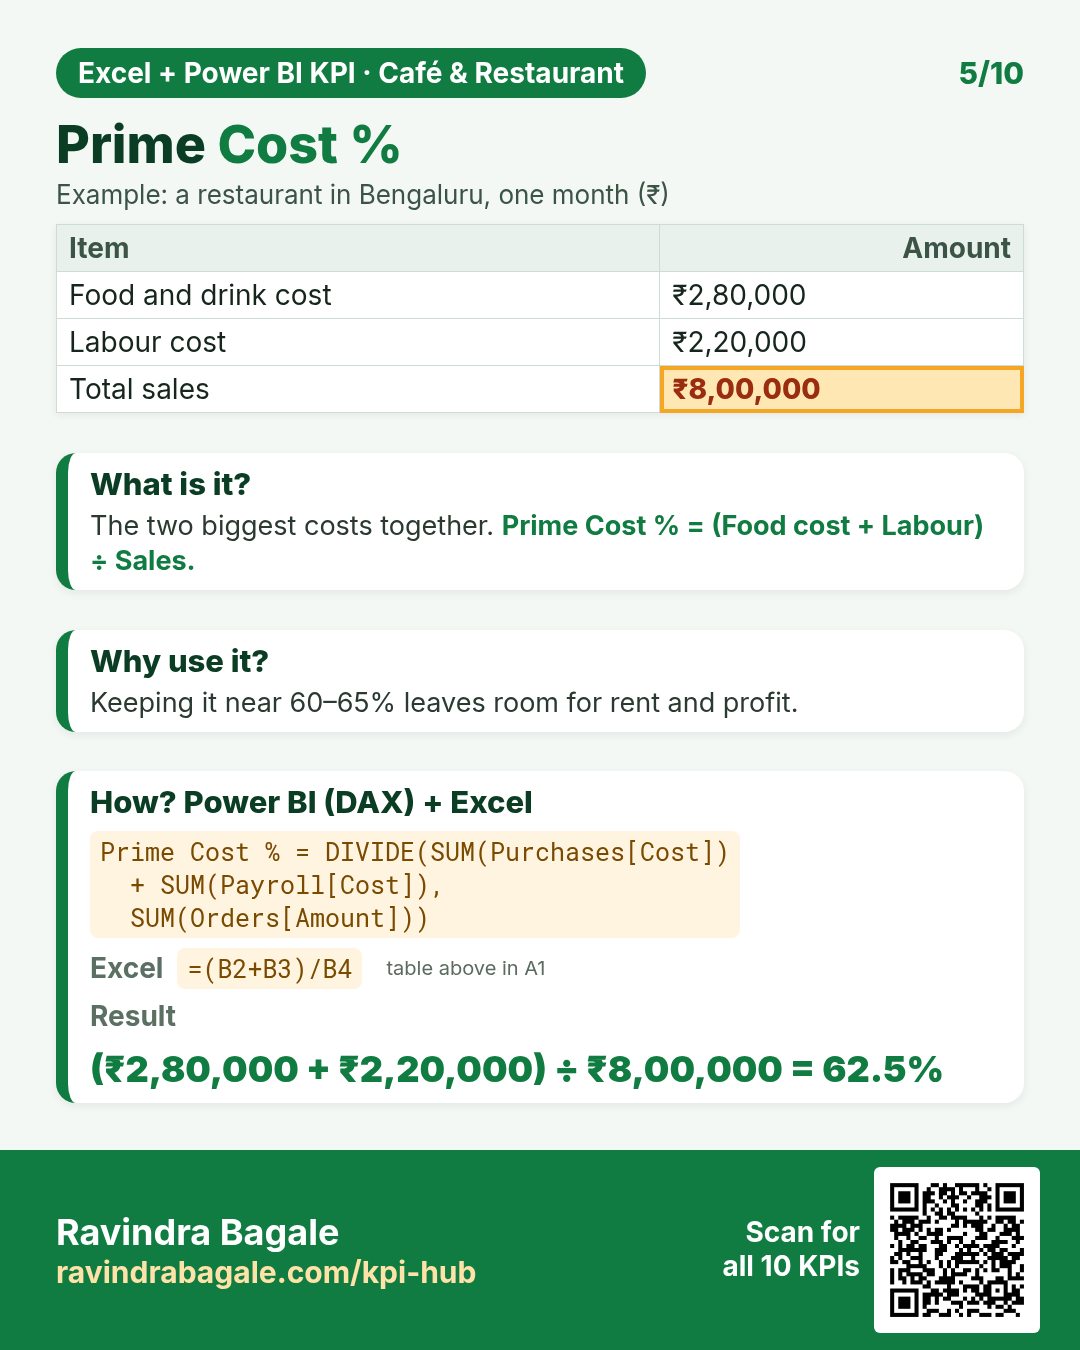
DAX: Prime Cost % = DIVIDE(SUM(Purchases[Cost]) + SUM(Payroll[Cost]), SUM(Orders[Amount]))Excel: =(B2+B3)/B4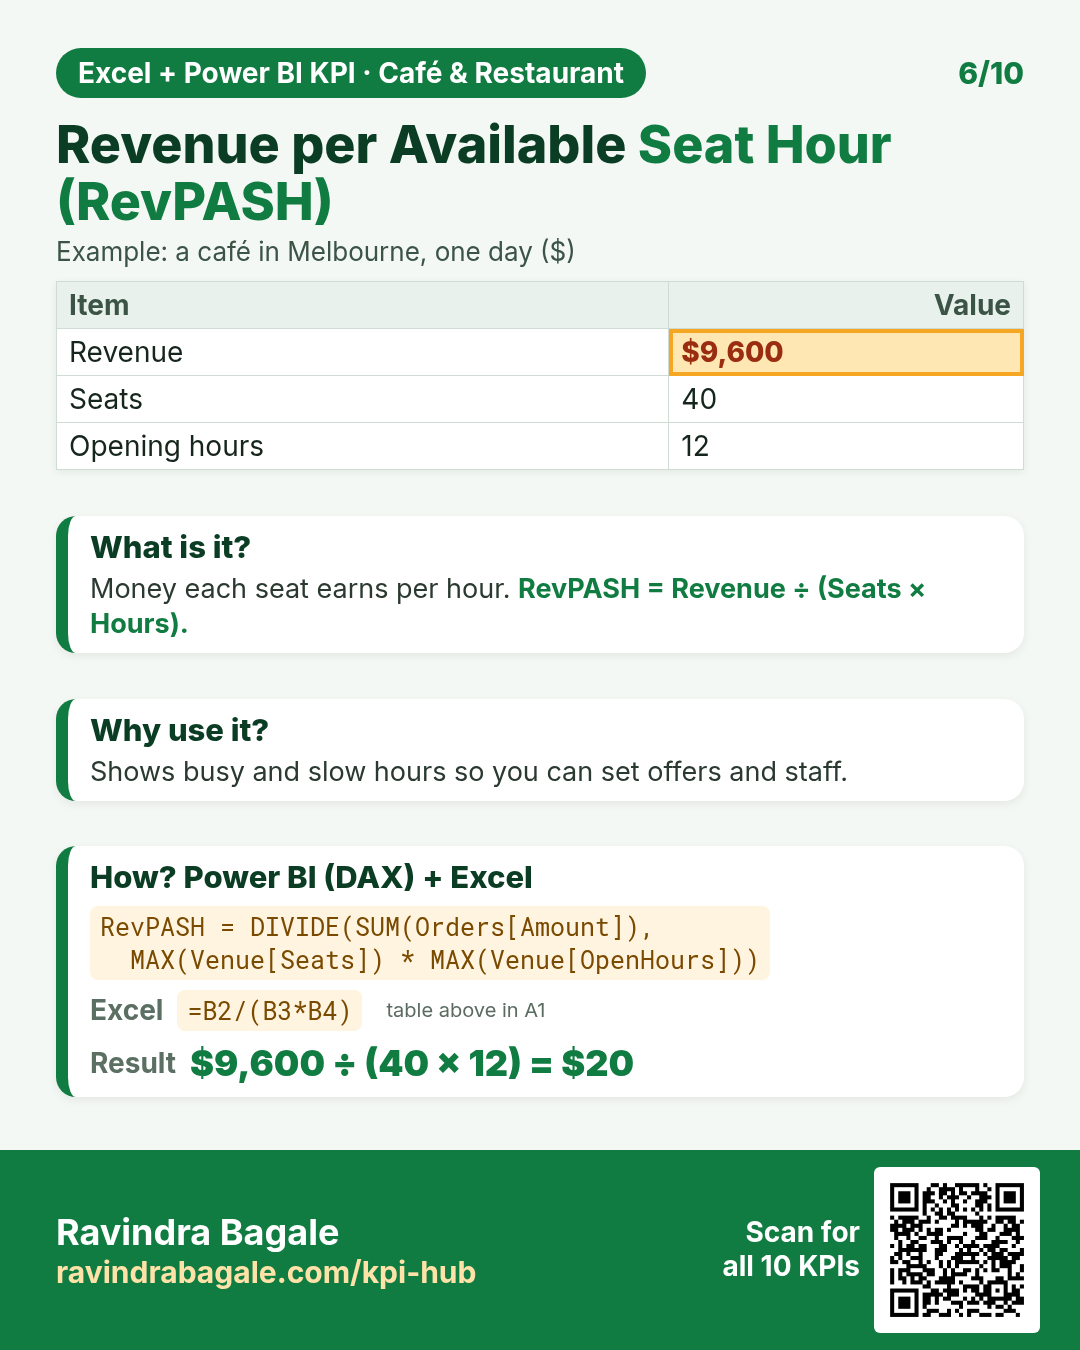
DAX: RevPASH = DIVIDE(SUM(Orders[Amount]), MAX(Venue[Seats]) * MAX(Venue[OpenHours]))Excel: =B2/(B3*B4)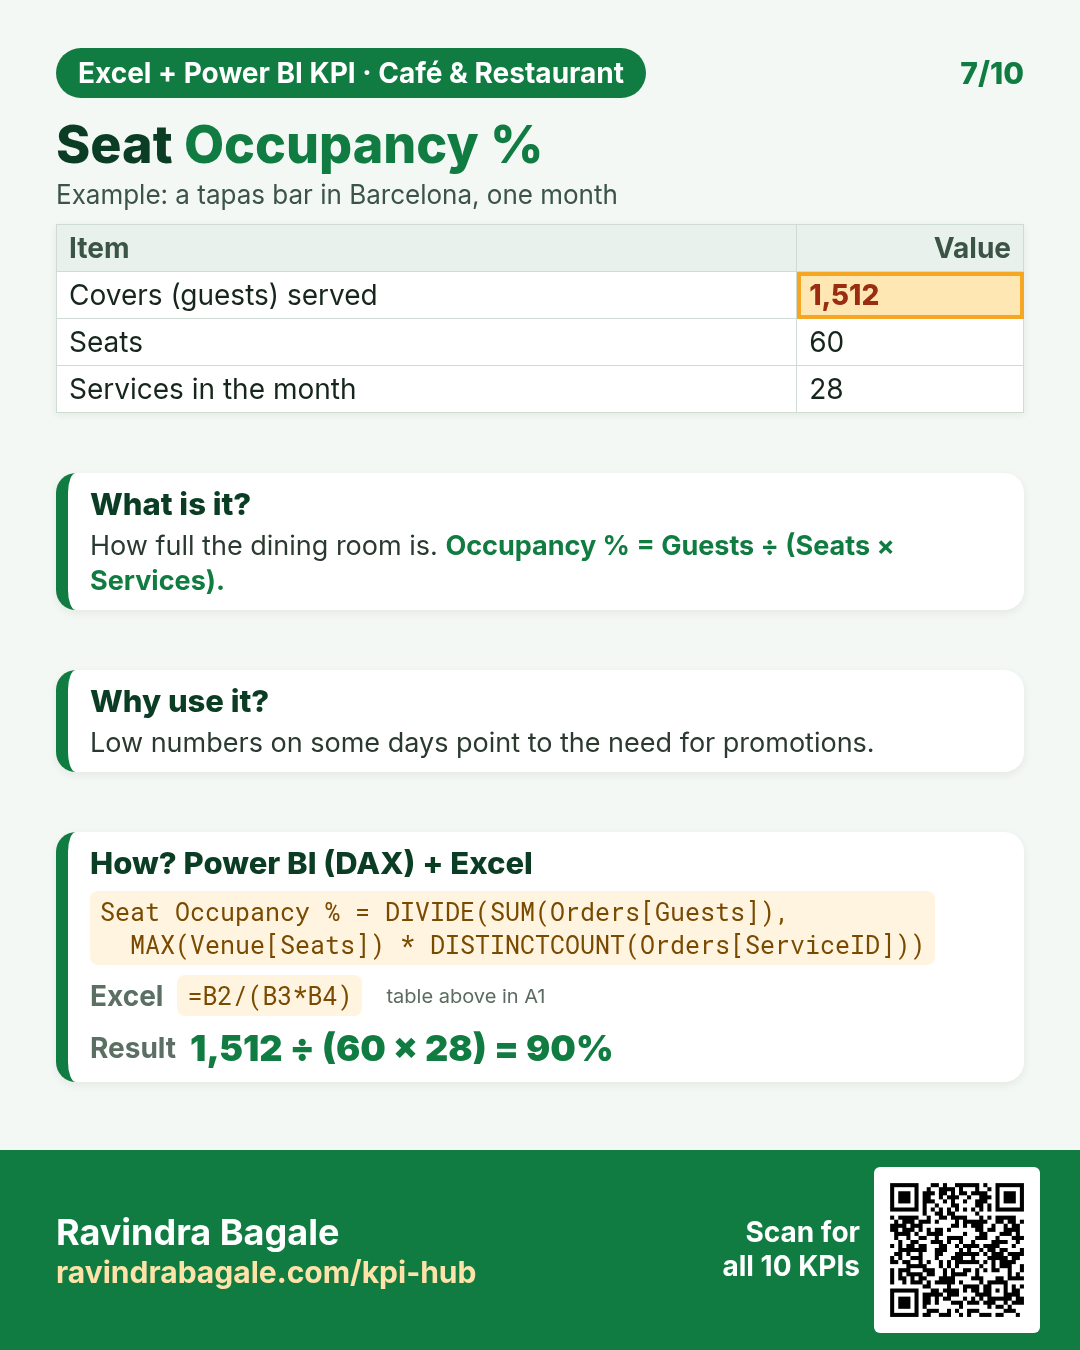
DAX: Seat Occupancy % = DIVIDE(SUM(Orders[Guests]), MAX(Venue[Seats]) * DISTINCTCOUNT(Orders[ServiceID]))Excel: =B2/(B3*B4)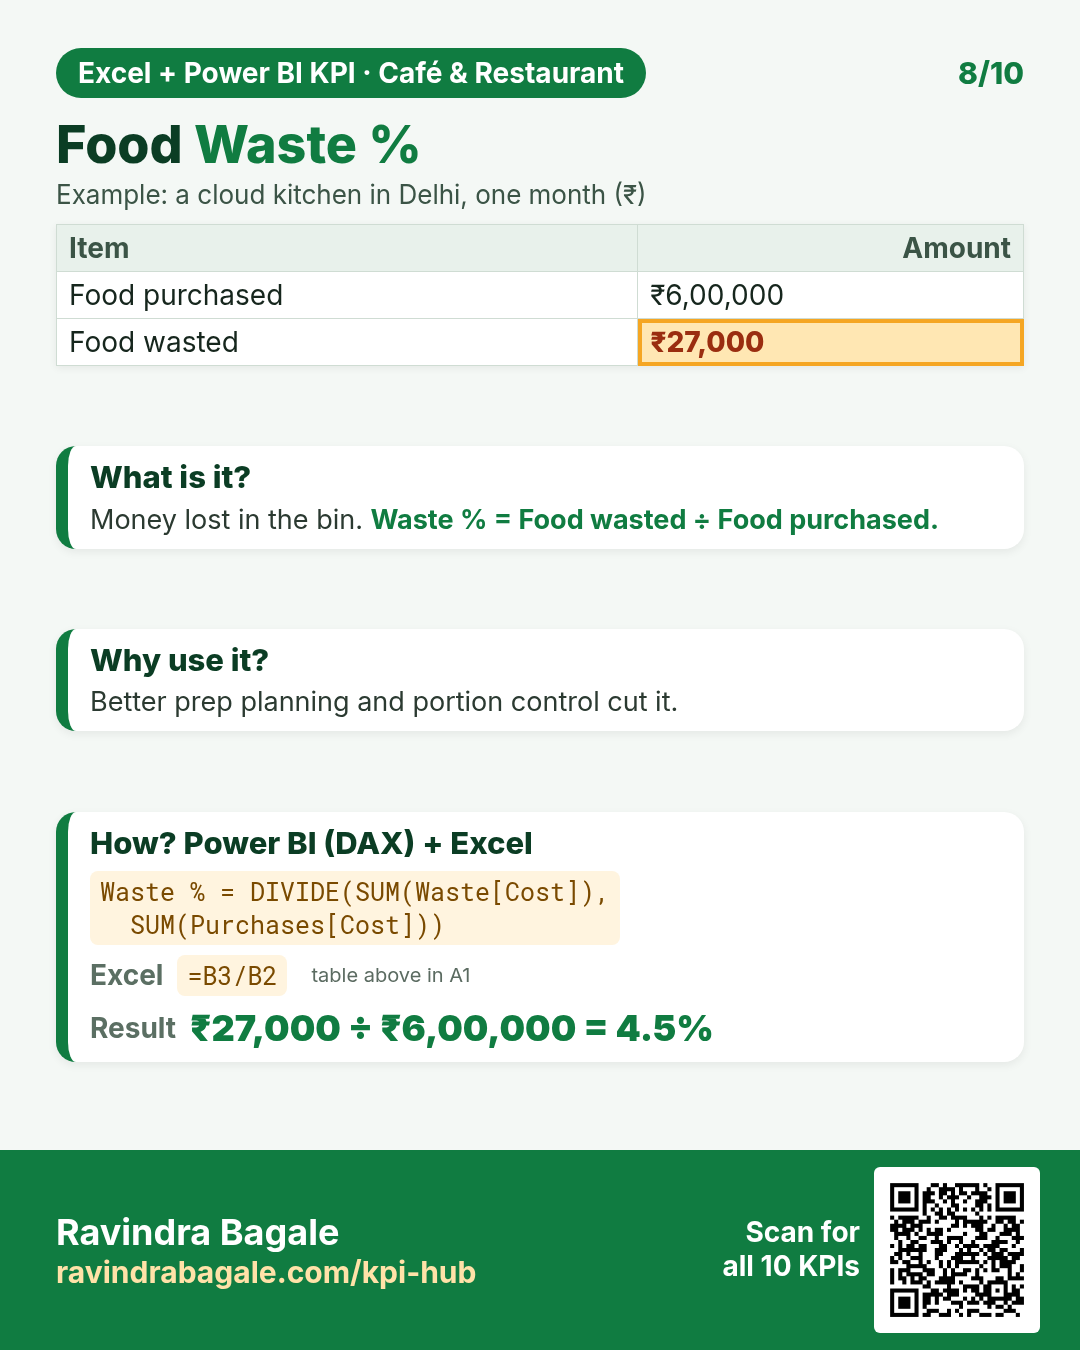
DAX: Waste % = DIVIDE(SUM(Waste[Cost]), SUM(Purchases[Cost]))Excel: =B3/B2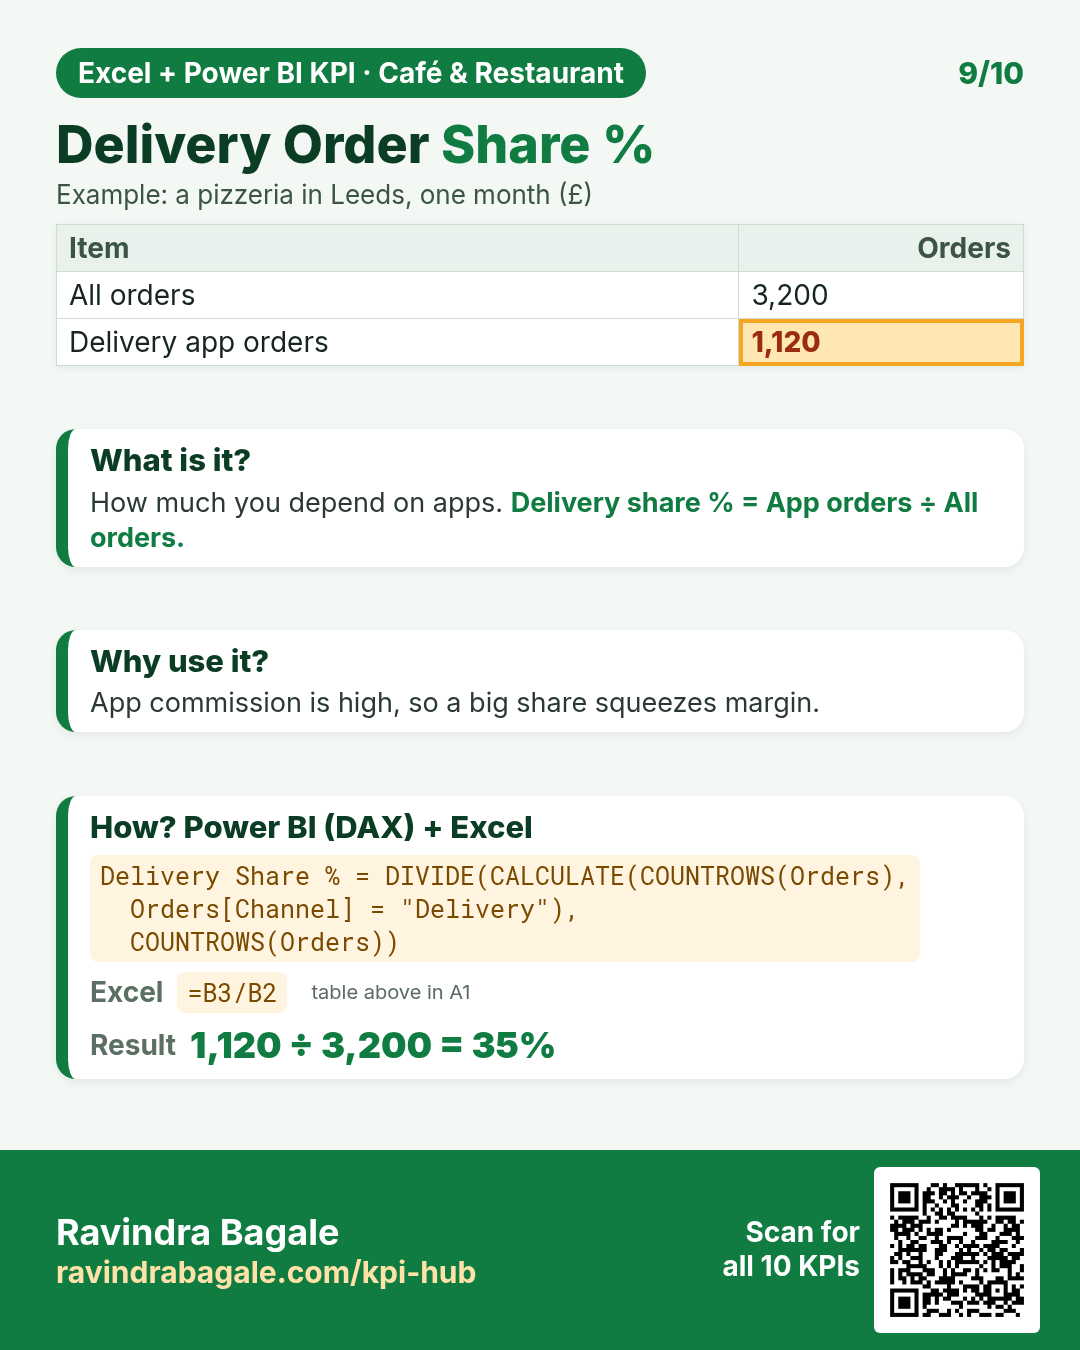
DAX: Delivery Share % = DIVIDE(CALCULATE(COUNTROWS(Orders), Orders[Channel] = "Delivery"), COUNTROWS(Orders))Excel: =B3/B2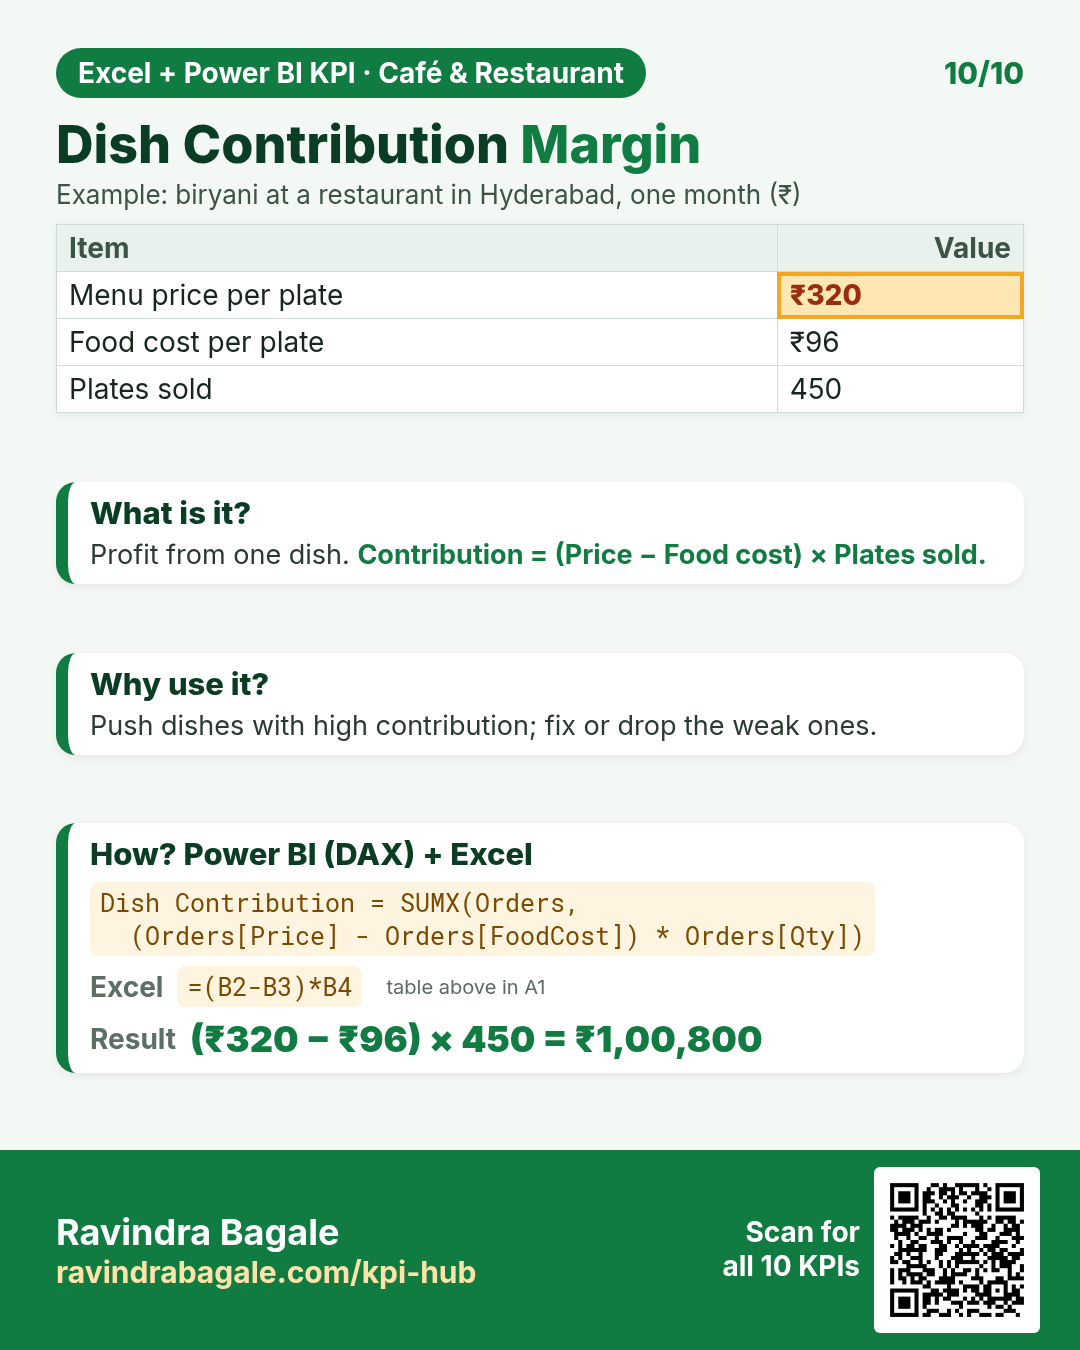
DAX: Dish Contribution = SUMX(Orders, (Orders[Price] - Orders[FoodCost]) * Orders[Qty])Excel: =(B2-B3)*B4Quick quiz
1. Food Cost %: Food sales ₹9,00,000, Ingredient cost ₹3,15,000. The answer is…
2. Table Turnover Rate: Parties (groups) served 252, Tables 36. The answer is…
3. Average Spend per Cover: Total sales $25,200, Covers (guests) 840. The answer is…
4. Which KPI means: “Share of sales paid as staff wages.”