This KPI Hub has moved to one shared hub for Excel and Power BI. Open the new KPI Hub →
Retail Store KPIs in Power BI
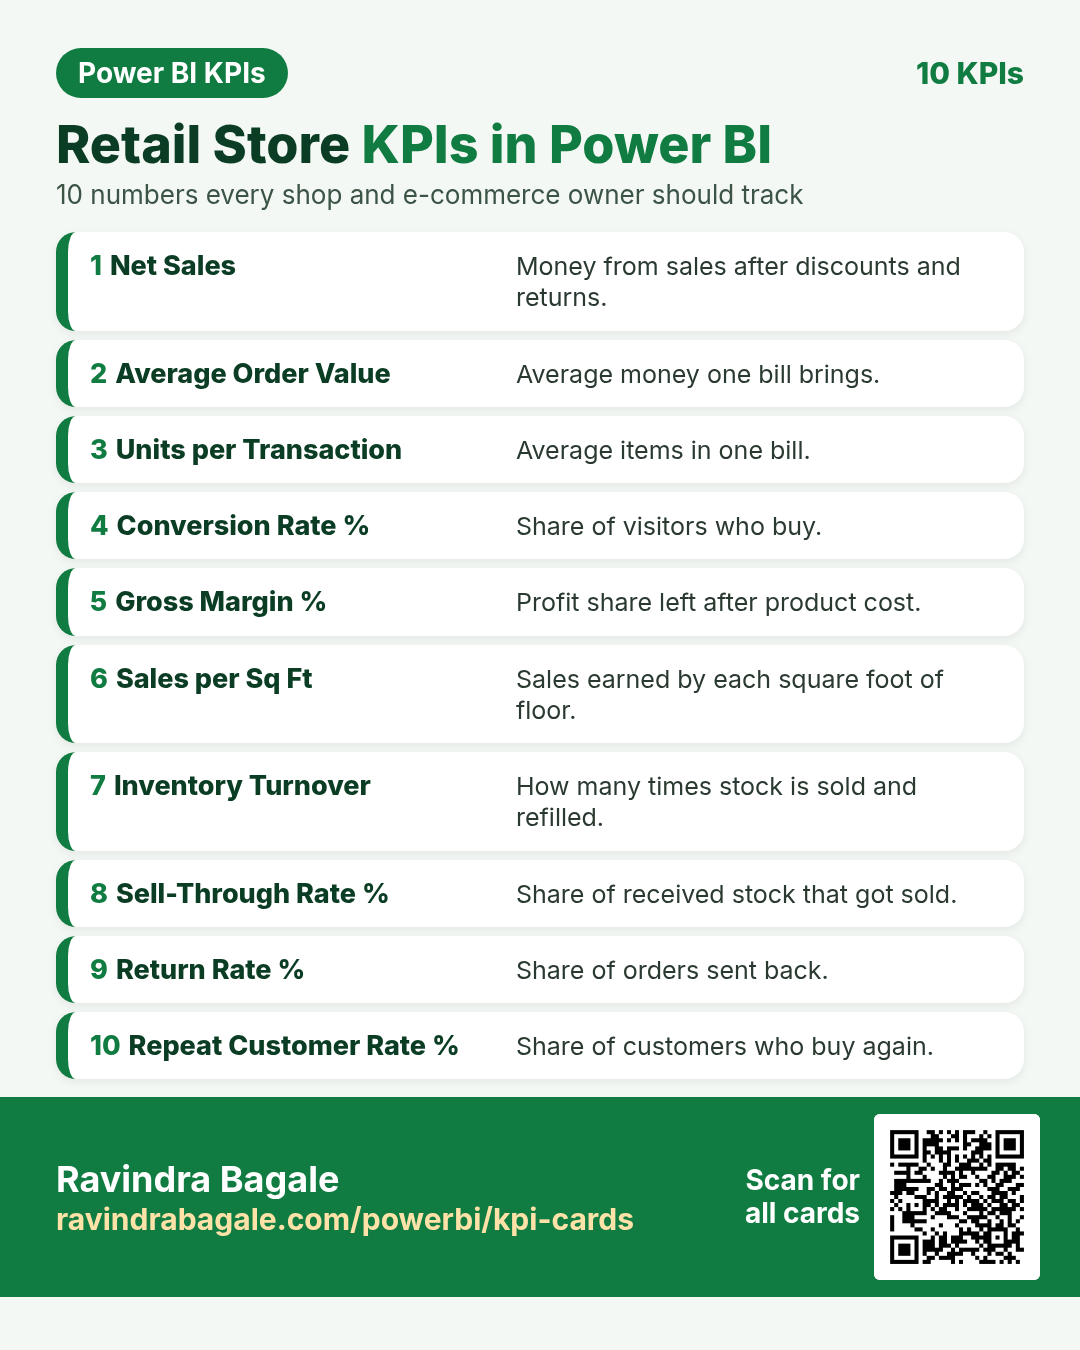
Ten important KPIs for a shop or online store. Each card has what it is, why it matters, the DAX measure and a tiny worked example. Tap a card to open it full size, or scan its QR code.
About this data: All examples are made-up teaching numbers for shops in Mumbai, Leeds, Chennai, New York, Bengaluru, Dublin, Hyderabad, Toronto, Manchester and Pune, in ₹, £, $ and €. Table and column names (Sales, Traffic, Stock, Receipts, Returns, Store) are sample names; change them to match your model.
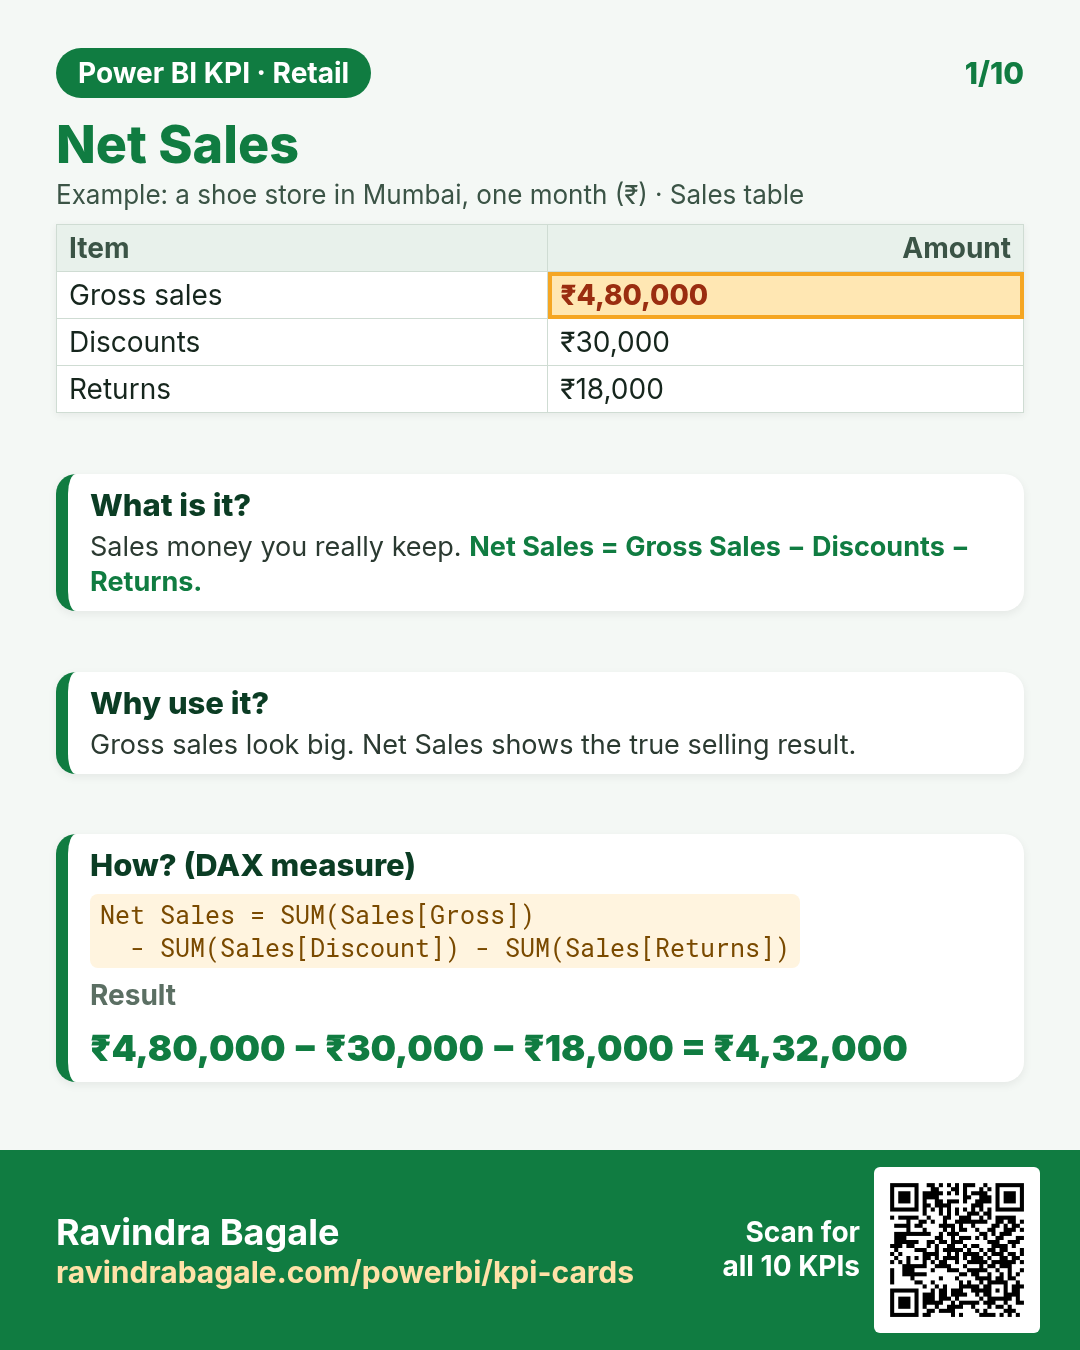
Net Sales = SUM(Sales[Gross]) - SUM(Sales[Discount]) - SUM(Sales[Returns])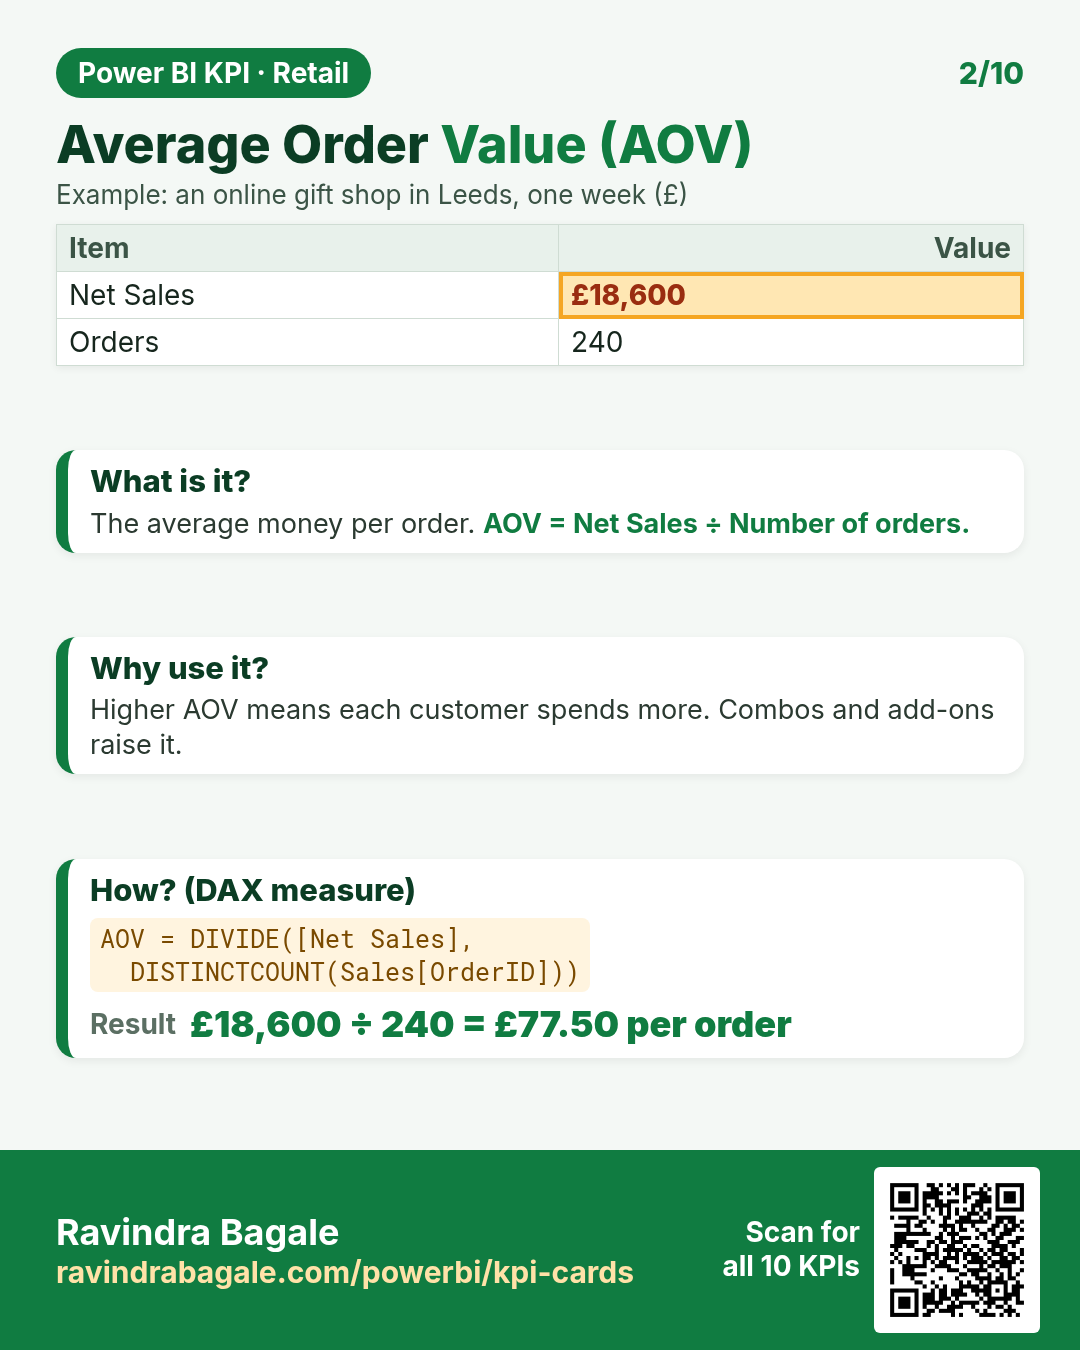
AOV = DIVIDE([Net Sales], DISTINCTCOUNT(Sales[OrderID]))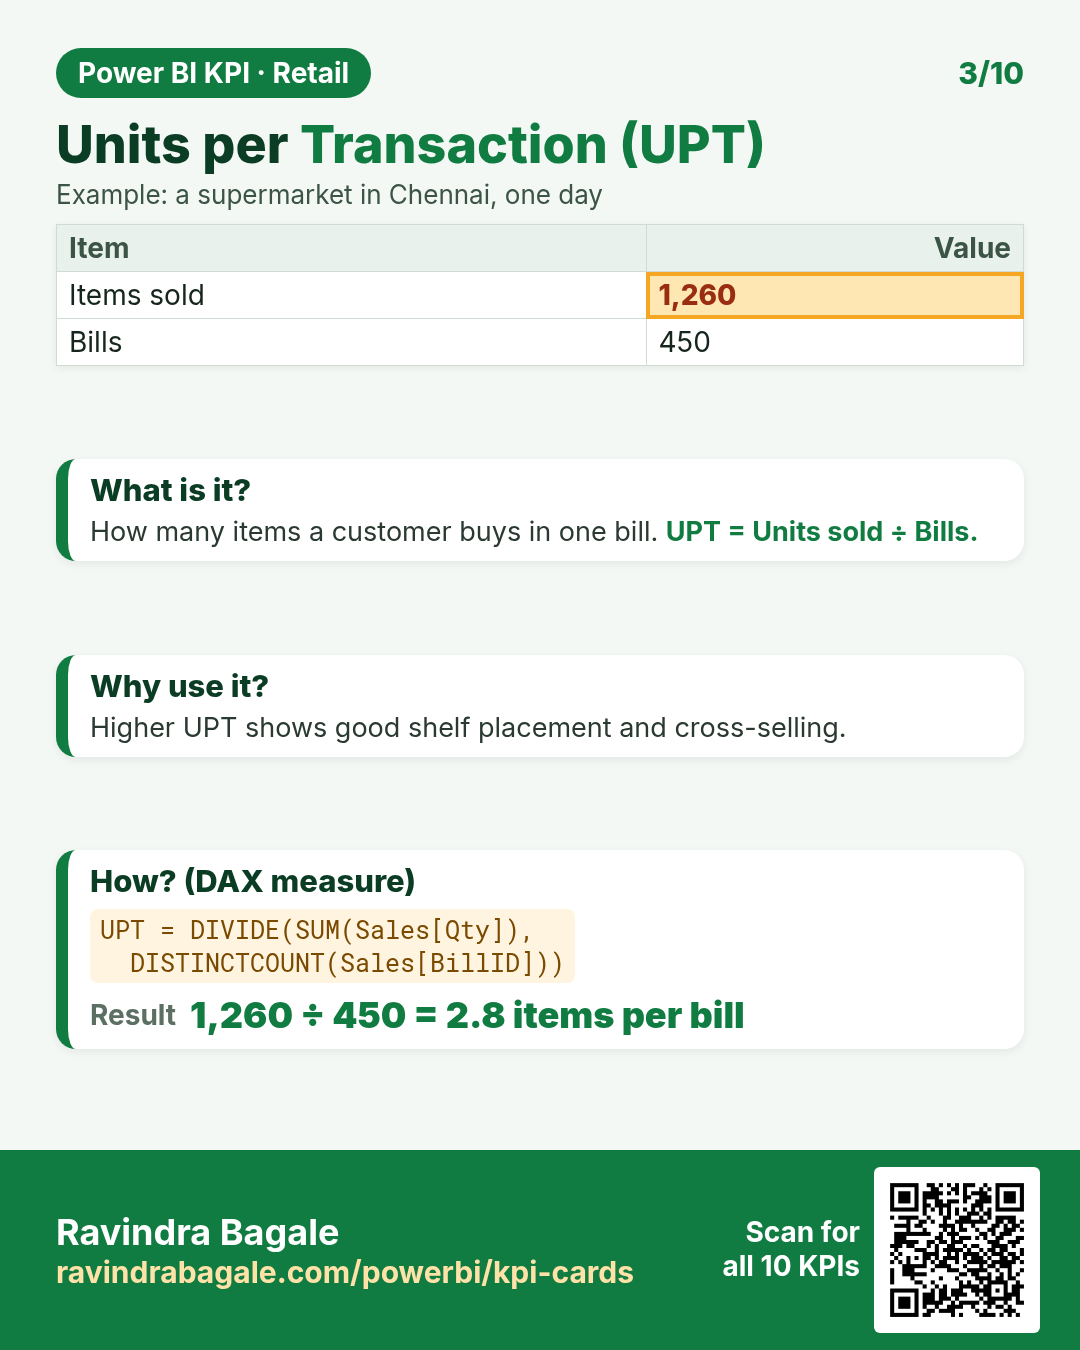
UPT = DIVIDE(SUM(Sales[Qty]), DISTINCTCOUNT(Sales[BillID]))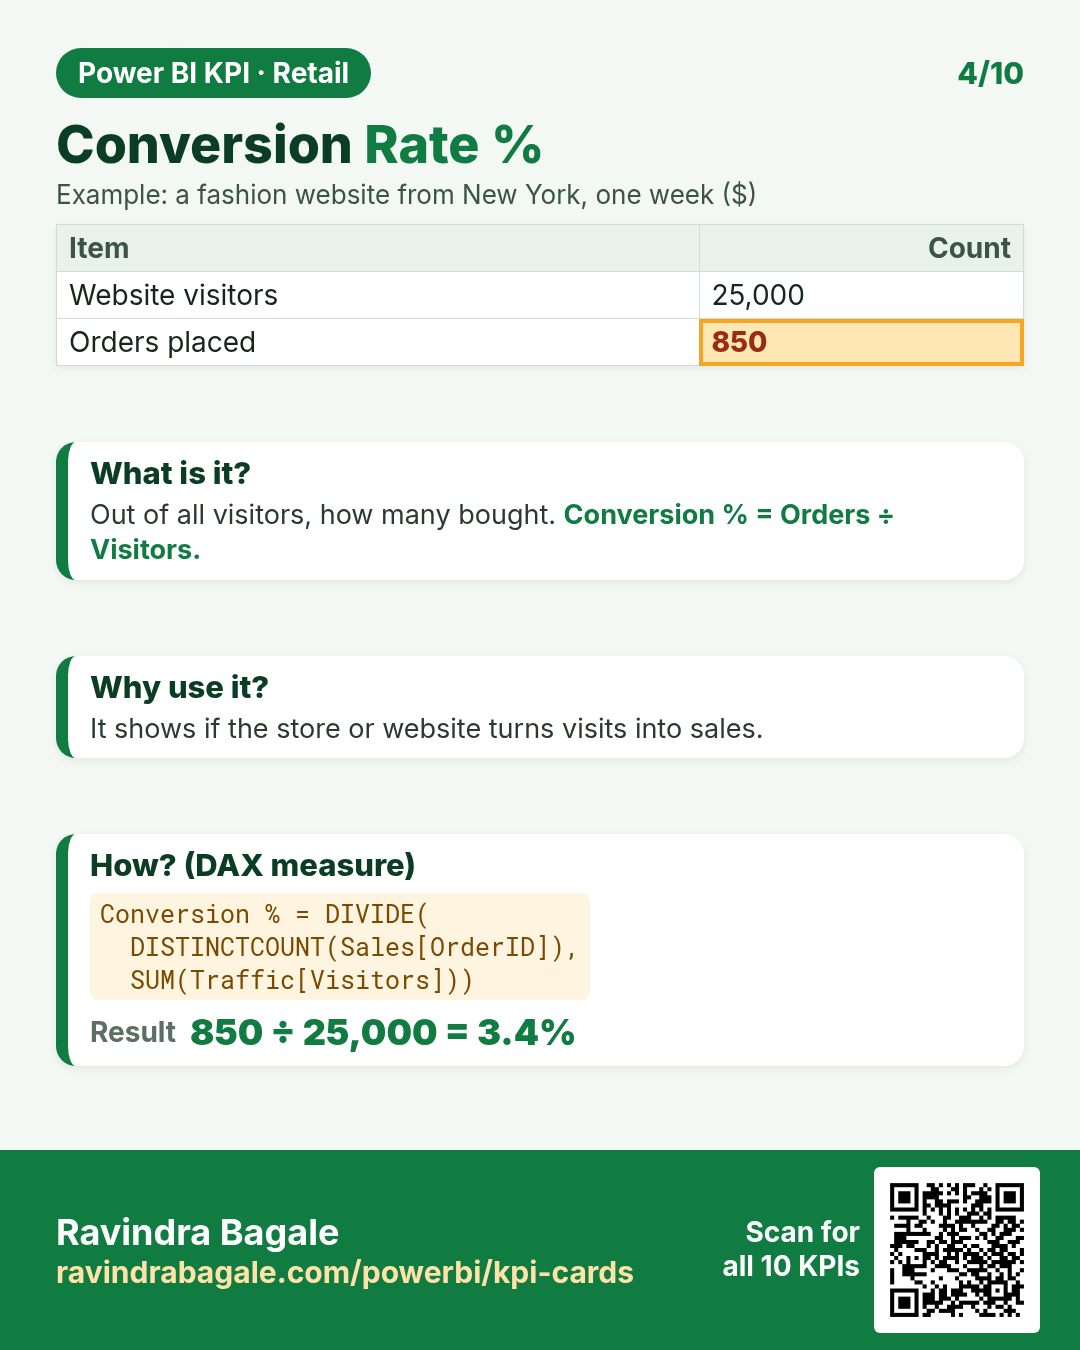
Conversion % = DIVIDE( DISTINCTCOUNT(Sales[OrderID]), SUM(Traffic[Visitors]))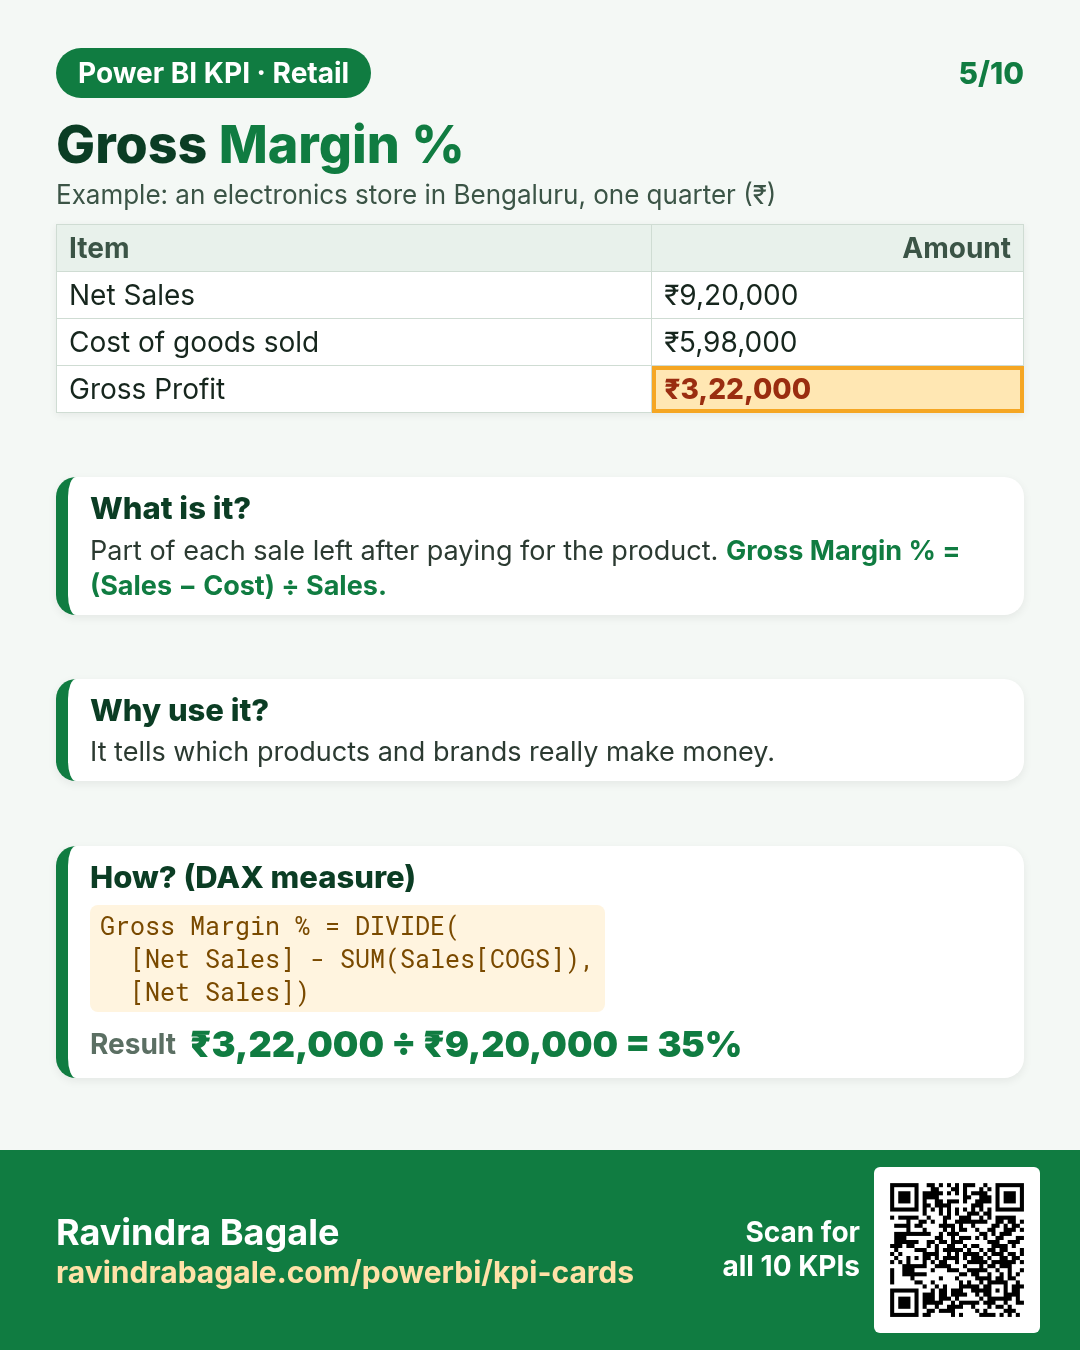
Gross Margin % = DIVIDE( [Net Sales] - SUM(Sales[COGS]), [Net Sales])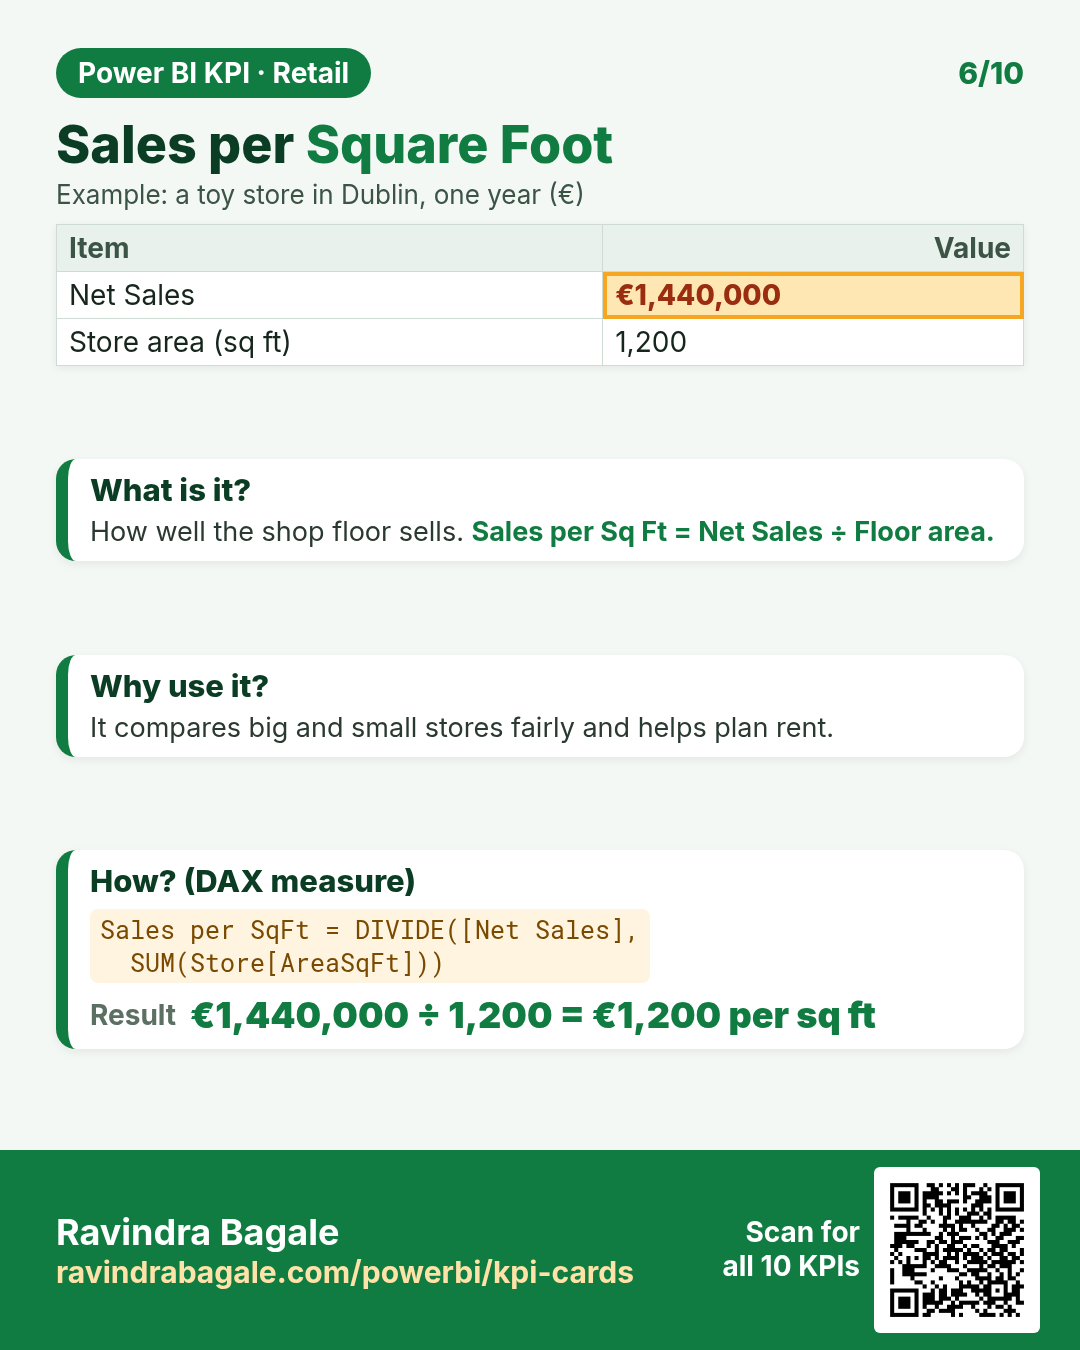
Sales per SqFt = DIVIDE([Net Sales], SUM(Store[AreaSqFt]))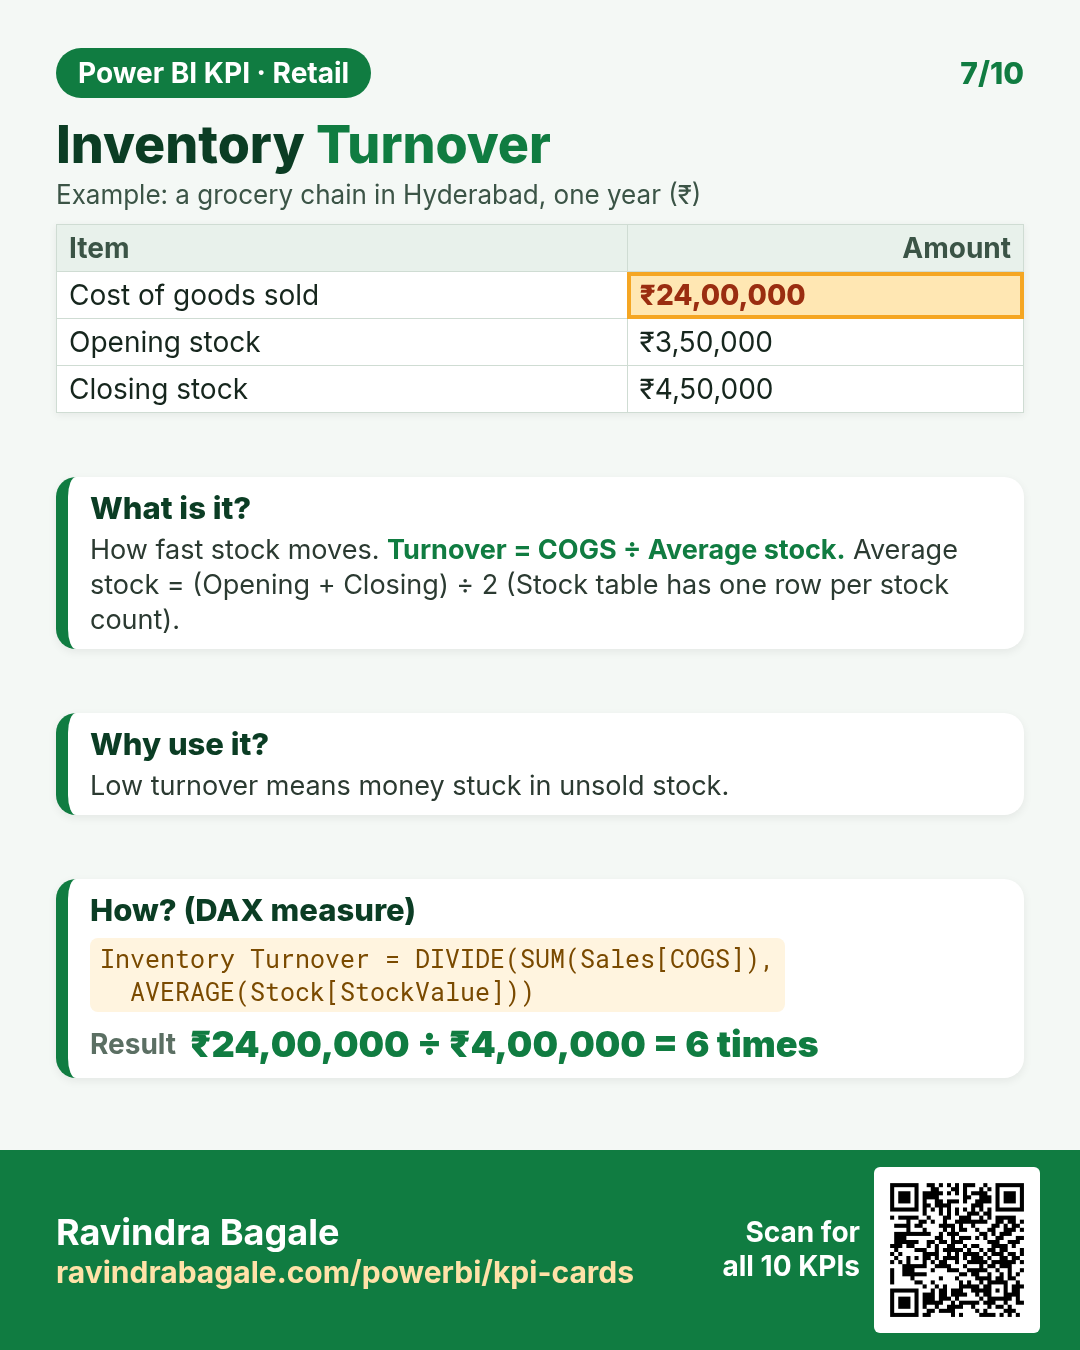
Inventory Turnover = DIVIDE(SUM(Sales[COGS]), AVERAGE(Stock[StockValue]))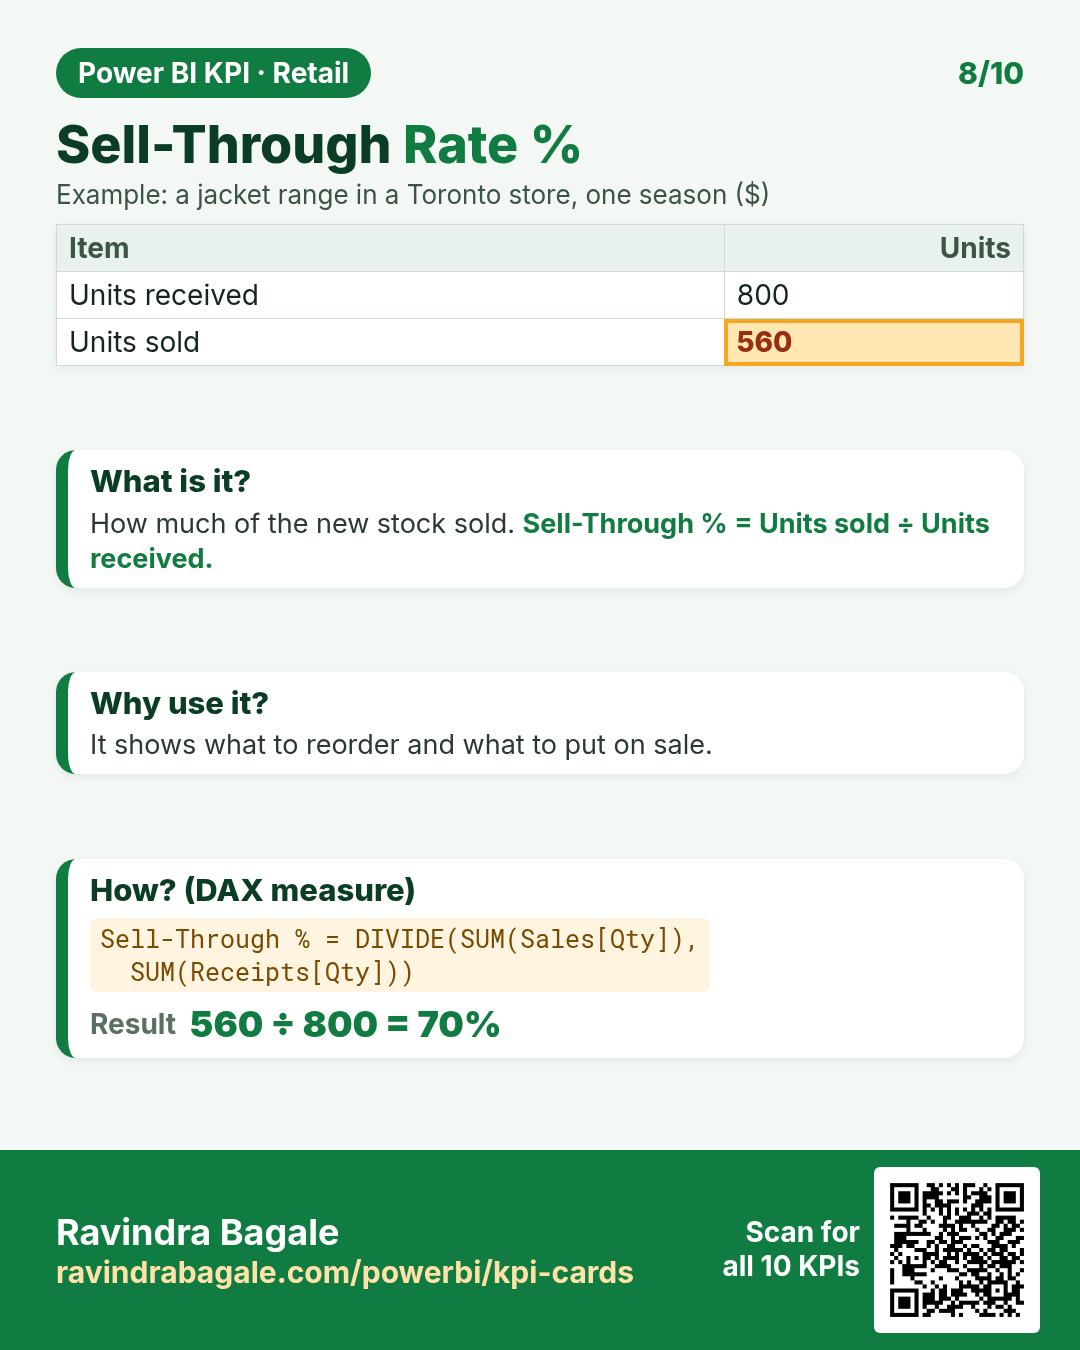
Sell-Through % = DIVIDE(SUM(Sales[Qty]), SUM(Receipts[Qty]))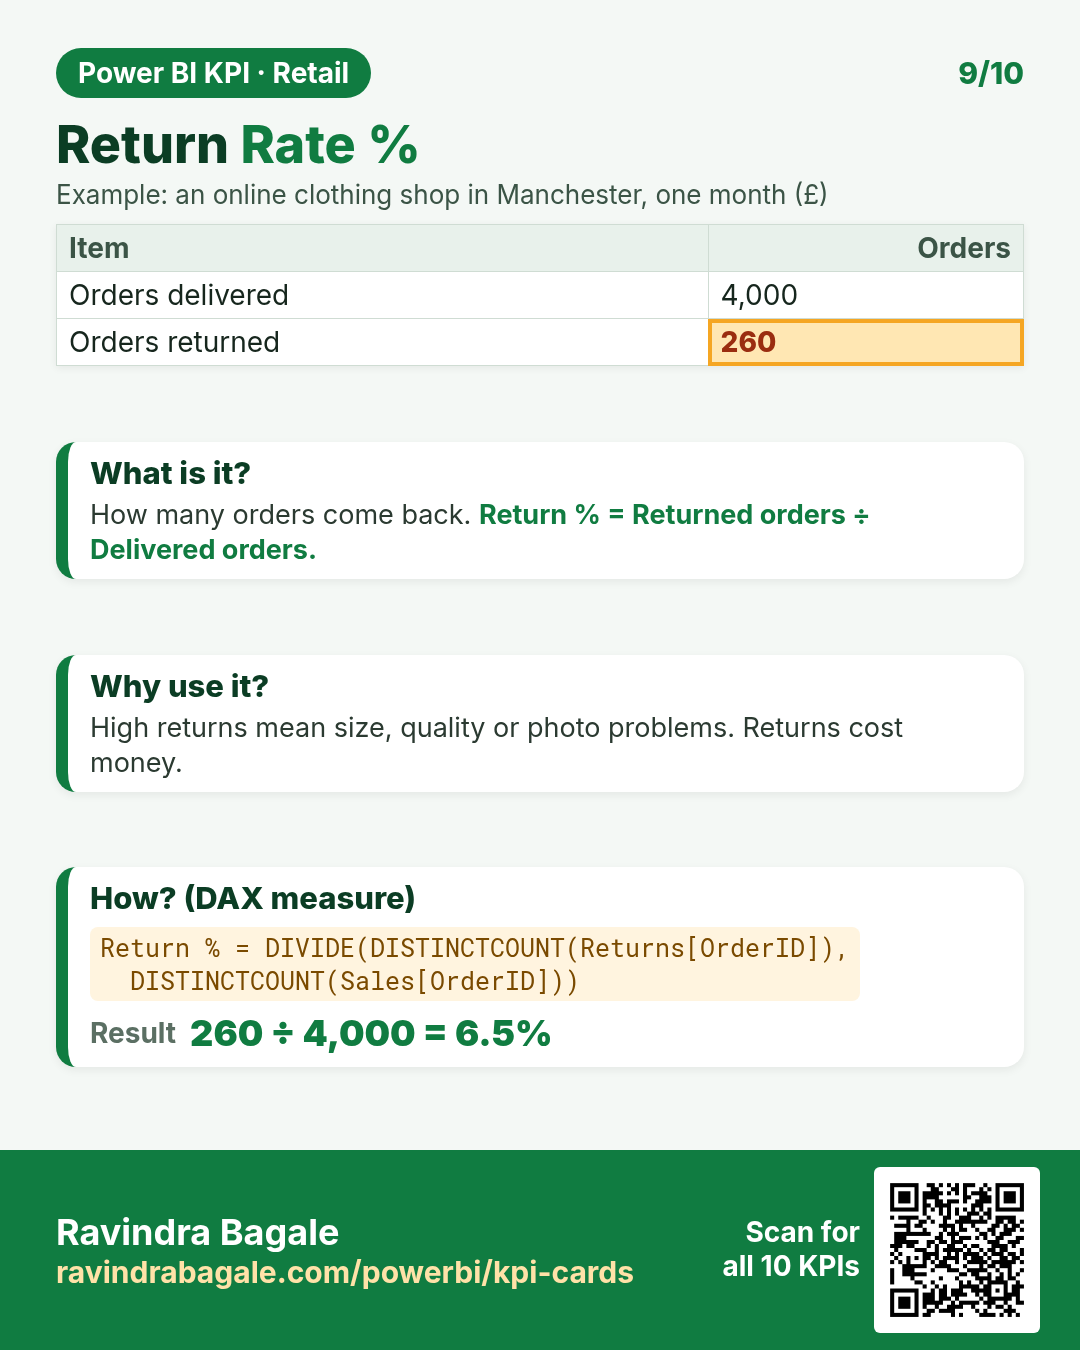
Return % = DIVIDE(DISTINCTCOUNT(Returns[OrderID]), DISTINCTCOUNT(Sales[OrderID]))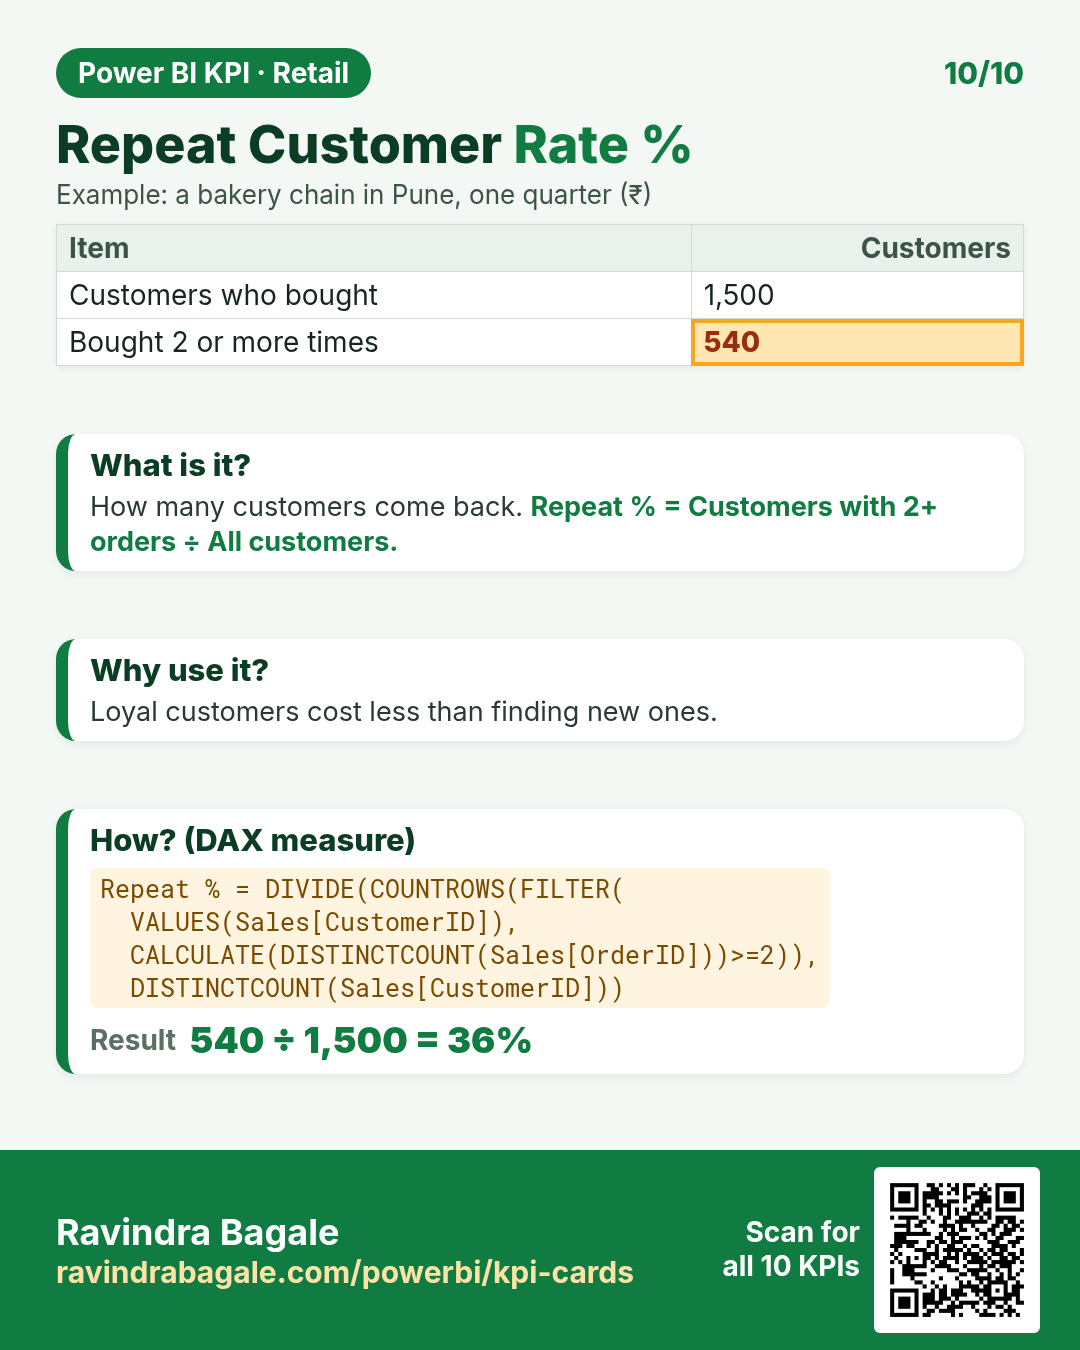
Repeat % = DIVIDE(COUNTROWS(FILTER( VALUES(Sales[CustomerID]), CALCULATE(DISTINCTCOUNT(Sales[OrderID]))>=2)), DISTINCTCOUNT(Sales[CustomerID]))Quick quiz
1. A shop has Gross Sales ₹50,000, discounts ₹4,000 and returns ₹1,000. Net Sales is…
2. Net Sales $9,000 from 300 orders. AOV is…
3. 2,000 visitors, 60 orders. Conversion Rate % is…
4. Which KPI tells you how fast stock is sold and refilled?