Case Study: Flight Delays at Boston Logan in Excel (Real BTS Data)
A Boston company's travel manager is writing a booking policy. The question from the finance team is short: "Which flights out of Boston leave on time?" The answer is in the government's flight-by-flight file. In July 2026, 13,277 flights were scheduled to leave Boston Logan (BOS). Flights scheduled before 9 am left on time 88.7% of the time; flights from 5 pm onward only 45.3%. The departure hour mattered more than the airline.
Download the BTS Reporting Carrier On-Time Performance file for one month, filter Origin to BOS, keep the useful columns, add the airline name with XLOOKUP and the hour with INT(CRSDepTime/100). Use COUNTIFS to count flights, cancellations and on-time departures (DepDel15 = 0) by airline, hour block and day, AVERAGEIFS for the average delay, and SUM for the delay-cause minutes. Chart the results on one dashboard sheet.
Real data on this page
This case study uses real public data from the U.S. Bureau of Transportation Statistics, not fictional teaching data. It is the one exception to the fictional-data rule on this site. Every number on this page was calculated from the downloaded file, and the practice workbook contains the same flights and formulas so you can check each one.
Download the practice file (case-study-flight-delays-boston.xlsx)
Excel file, 920 KB. It holds the trimmed real data and every formula used below. It has every BOS departure in July 2026 with 20 columns, the airline lookup, the analysis and the dashboard.
Quick answer
- Download the Reporting Carrier On-Time Performance file for July 2026 from BTS TranStats (one zipped CSV for all US flights).
- Filter Origin to BOS and keep the columns you need (date, airline, destination, scheduled time, delays, cancellation, delay causes).
- Add the airline name with XLOOKUP from a small code table, and the hour with
=INT(F2/100). - Count flights, cancellations and on-time departures by airline and hour with COUNTIFS; on time means DepDel15 = 0.
- Add up the five delay-cause columns to see why flights were late.
- Put four charts and six KPI cards on a Dashboard sheet and write the booking advice.
The business question
A late flight costs a business traveller a meeting; a cancelled one can cost a day. The travel manager wants rules, not opinions:
- Which airlines at Boston Logan leave on time most often, and which cancel most?
- Does the time of day matter?
- When flights are late, what is the reason?
The data: source and licence
Source and licence
Dataset: U.S. Bureau of Transportation Statistics (BTS), *Reporting Carrier On-Time Performance (1987-present)*, July 2026. One row per scheduled domestic flight of the reporting airlines. The file was published on 21 September 2026.
Where: BTS TranStats download page, or the prezipped monthly file On_Time_Reporting_Carrier_On_Time_Performance_1987_present_2026_7.zip (33 MB, 631,970 flights). Downloaded 6 October 2026. Airline names come from the BTS lookup table L_UNIQUE_CARRIERS.
Licence: BTS data is a work of the U.S. Government and is in the public domain (usa.gov/government-works), so it may be copied and shared. BTS is the source; the analysis is ours.
Our changes: we kept only the 13,277 flights with Origin = BOS and 20 of the 110 columns, and added an Airline name and an Hour column. The full practice data is in the workbook.
| Column | Meaning (from the BTS readme) |
|---|---|
| CRSDepTime | Scheduled departure time, local, hhmm |
| DepDelay | Minutes between scheduled and actual departure; early departures are negative |
| DepDel15 | 1 if the flight left 15 minutes or more late |
| ArrDel15 | 1 if it arrived 15 minutes or more late |
| Cancelled / Diverted | 1 = yes |
| CancellationCode | Reason for cancellation: A carrier, B weather, C National Air System, D security |
| Carrier, Weather, NAS, Security, Late aircraft delay | Delay minutes by cause, filled in for flights that arrived 15+ minutes late |
Step 1: Clean and shape the file
- Unzip the file and open the CSV with Data > From Text/CSV. It has about 632,000 rows, which fits in Excel but is slow, so click Transform Data to filter in Power Query.
- Filter Origin to BOS and remove the columns you do not need (keep 18 of the 110).
- Load to a table called Flights.
- Make a small table Carriers with the airline code and name from the BTS lookup, and add
=XLOOKUP(B2,Carriers[Code],Carriers[Airline]). - Add the scheduled hour:
=INT(F2/100)turns 1745 into 17. - Check: 13,277 rows, dates 1 to 31 July, 786 cancelled and 57 diverted flights. Cancelled flights have no delay minutes, so leave them out of on-time and average-delay formulas.
Define 'on time' before you count
BTS counts a flight as late when it leaves or arrives 15 minutes or more after schedule. We measure on-time departures among flights that operated (not cancelled). Say this on your dashboard, or two people will get two different answers from the same file.
Step 2: Compare airlines
- Insert a PivotTable from Flights: Airline in Rows, Flight number in Values (Count), Cancelled in Values (Sum).
- For a fixed report, use formulas on an Analysis sheet:
Flights            =COUNTIFS(Flights[Airline code],A3,Flights[Cancelled],">=0")
Cancelled          =COUNTIFS(Flights[Airline code],A3,Flights[Cancelled],1)
On-time departures =COUNTIFS(Flights[Airline code],A3,Flights[Cancelled],0,Flights[Departed 15+ min late],0)
On-time %          =G3/F3            (F = flights that operated)
Avg delay (min)    =AVERAGEIFS(Flights[Departure delay (min)],Flights[Airline code],A3,Flights[Cancelled],0)
| Code | Airline | Flights | Cancelled | On-time departures | Avg dep. delay (min) | On-time arrivals |
|---|---|---|---|---|---|---|
| B6 | JetBlue Airways | 3,355 | 9.3% | 62.5% | 30.7 | 63.0% |
| YX | Republic Airline | 3,312 | 8.4% | 73.8% | 18.4 | 72.3% |
| DL | Delta Air Lines Inc. | 2,387 | 3.0% | 73.3% | 18.1 | 74.8% |
| AA | American Airlines Inc. | 1,628 | 3.9% | 72.5% | 24.0 | 76.6% |
| UA | United Air Lines Inc. | 1,203 | 2.7% | 74.9% | 23.9 | 73.8% |
| WN | Southwest Airlines Co. | 768 | 2.9% | 53.4% | 29.4 | 63.7% |
| AS | Alaska Airlines Inc. | 264 | 0.8% | 71.4% | 19.6 | 73.3% |
| MQ | Envoy Air | 205 | 2.0% | 76.6% | 25.2 | 80.5% |
| F9 | Frontier Airlines Inc. | 81 | 1.2% | 70.0% | 14.1 | 68.8% |
| G4 | Allegiant Air | 74 | 1.4% | 80.8% | 5.8 | 74.0% |
| All | All airlines | 13,277 | 5.9% | 69.7% | 23.3 | 70.8% |
Among airlines with 500 or more flights, United Air Lines Inc. left on time most often (74.9%) and Southwest Airlines Co. least often (53.4%). JetBlue Airways cancelled the highest share (9.3%). Airlines with fewer than 100 flights (Frontier, Allegiant) are too small to judge from one month. Republic Airline is a regional airline whose flights are usually sold under a larger airline's brand, so check who operates a flight before you book.
Step 3: Compare departure hours
Use the Departure block column (hour blocks set by BTS) with the same COUNTIFS pattern:
| Scheduled block | Flights | On-time departures | Cancelled |
|---|---|---|---|
| 0001-0559 | 373 | 90.0% | 3.2% |
| 0600-0659 | 1,095 | 90.1% | 4.5% |
| 0700-0759 | 1,221 | 88.8% | 3.9% |
| 0800-0859 | 1,103 | 86.8% | 4.2% |
| 0900-0959 | 995 | 81.9% | 3.2% |
| 1000-1059 | 761 | 78.2% | 2.0% |
| 1100-1159 | 653 | 75.8% | 3.1% |
| 1200-1259 | 743 | 71.7% | 4.6% |
| 1300-1359 | 641 | 73.1% | 3.1% |
| 1400-1459 | 556 | 68.5% | 6.8% |
| 1500-1559 | 812 | 60.4% | 7.0% |
| 1600-1659 | 725 | 57.3% | 6.6% |
| 1700-1759 | 1,160 | 47.6% | 8.5% |
| 1800-1859 | 539 | 45.2% | 11.3% |
| 1900-1959 | 642 | 40.7% | 10.4% |
| 2000-2059 | 881 | 44.9% | 10.0% |
| 2100-2159 | 288 | 49.0% | 13.5% |
| 2200-2259 | 89 | 42.1% | 14.6% |
The pattern is clear: before 9 am, 88.7% of flights left on time and 4.1% were cancelled; from 5 pm onward, only 45.3% left on time and 10.2% were cancelled. Delays build up during the day, because a late plane makes its next flight late too.
Step 4: Why were flights late?
For the 3,632 flights that arrived 15+ minutes late, the airlines split the delay minutes into five causes. =SUM(Flights[Late aircraft delay]) and so on:
| Cause | Delay minutes | Share |
|---|---|---|
| Carrier | 90,715 | 30.0% |
| Weather | 6,490 | 2.1% |
| National Air System | 78,438 | 25.9% |
| Security | 210 | 0.1% |
| Late-arriving aircraft | 126,551 | 41.8% |
Late-arriving aircraft (the plane came in late from its previous flight) caused the largest share, which matches the hour pattern. Cancellations by reason code: carrier 254, weather 236, National Air System 296, security 0. The worst days were 21 July (139 cancelled of 433), 28 July (98 cancelled of 434), 18 July (85 cancelled of 380).
Step 5: Build the dashboard
- On the Dashboard sheet add six KPI cards: departures, on-time departures, cancelled, on-time arrivals, average departure delay and the most cancellations in one day (
=MAX(...)). - Insert a bar chart of on-time departure % by airline and a column chart of on-time % by scheduled hour.
- Add a pie chart of delay minutes by cause (only five slices, so a pie works) and a column chart of cancellations per day.
- Turn off gridlines, align the charts and set landscape, fit to one page.
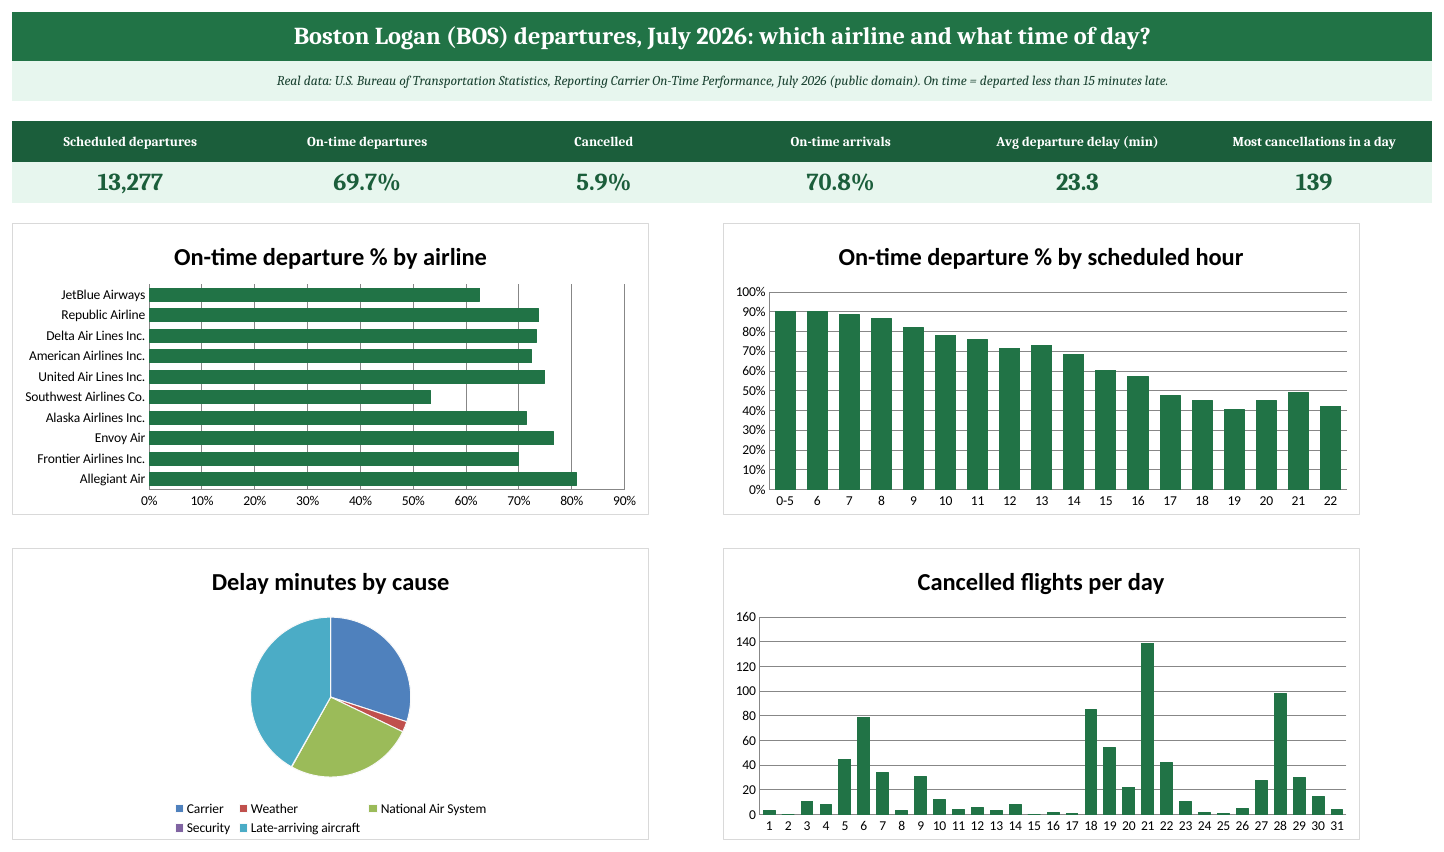
The Dashboard sheet of the practice workbook (real data: U.S. Bureau of Transportation Statistics).
Step 6: The recommendation
- Book the first flights of the day for important trips. Before 9 am, 88.7% of BOS departures left on time in July 2026, against 45.3% from 5 pm onward.
- Avoid the last flight of the evening when the trip cannot slip. Evening flights were cancelled about 2.5 times as often as morning flights (10.2% vs 4.1%), and there is no later flight to rebook onto.
- Use airline data as a tie-breaker, not the main rule. On-time departure rates for the bigger airlines ranged from 53.4% to 74.9%; the hour of the day made a bigger difference than the airline.
- Re-check every quarter. One summer month with thunderstorms is not a full year. Download a few more months and repeat the same formulas before you make the policy permanent.
What this data cannot tell you
- It covers domestic flights of the airlines that report to BTS, not international flights.
- One month in summer can be very different from winter.
- Delay causes are reported by the airlines using BTS categories; they explain minutes, not the full story of a bad day.
Ravindra Bagale's Tip
Before comparing groups, check how big each group is. An airline with 74 flights can look best or worst by chance. Show the count next to every percentage on your dashboard so readers can judge for themselves.
Ravindra Bagale's Tip – मराठी
Groups ची तुलना करण्यापूर्वी प्रत्येक group किती मोठा आहे ते तपासा. फक्त 74 flights असलेली airline योगायोगाने सर्वात चांगली किंवा वाईट दिसू शकते. Dashboard वर प्रत्येक percentage शेजारी count दाखवा, म्हणजे वाचक स्वतः ठरवू शकतील.
Ravindra Bagale's Tip – हिंदी
Groups की तुलना करने से पहले देखिए कि हर group कितना बड़ा है। सिर्फ 74 flights वाली airline संयोग से सबसे अच्छी या सबसे खराब दिख सकती है। Dashboard पर हर percentage के पास count दिखाइए, ताकि पढ़ने वाले खुद तय कर सकें।
Practice task
- On Flights, filter Cancelled = 1 and Cancellation code = B. On which days were most weather cancellations?
- Add an on-time arrival % by hour block to the Analysis sheet and compare it with departures.
- Make a PivotTable with Destination in Rows and the average Departure delay in Values. Which of the ten busiest routes had the longest average delay?
- Change the on-time rule to 'left within 30 minutes' with COUNTIFS on Departure delay (min). How much do the airline ranks change?
- Download August 2026 from BTS and repeat the analysis. Does the morning advantage hold?
Learn it properly
Course lessons:
- 10.1 Opening Power Query: Data from a Workbook or CSV
- 3.3 COUNT, COUNTA, COUNTBLANK, COUNTIF and COUNTIFS
- 4.6 XLOOKUP Basics and if_not_found
- 8.12 Choosing the Right Chart
- 13.4 KPI Cards
Related guides: COUNTIF and COUNTIFS · XLOOKUP for Beginners · Case Study: How Big Is US E-commerce? Excel Analysis of Census Retail Data · Case Study: NYC Restaurant Inspections in Excel (Real NYC Open Data)
Frequently asked questions
Can I use BTS data for my own reports?
Yes. It is a U.S. Government work and in the public domain. Name BTS as the source and make clear the analysis is yours.
Why is the file so big?
It has every reporting airline's domestic flights in the month with 110 columns. Filter to one airport in Power Query before loading, as in Step 1.
Why do on-time departures and arrivals differ?
A flight can leave late and make up time in the air, or leave on time and wait for a gate. BTS records both, so pick the one that matches your question.
Does every cancelled flight have a reason code?
Yes, in this month: 254 + 236 + 296 = 786, which is every cancelled BOS flight in the month (786).