Excel Interview Prep — Advanced
Friends, advanced mode: dynamic arrays, Power Query at scale, Data Model, and performance. Explain trade-offs, not only clicks.
चला मित्रांनो — advanced: dynamic arrays, Power Query, Data Model, performance. Trade-off सांगा, फक्त clicks नाही.
चलो दोस्तों — advanced: dynamic arrays, Power Query, Data Model, performance. Trade-off बताओ, सिर्फ clicks नहीं.
Why → What → How
Why: Excel interviews are not memory tests of every function name. They check if you can clean a small sheet, write a correct formula, and explain the result in plain English.
What: This page has 28 real interview-style questions for Advanced. Each one has a short answer, vertical steps, a tiny example, a common wrong answer, and a follow-up question.
How — study plan:
- Skim all question titles once (10 minutes).
- Download the practice workbook and open sheet
About this data. - Answer aloud, then type the formula in the file.
- Check the yellow cells on sheet
Answersonly after you try. - Revise with the three cards and take the quiz.
Download practice file: practice-advanced-interview.xlsx (includes About this data, practice sheets, Answers).
Ravindra Bagale's Tip
Friends, if refresh is slow, kill whole-column volatile formulas before you blame the laptop.
Ravindra Bagale's Tip – मराठी
मित्रांनो, refresh slow असेल तर आधी whole-column volatile formulas काढा.
Ravindra Bagale's Tip – हिंदी
दोस्तों, refresh धीमा हो तो पहले whole-column volatile formulas हटाओ.
Ravindra Bagale's Tip
Prefer Power Query append/merge over copy-paste months — interviewers listen for refresh discipline.
Ravindra Bagale's Tip – मराठी
Copy-paste महिन्यांपेक्षा Power Query append/merge — interviewers refresh discipline ऐकतात.
Ravindra Bagale's Tip – हिंदी
Copy-paste महीनों से बेहतर Power Query append/merge — interviewer refresh discipline सुनते हैं.
Questions (28)
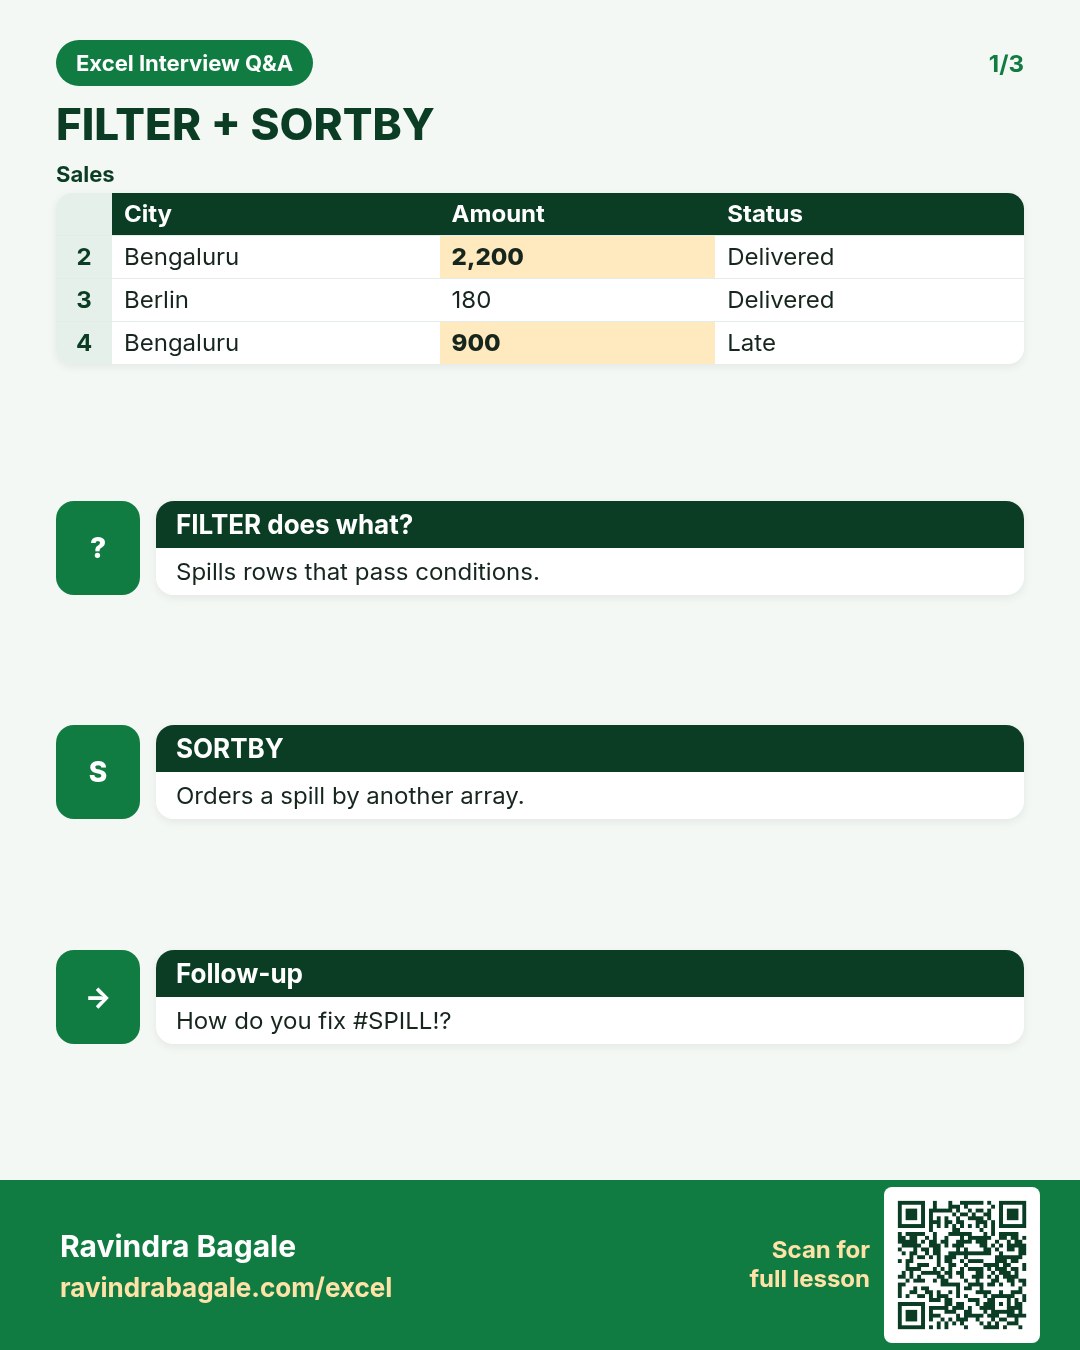
What does FILTER return?
Why interviewers ask: To see if you understand the idea, not only the button clicks.
What (short answer): FILTER spills all rows that pass a condition. It needs Microsoft 365 or Excel 2021 dynamic arrays.
How — tiny example (vertical steps):
- =FILTER(A2:D100,C2:C100="Pune").
- Result spills Pune rows.
Formula: =FILTER(A2:D100,C2:C100="Pune")
Result: Pune rows
What it means: Dynamic filtered table.
SORT and UNIQUE together — example.
Why interviewers ask: To see if you understand the idea, not only the button clicks.
What (short answer): UNIQUE removes duplicates; SORT orders the spill. Nest them for a clean sorted city list.
How — tiny example (vertical steps):
- =SORT(UNIQUE(C2:C500)).
Formula: =SORT(UNIQUE(C2:C500))
Result: sorted cities
What it means: Clean dimension list.
SEQUENCE — one practical use?
Why interviewers ask: To see if you understand the idea, not only the button clicks.
What (short answer): SEQUENCE spills a number list. Use it for serial calendars, ranking helpers or mock IDs.
How — tiny example (vertical steps):
- =SEQUENCE(10) spills 1 to 10.
- =DATE(2026,11,1)+SEQUENCE(30)-1 builds November dates.
Formula: =SEQUENCE(10)
Result: 1..10
What it means: Helper index.
What is LET and why use it?
Why interviewers ask: To see if you understand the idea, not only the button clicks.
What (short answer): LET names intermediate calculations inside a formula so Excel computes once and the formula stays readable.
How — tiny example (vertical steps):
- =LET(x,A2*1.18, x+B2).
- x is computed once.
Formula: =LET(net,A2-B2, net*0.18)
Result: GST on net
What it means: Clearer long formula.
When would you write a LAMBDA?
Why interviewers ask: To see if you understand the idea, not only the button clicks.
What (short answer): When a custom calculation is reused many times and is not worth VBA. Keep it simple; avoid recursive LAMBDA unless you really need it.
How — tiny example (vertical steps):
- Name Manager → new name Tax18 = LAMBDA(x, x*1.18).
- Use =Tax18(A2).
Formula: =LAMBDA(x,x*1.18)
Result: custom fn
What it means: Reusable logic.
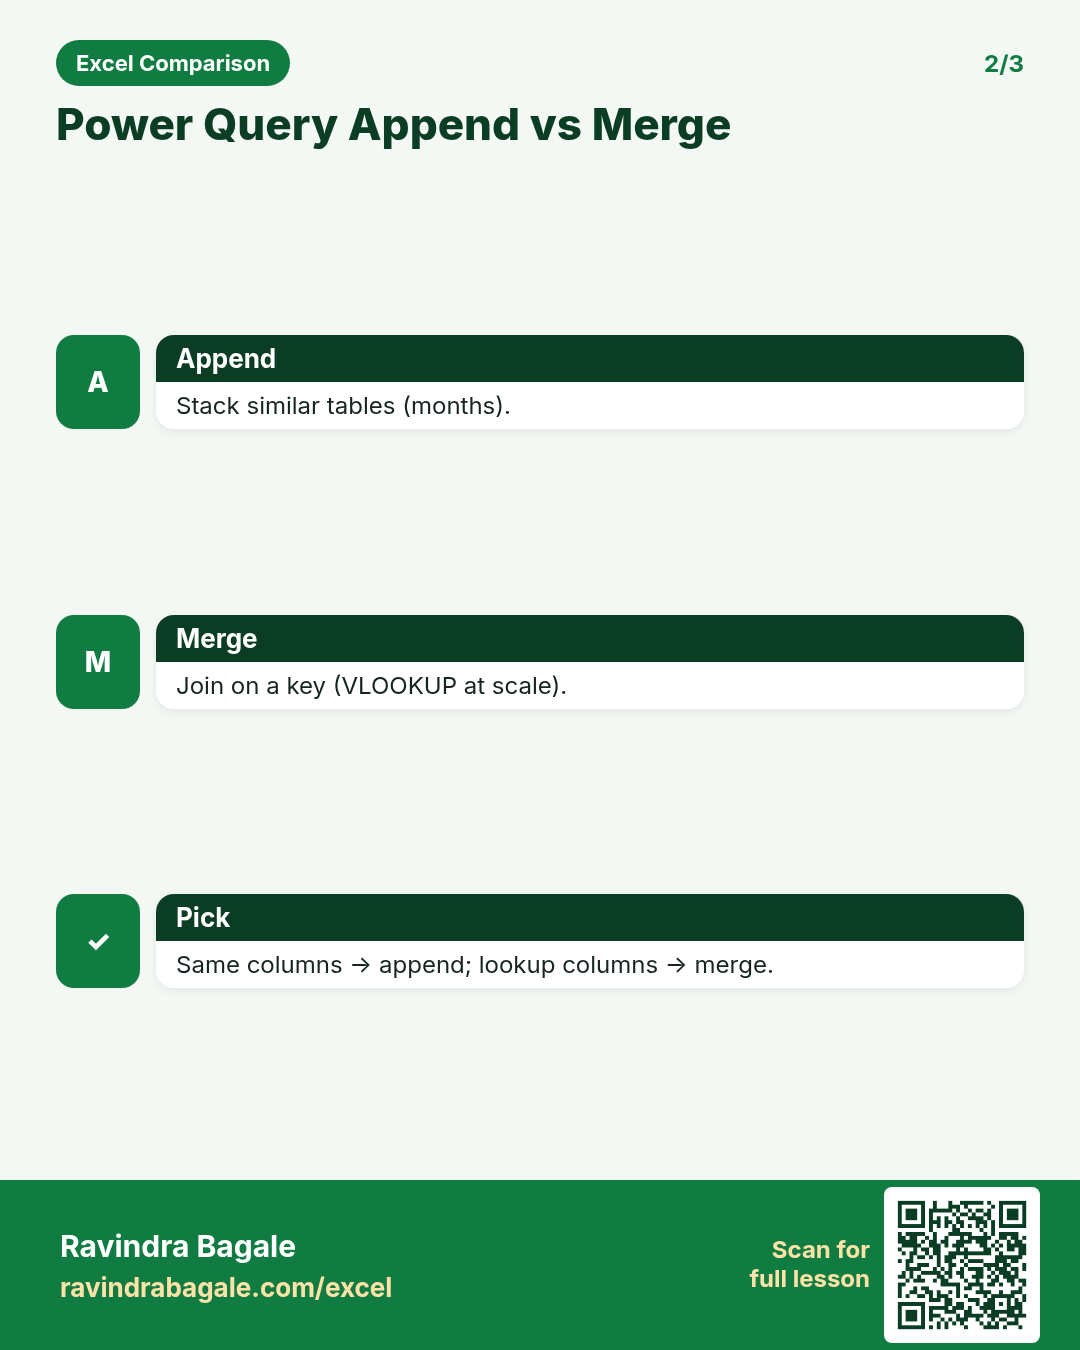
Power Query merge vs append?
Why interviewers ask: To see if you understand the idea, not only the button clicks.
What (short answer): Append stacks similar tables (months). Merge joins tables side by side on a key (like VLOOKUP at scale).
How — tiny example (vertical steps):
- Append Jan+Feb+Mar.
- Merge Orders to Customers on CustomerID.
Formula: (Merge/Append)
Result: combined query
What it means: Scale beyond VLOOKUP.
Combine a folder of monthly CSVs in Power Query?
Why interviewers ask: To see if you understand the idea, not only the button clicks.
What (short answer): Get Data → From Folder → combine files → sample file defines columns → transform → Close & Load.
How — tiny example (vertical steps):
- Point to the folder.
- Combine & Transform.
- Check data types.
Formula: (From Folder)
Result: all months
What it means: One refresh for new files.
Excel Data Model relationship — what is it?
Why interviewers ask: To see if you understand the idea, not only the button clicks.
What (short answer): A relationship links tables on a key inside the workbook Data Model so PivotTables can use fields from both without VLOOKUP.
How — tiny example (vertical steps):
- Power Pivot → Manage → Diagram.
- Drag CustomerID from Orders to Customers.
Formula: (Data Model)
Result: related tables
What it means: Star-schema style Pivot.
DAX in Excel — when does it appear?
Why interviewers ask: To see if you understand the idea, not only the button clicks.
What (short answer): When you use Power Pivot / Data Model measures. Measures like Total Sales := SUM(Orders[Amount]) live in the model.
How — tiny example (vertical steps):
- Create measure Total Sales.
- Use it in a Pivot from the Data Model.
Formula: Total Sales:=SUM(Orders[Amount])
Result: measure
What it means: Reusable model KPI.
Volatile functions — name three and the risk.
Why interviewers ask: To see if you understand the idea, not only the button clicks.
What (short answer): NOW, TODAY, RAND, OFFSET, INDIRECT recalculate often and can slow big workbooks.
How — tiny example (vertical steps):
- Prefer INDEX over OFFSET.
- Prefer structured tables over INDIRECT where possible.
Formula: NOW()/RAND()
Result: recalc cost
What it means: Performance awareness.
Data Table (what-if) vs Scenario Manager?
Why interviewers ask: To see if you understand the idea, not only the button clicks.
What (short answer): Data Table varies one or two inputs across many values. Scenario Manager saves named sets of multiple inputs.
How — tiny example (vertical steps):
- Data → What-If → Data Table for rate vs tenure grid.
- Scenarios for Base/Best/Worst.
Formula: (Data Table)
Result: sensitivity grid
What it means: What-if analysis.
When should you not use VBA?
Why interviewers ask: To see if you understand the idea, not only the button clicks.
What (short answer): If Power Query, dynamic arrays or Office Scripts can do it — prefer them. VBA needs trust, macros enabled, and harder audit.
How — tiny example (vertical steps):
- Automate refresh with Power Query first.
- Use VBA for UI that PQ cannot do.
Formula: (no macro)
Result: safer default
What it means: Less brittle automation.
Dashboard layout pattern you recommend?
Why interviewers ask: To see if you understand the idea, not only the button clicks.
What (short answer): Top KPI cards, filters/slicers left or top, one main chart, one detail table, About/notes footer. Keep one screen.
How — tiny example (vertical steps):
- KPIs first.
- Slicers next.
- Chart + table.
- Notes last.
Formula: (layout)
Result: one screen
What it means: Readable for managers.
XLOOKUP with if_not_found and search mode.
Why interviewers ask: To see if you understand the idea, not only the button clicks.
What (short answer): XLOOKUP can return a custom message and search last-to-first for the latest match.
How — tiny example (vertical steps):
- =XLOOKUP(id,A:A,B:B,"Missing",0,-1) last match.
Formula: =XLOOKUP(G2,A:A,B:B,"Missing",0,-1)
Result: latest
What it means: Last matching row.
Dynamic array #SPILL! — causes?
Why interviewers ask: To see if you understand the idea, not only the button clicks.
What (short answer): Something blocks the spill range (value, merged cell, or table overlap). Clear the block or move the formula.
How — tiny example (vertical steps):
- Delete the blocking cell.
- Avoid merging in spill zones.
Formula: #SPILL!
Result: blocked
What it means: Fix the range.
Build FILTER of Delivered rows for one city from practice data.
Why interviewers ask: To see if you understand the idea, not only the button clicks.
What (short answer): Use FILTER with two conditions multiplied or nested logic.
How — tiny example (vertical steps):
- =FILTER(Sales,(City=G1)*(Status="Delivered")).
Formula: =FILTER(A2:F200,(C2:C200=G1)*(F2:F200="Delivered"))
Result: rows
What it means: City delivered set.
Query folding awareness in one line?
Why interviewers ask: To see if you understand the idea, not only the button clicks.
What (short answer): Folding means Power Query pushes steps to the source (SQL). Extra steps can break folding and slow refresh.
How — tiny example (vertical steps):
- Keep early filters.
- Check query plan when using databases.
Formula: (folding)
Result: faster refresh
What it means: Source does the work.
MAP or BYROW — idea for interviews?
Why interviewers ask: To see if you understand the idea, not only the button clicks.
What (short answer): Helper LAMBDA applied row-wise on an array. Shows you know modern array thinking.
How — tiny example (vertical steps):
- =BYROW(A2:A10, LAMBDA(r, LEN(r))).
Formula: =BYROW(A2:A10,LAMBDA(r,LEN(r)))
Result: lengths
What it means: Row-wise LAMBDA.
Refresh takes 3 minutes — what do you check?
Why interviewers ask: To see if you understand the idea, not only the button clicks.
What (short answer): Remove volatile formulas, limit whole-column refs, check PQ steps, drop unused connections, test on a sample.
How — tiny example (vertical steps):
- Replace OFFSET.
- Filter early in PQ.
- Turn off unused queries.
Formula: (perf checklist)
Result: faster file
What it means: Interview debugging story.
Star schema in the Excel model?
Why interviewers ask: To see if you understand the idea, not only the button clicks.
What (short answer): Fact table (orders) in the middle, dimension tables (date, product, city) around it, linked by keys.
How — tiny example (vertical steps):
- Facts hold amounts.
- Dims hold labels.
- Relate on keys.
Formula: (star)
Result: clean model
What it means: BI-friendly Excel.
CHOOSECOLS / CHOOSEROWS use case?
Why interviewers ask: To see if you understand the idea, not only the button clicks.
What (short answer): Pick columns from a spill or range without helper sheets — good with FILTER.
How — tiny example (vertical steps):
- =CHOOSECOLS(FILTER(...),1,4,5).
Formula: =CHOOSECOLS(A2:F10,1,3)
Result: subset
What it means: Slim report columns.
Create a measure-style total with SUMIF pattern then compare to Pivot.
Why interviewers ask: To see if you understand the idea, not only the button clicks.
What (short answer): Sheet KPI =SUMIFS(...) should match Pivot grand total for the same filters.
How — tiny example (vertical steps):
- Build SUMIFS.
- Build Pivot.
- Compare numbers.
Formula: =SUMIFS(...)
Result: match Pivot
What it means: Trust but verify.
Office Scripts vs VBA — interview line?
Why interviewers ask: To see if you understand the idea, not only the button clicks.
What (short answer): Office Scripts are TypeScript in Excel on the web, easier to share in Microsoft 365; VBA is desktop macros in .xlsm.
How — tiny example (vertical steps):
- Prefer Scripts for cloud automation.
- VBA for legacy desktop add-ins.
Formula: (Office Scripts)
Result: cloud auto
What it means: Modern automation answer.
GROUPBY or PIVOTBY awareness (new Excel)?
Why interviewers ask: To see if you understand the idea, not only the button clicks.
What (short answer): These dynamic-array functions summarise like a Pivot without a Pivot cache — mention if your build has them.
How — tiny example (vertical steps):
- =GROUPBY(City,Amount,SUM).
Formula: =GROUPBY(C2:C100,E2:E100,SUM)
Result: summary
What it means: Array Pivot-like.
Boss wants yesterday’s dashboard every morning.
Why interviewers ask: To see if you understand the idea, not only the button clicks.
What (short answer): PQ folder/database refresh + Pivot refresh + save to PDF or email. Document the 3 clicks or automate carefully.
How — tiny example (vertical steps):
- Refresh All.
- Check KPI cards.
- Export PDF.
Formula: Ctrl+Alt+F5
Result: refreshed
What it means: Morning pack.
Circular reference — what and how to find?
Why interviewers ask: To see if you understand the idea, not only the button clicks.
What (short answer): A formula refers to its own cell (directly or via a chain). Status bar warns; Formulas → Error Checking → Circular References.
How — tiny example (vertical steps):
- Find the cell.
- Break the loop or use iterative calc only if intentional.
Formula: (Circular)
Result: error
What it means: Fix the loop.
Build SORTBY of Amount descending for Delivered-only FILTER.
Why interviewers ask: To see if you understand the idea, not only the button clicks.
What (short answer): Nest FILTER inside SORTBY.
How — tiny example (vertical steps):
- =SORTBY(FILTER(...), AmountCol, -1).
Formula: =SORTBY(FILTER(A2:F100,F2:F100="Delivered"),E2:E100,-1)
Result: sorted
What it means: Top delivered first.
Version control for Excel — practical advice?
Why interviewers ask: To see if you understand the idea, not only the button clicks.
What (short answer): Date-stamped copies or OneDrive version history, clear file names, About sheet with change log. Git works poorly for .xlsx binaries but still use folders.
How — tiny example (vertical steps):
- Sales_MIS_2026-10-31.xlsx.
- Log changes on About.
Formula: (versioning)
Result: safe history
What it means: Team discipline.
Practice tasks (12)
- 1. FILTER Delivered for city in G1 (medium)Hint: Multiply conditions inside FILTER.
- 2. SORT UNIQUE cities (easy)Hint: Nest UNIQUE inside SORT.
- 3. LET for net and GST (medium)Hint: Name net once, reuse.
- 4. PQ append three month sheets (medium)Hint: Same columns before append.
- 5. Data Model relationship on CustomerID (hard)Hint: Add both tables to model first.
- 6. XLOOKUP last match (medium)Hint: search_mode -1.
- 7. Fix a #SPILL! on purpose (easy)Hint: Clear the blocking cell.
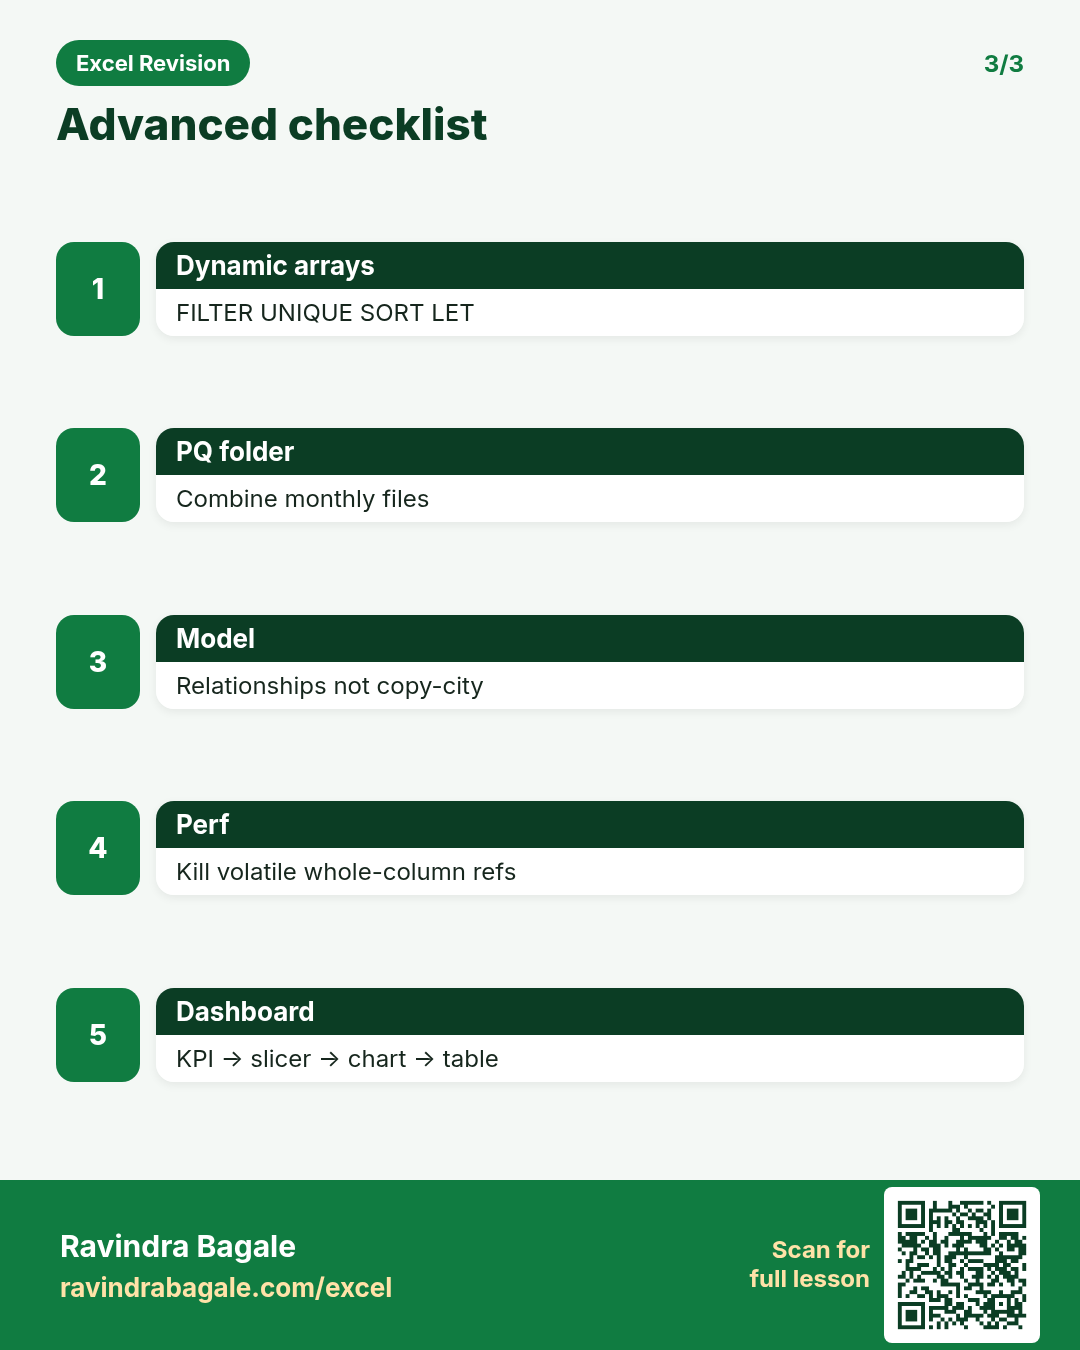
- 8. Dashboard one-screen wireframe (medium)Hint: KPI → slicer → chart → table.
- 9. Replace OFFSET with INDEX (medium)Hint: INDEX stays non-volatile.
- 10. Morning refresh checklist doc (easy)Hint: Write steps on About sheet.
- 11. SORTBY FILTER by Amount (medium)Hint: SORTBY second arg is the sort array.
- 12. Find circular reference demo (easy)Hint: Formulas → Error Checking.
Quiz (8 questions)
1. FILTER needs dynamic array Excel.
2. Append stacks tables; Merge joins on a key.
3. NOW and OFFSET are volatile.
4. DAX measures are typed in normal worksheet cells.
5. LET can make formulas faster and clearer.
6. #SPILL! means the spill range is blocked.
7. VBA is always better than Power Query.
8. Star schema uses facts and dimensions.
Interview, comparison and revision cards
Standalone cards (no tip or photo strip). Each has a QR to this lesson. Download the PNG and revise offline.
Next: back to the Interview Prep hub · related lesson Formulas and Functions.