Ravindra BagaleCourses & study guides मराठी

Ravi Sir's Cards › DevOps

Chapter 13: Monitoring Basics: मराठी Cards

English cards · Chapter उघडा

उजळणी (Revision) cards

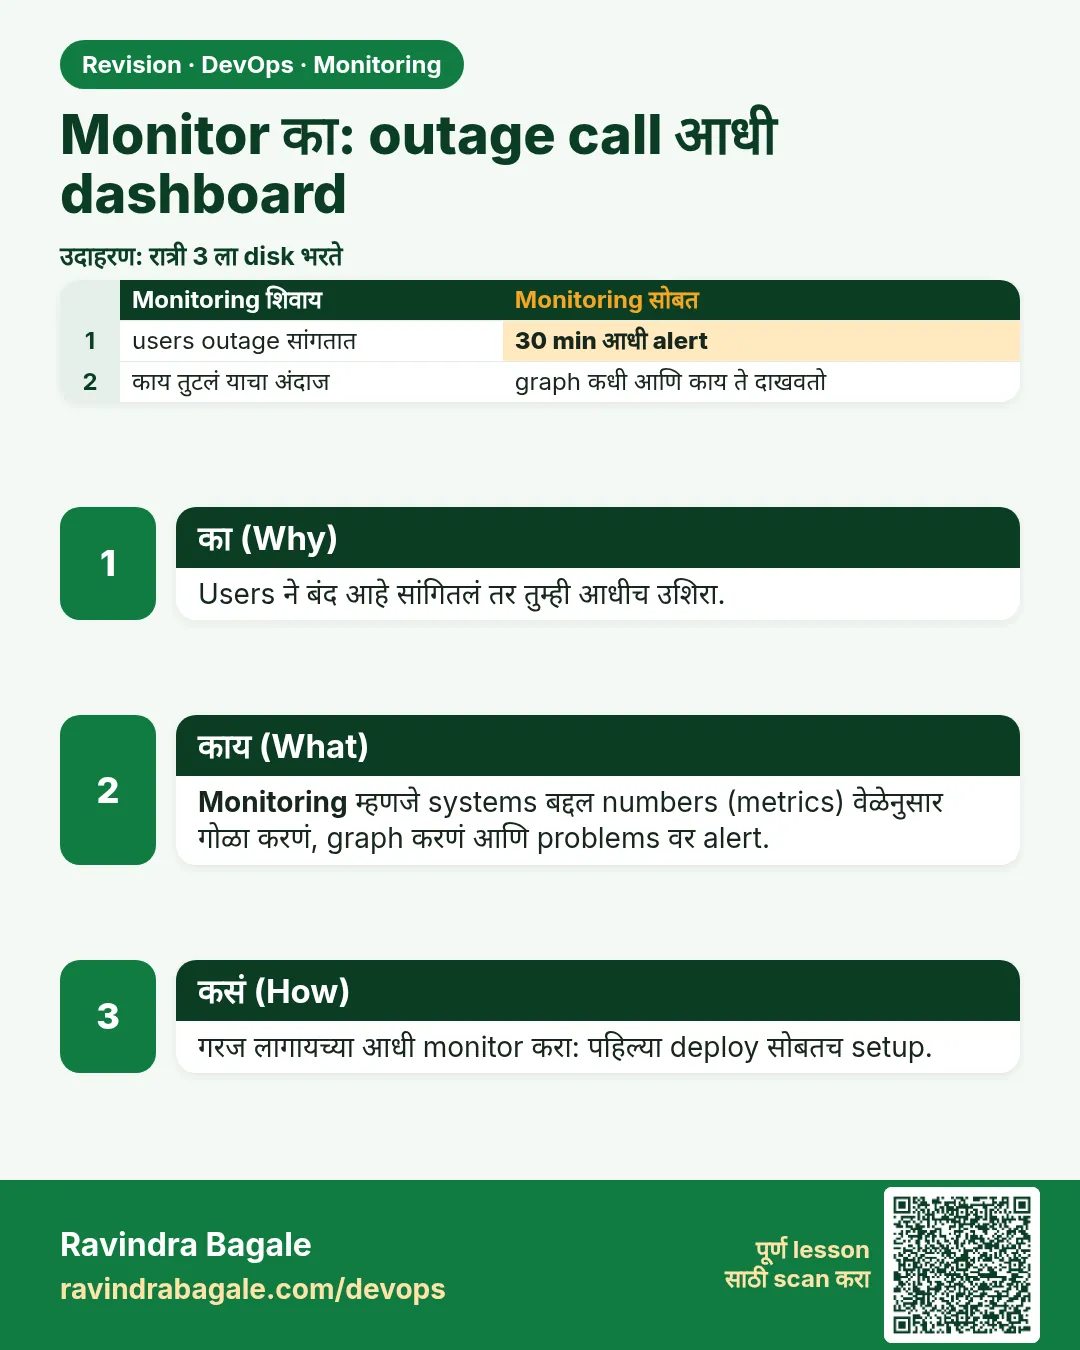
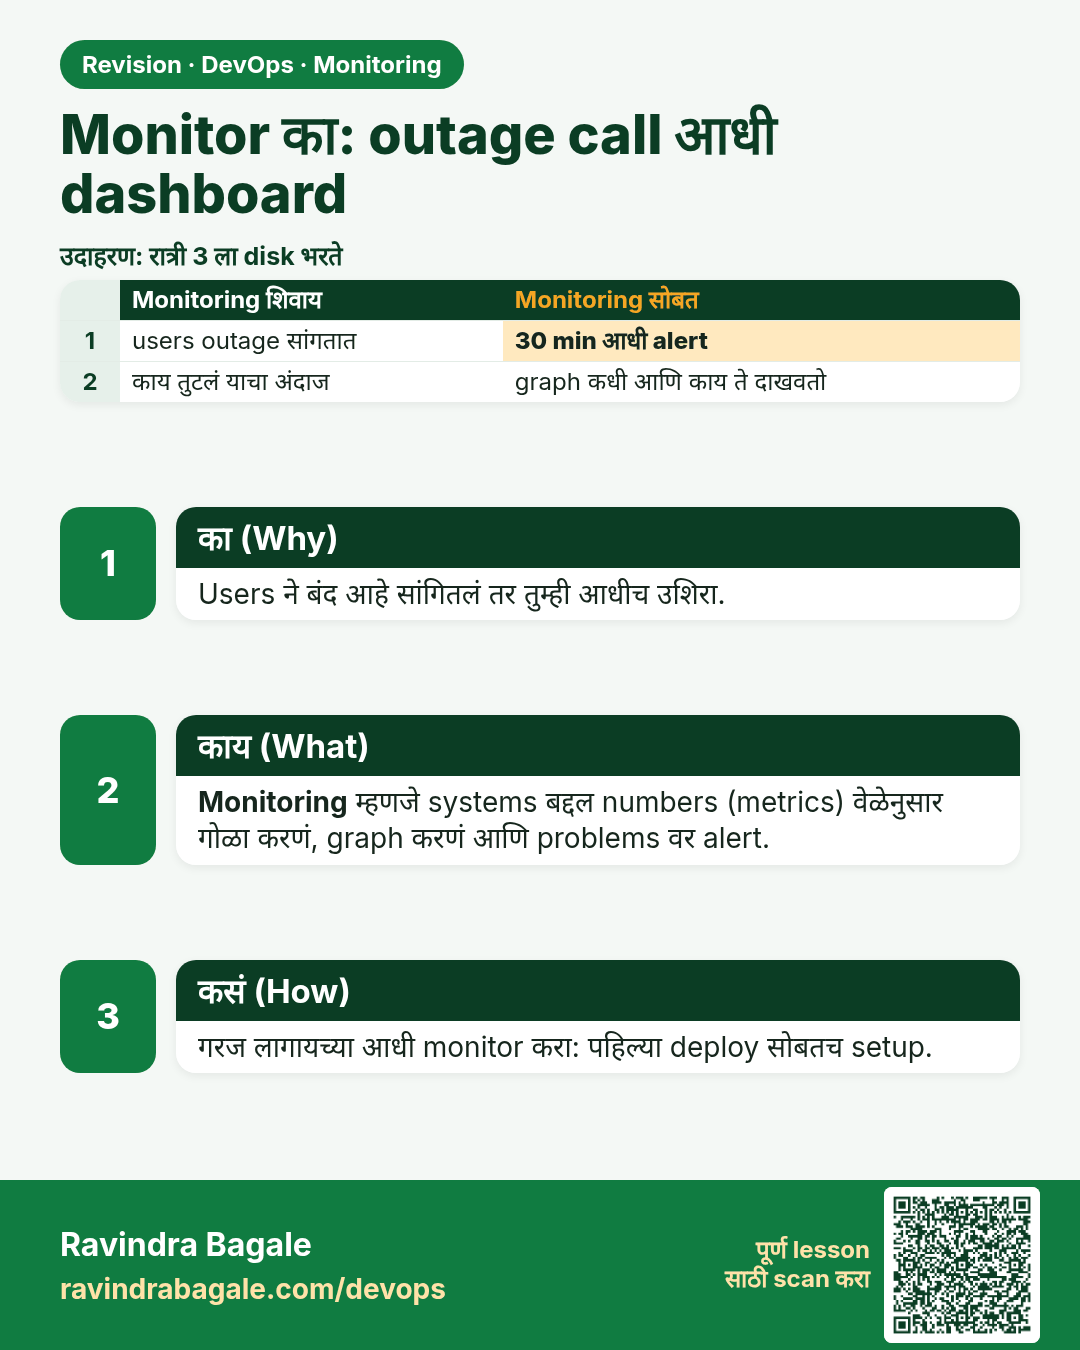
Monitor का: outage call आधी dashboard. Users ने बंद आहे सांगितलं तर तुम्ही आधीच उशिरा.
उजळणी (Revision) card 1 of 13: Monitor का: outage call आधी dashboard · PNG download करा · Card page उघडा

Lesson: 13.1 Why monitor — dashboard before the outage call
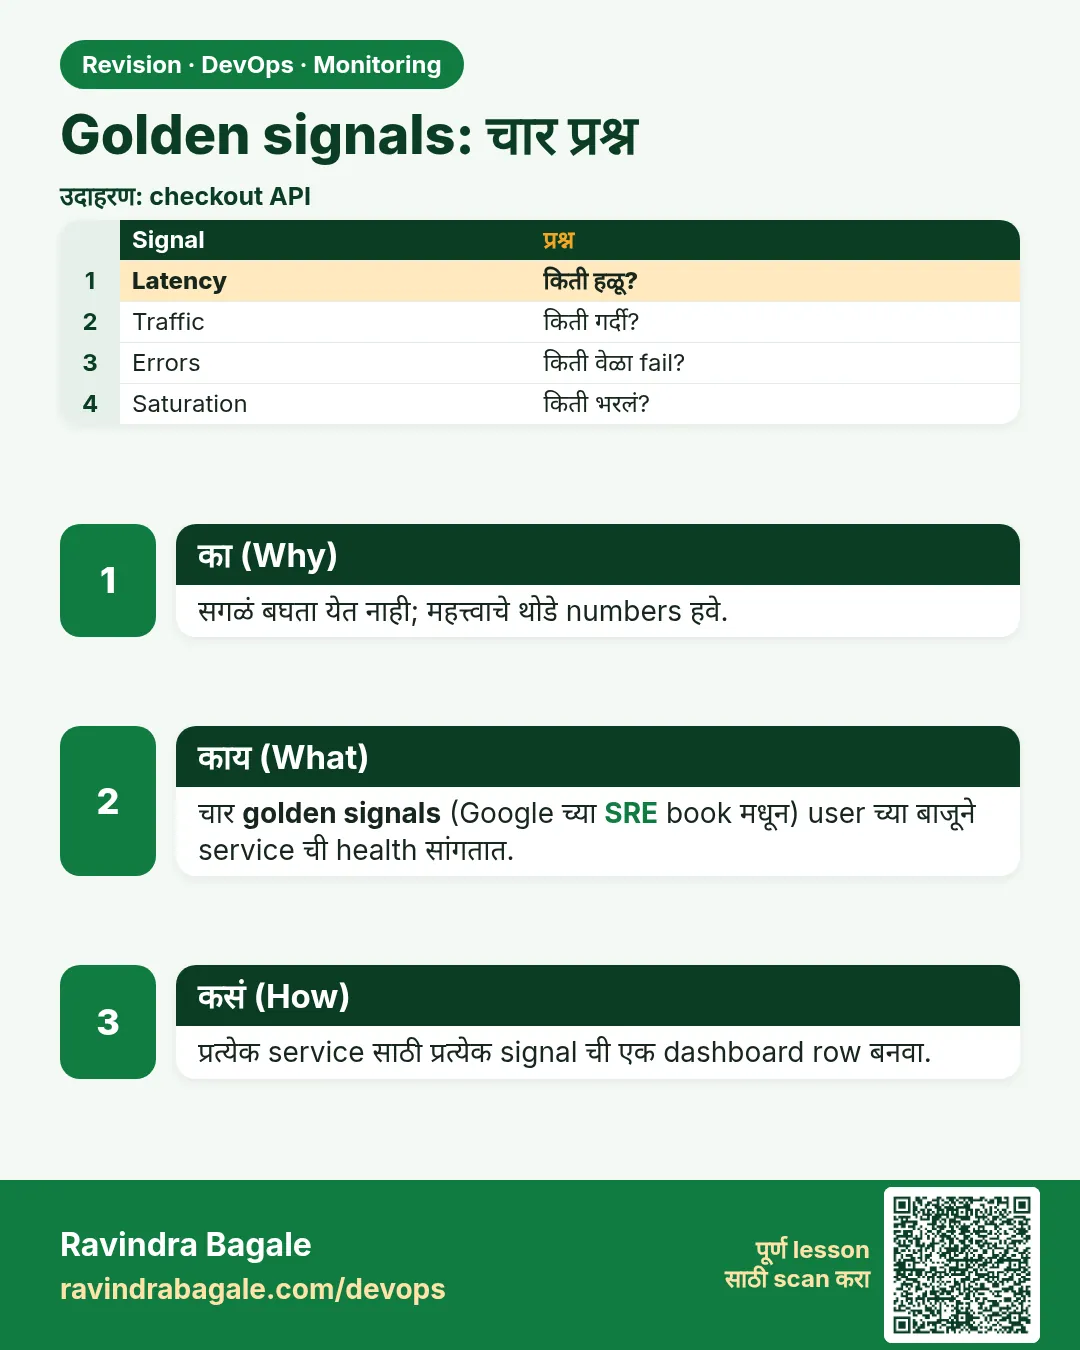
Golden signals: चार प्रश्न. सगळं बघता येत नाही; महत्त्वाचे थोडे numbers हवे.
उजळणी (Revision) card 2 of 13: Golden signals: चार प्रश्न · PNG download करा · Card page उघडा

Lesson: 13.2 Golden signals — four questions in plain English

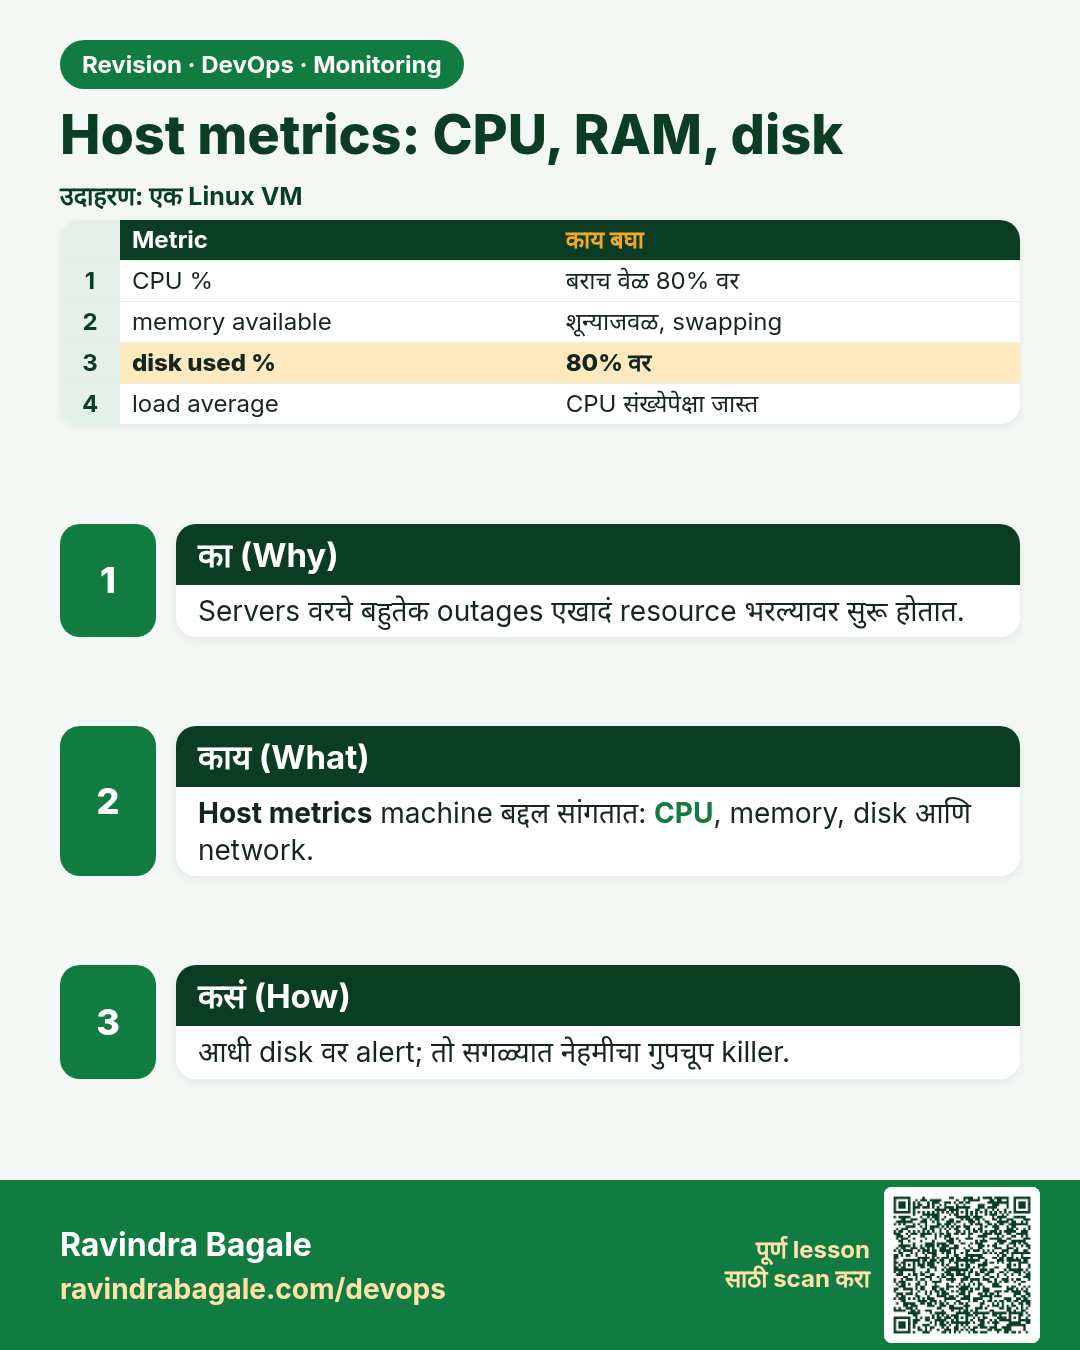
Host metrics: CPU, RAM, disk. Servers वरचे बहुतेक outages एखादं resource भरल्यावर सुरू होतात.
उजळणी (Revision) card 3 of 13: Host metrics: CPU, RAM, disk · PNG download करा · Card page उघडा

Lesson: 13.3 Host metrics — CPU, RAM, disk

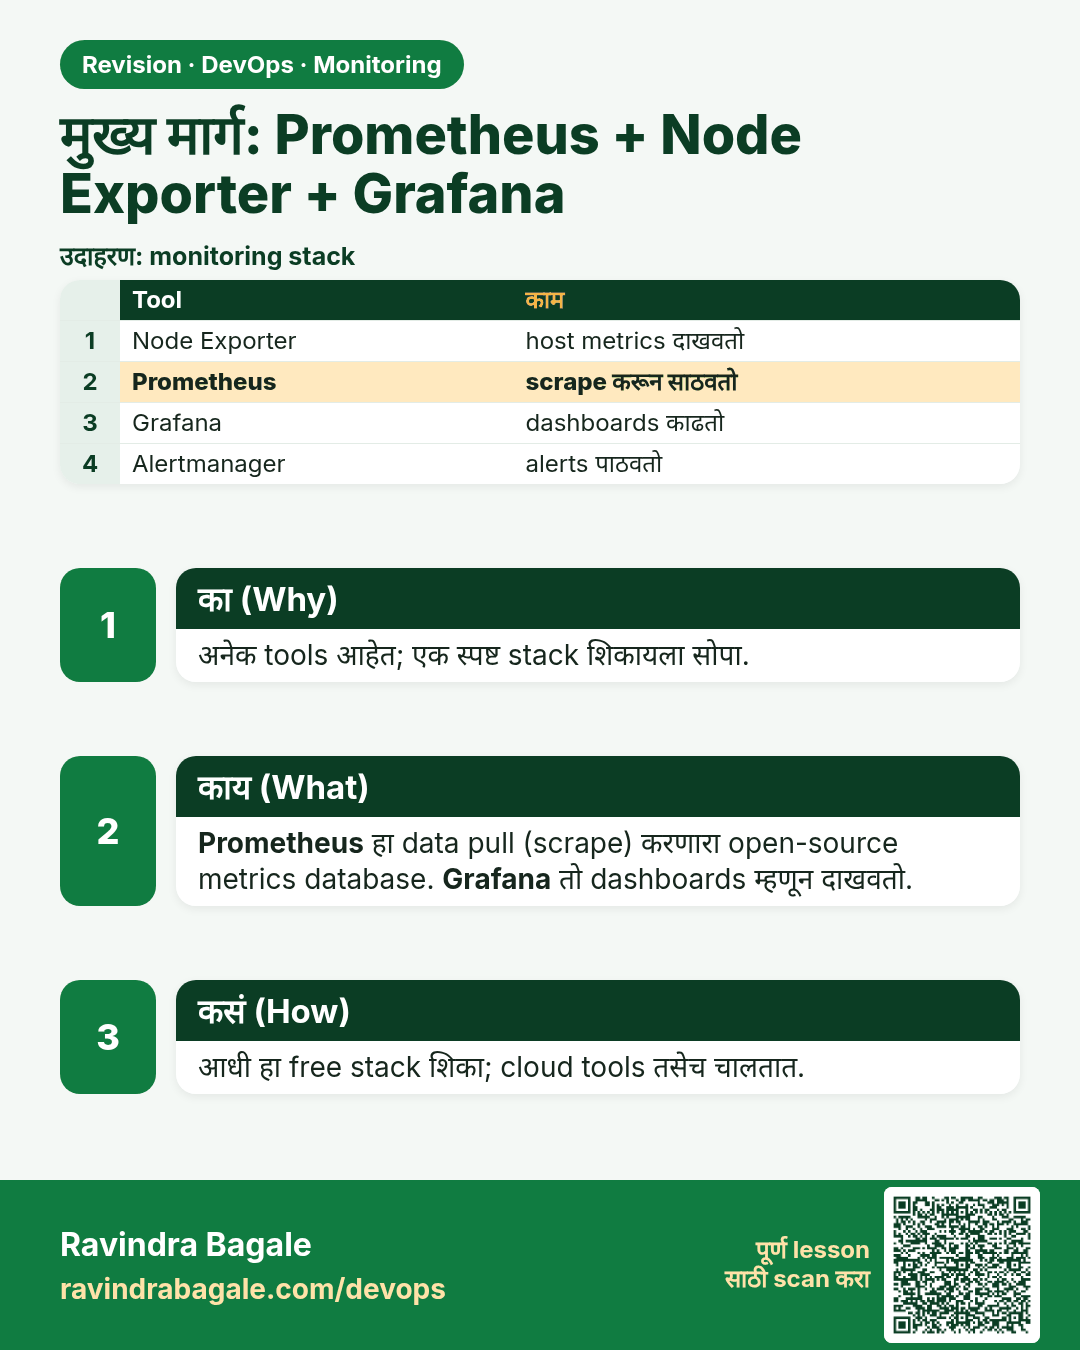
मुख्य मार्ग: Prometheus + Node Exporter + Grafana. अनेक tools आहेत; एक स्पष्ट stack शिकायला सोपा.
उजळणी (Revision) card 4 of 13: मुख्य मार्ग: Prometheus + Node Exporter + Grafana · PNG download करा · Card page उघडा

Lesson: 13.4 Primary path — Prometheus + Node Exporter + Grafana

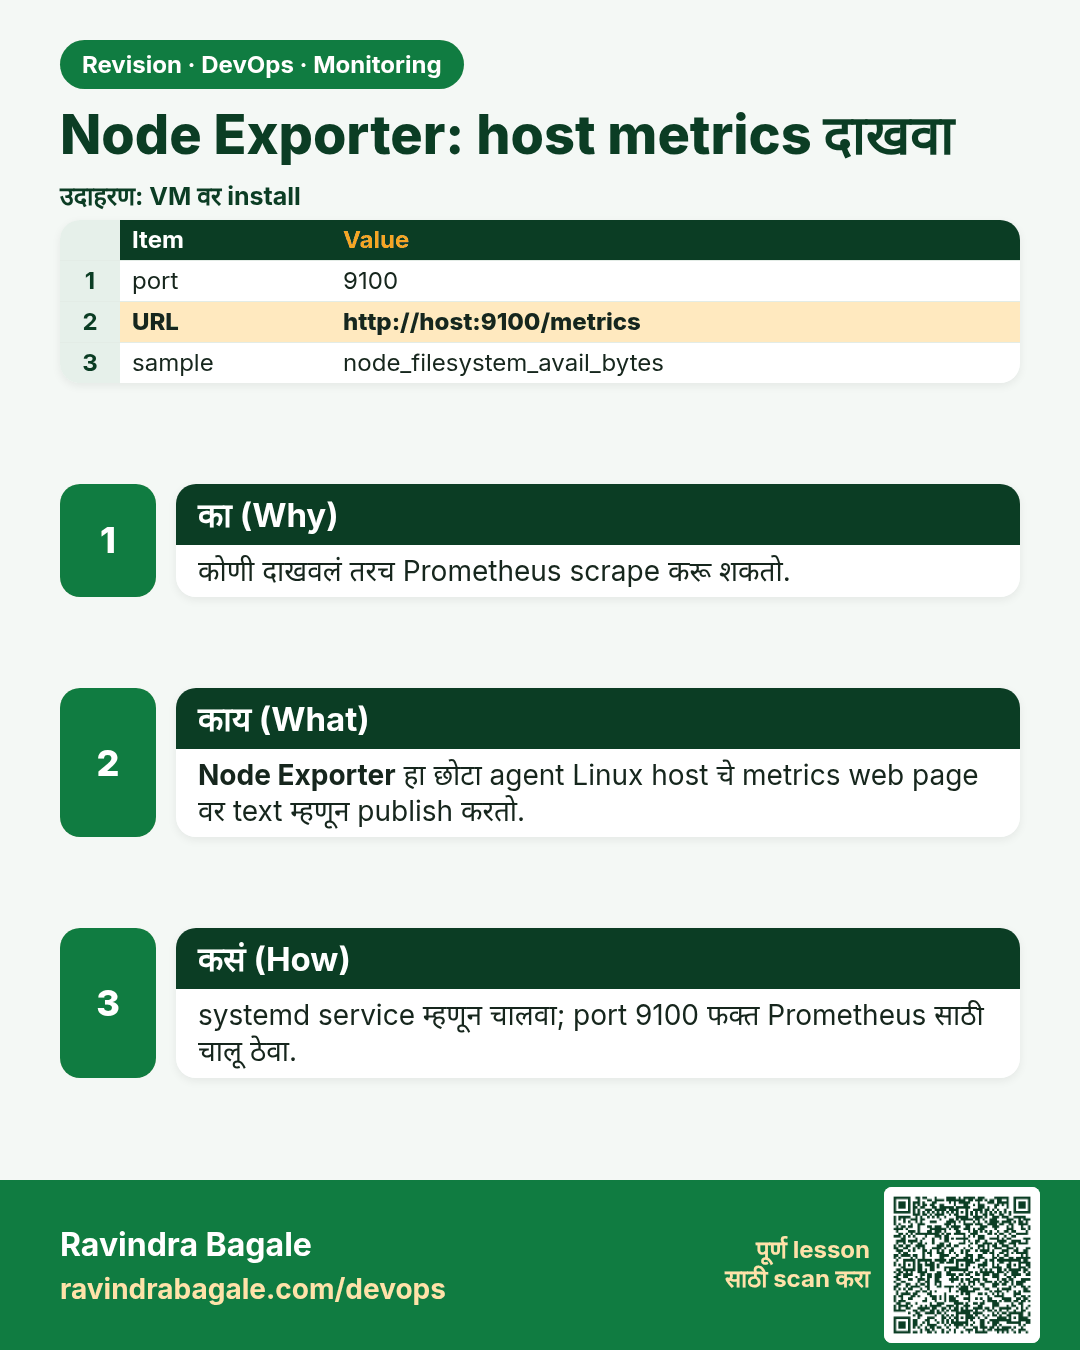
Node Exporter: host metrics दाखवा. कोणी दाखवलं तरच Prometheus scrape करू शकतो.
उजळणी (Revision) card 5 of 13: Node Exporter: host metrics दाखवा · PNG download करा · Card page उघडा

Lesson: 13.5 Node Exporter — expose host metrics

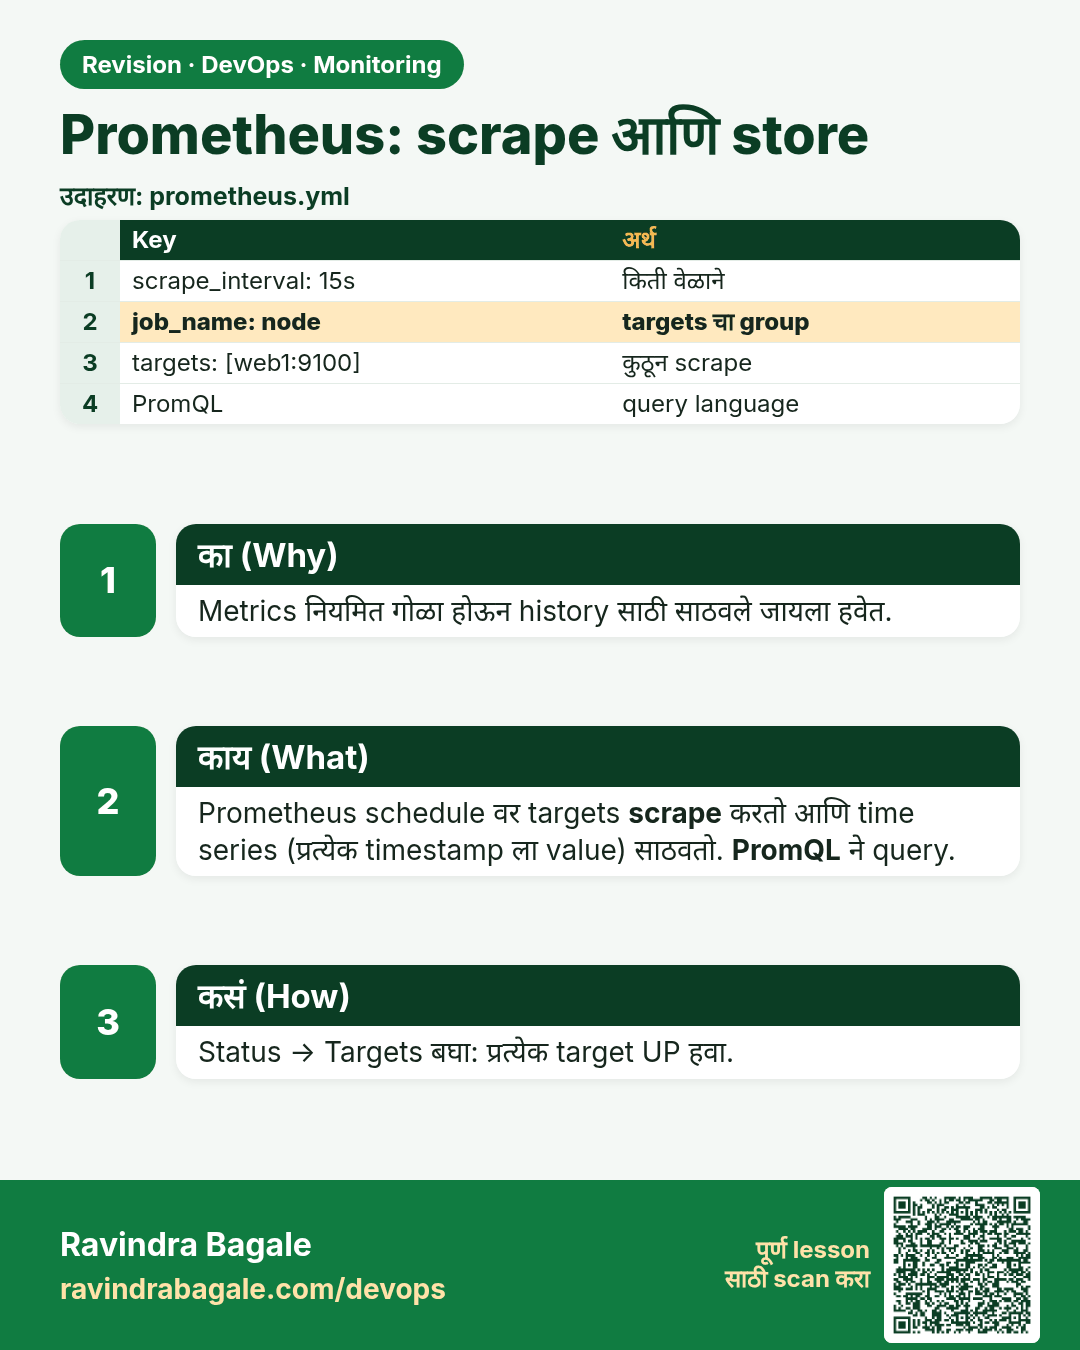
Prometheus: scrape आणि store. Metrics नियमित गोळा होऊन history साठी साठवले जायला हवेत.
उजळणी (Revision) card 6 of 13: Prometheus: scrape आणि store · PNG download करा · Card page उघडा

Lesson: 13.6 Prometheus — scrape and store

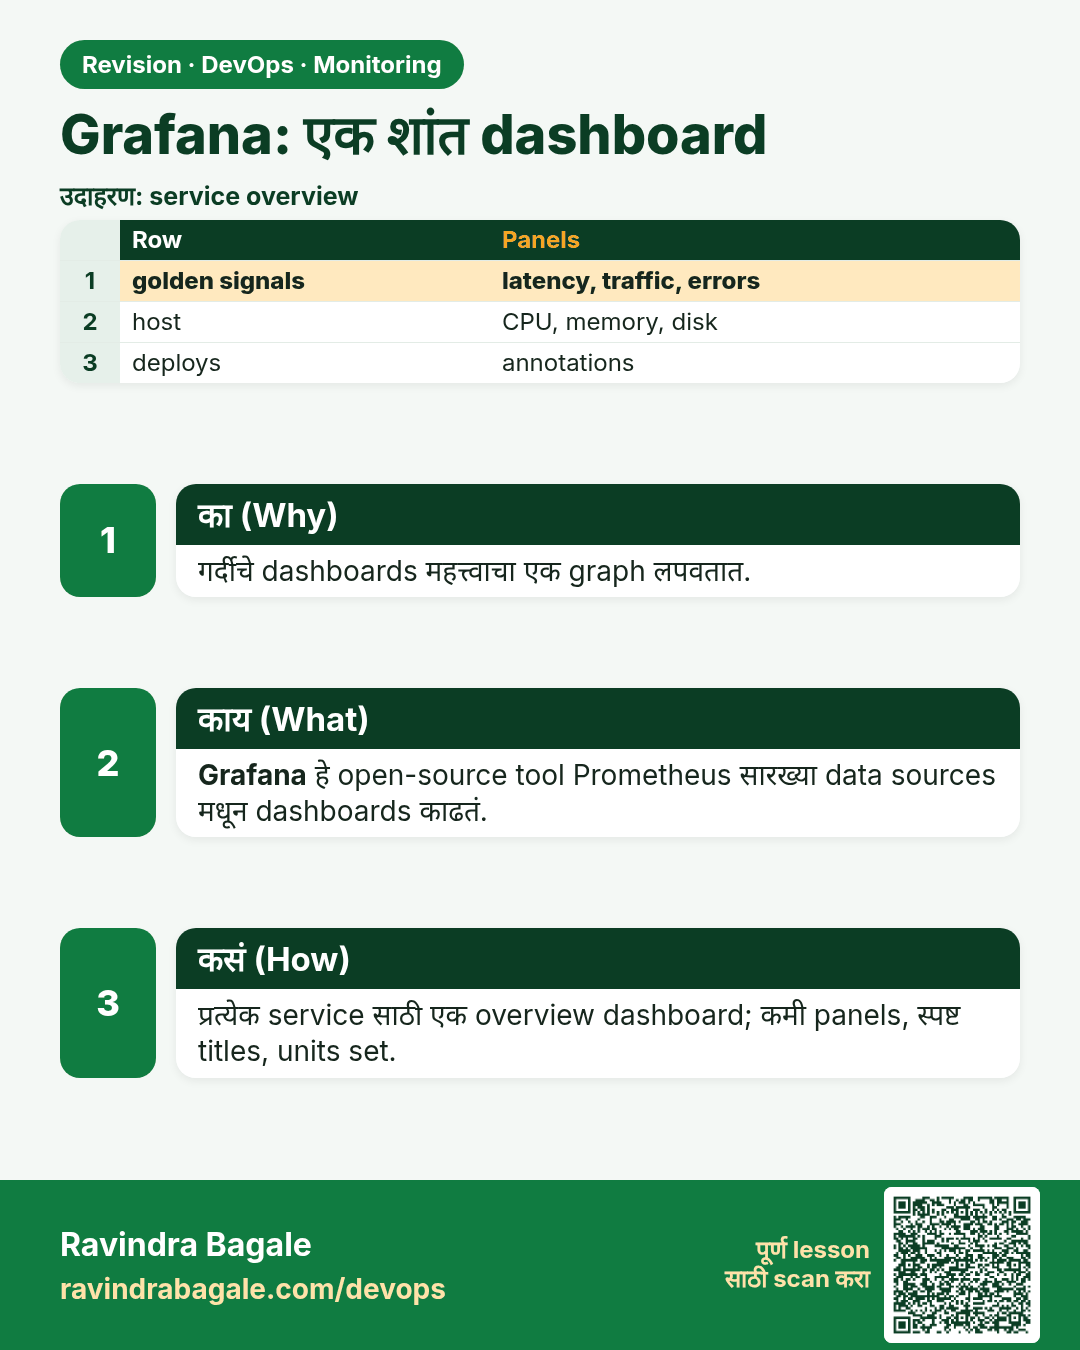
Grafana: एक शांत dashboard. गर्दीचे dashboards महत्त्वाचा एक graph लपवतात.
उजळणी (Revision) card 7 of 13: Grafana: एक शांत dashboard · PNG download करा · Card page उघडा

Lesson: 13.7 Grafana — one calm dashboard

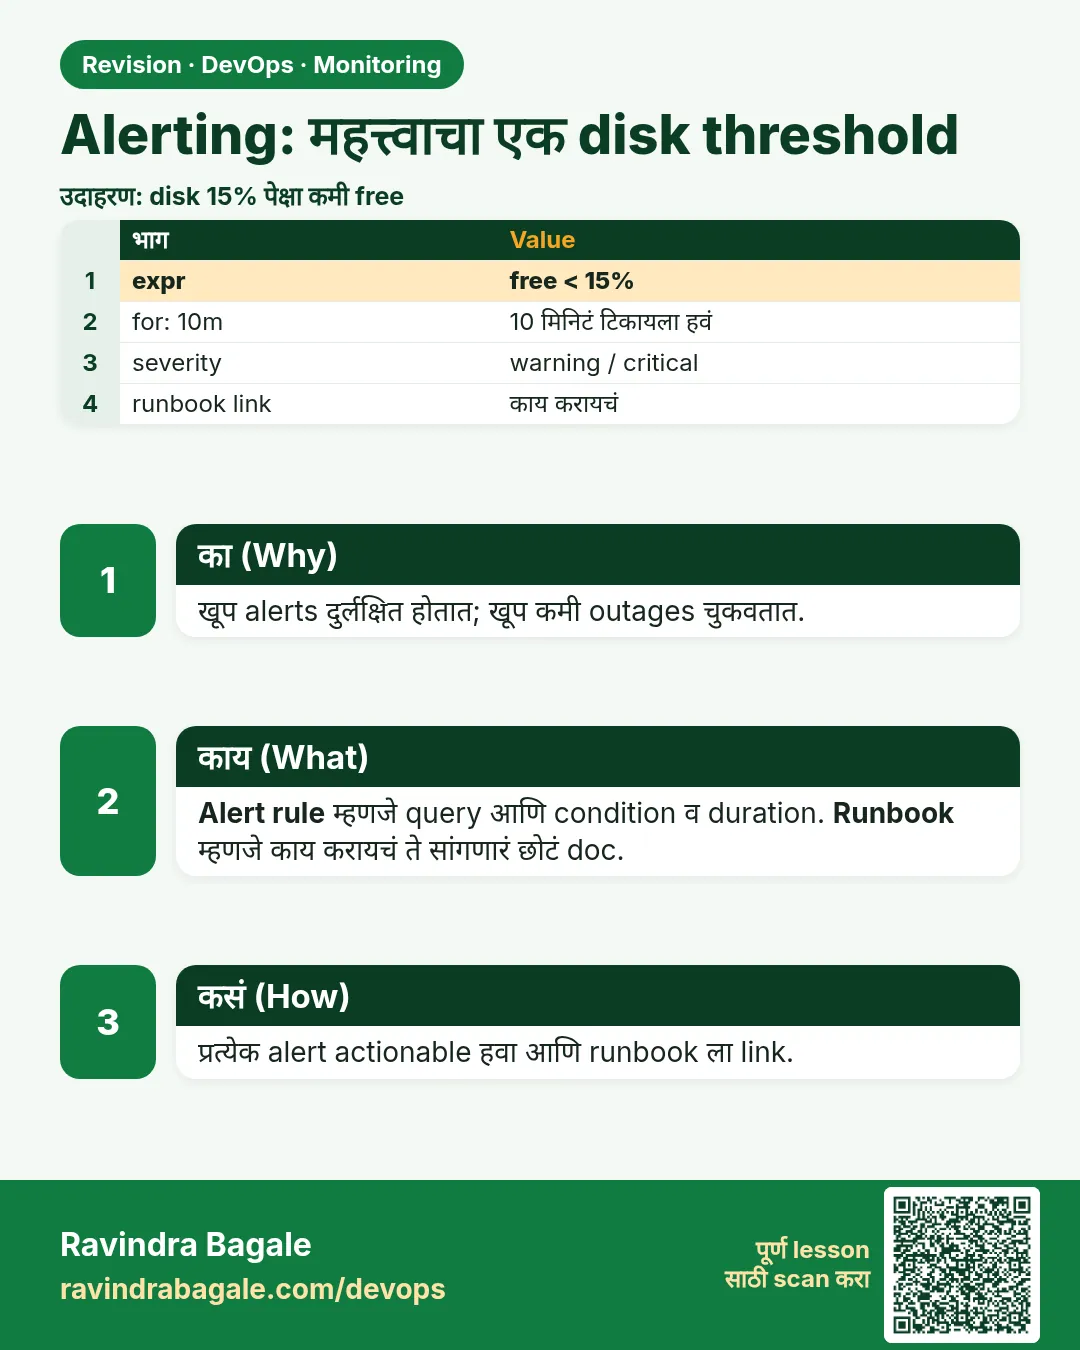
Alerting: महत्त्वाचा एक disk threshold. खूप alerts दुर्लक्षित होतात; खूप कमी outages चुकवतात.
उजळणी (Revision) card 8 of 13: Alerting: महत्त्वाचा एक disk threshold · PNG download करा · Card page उघडा

Lesson: 13.8 Alerting — one disk threshold that matters

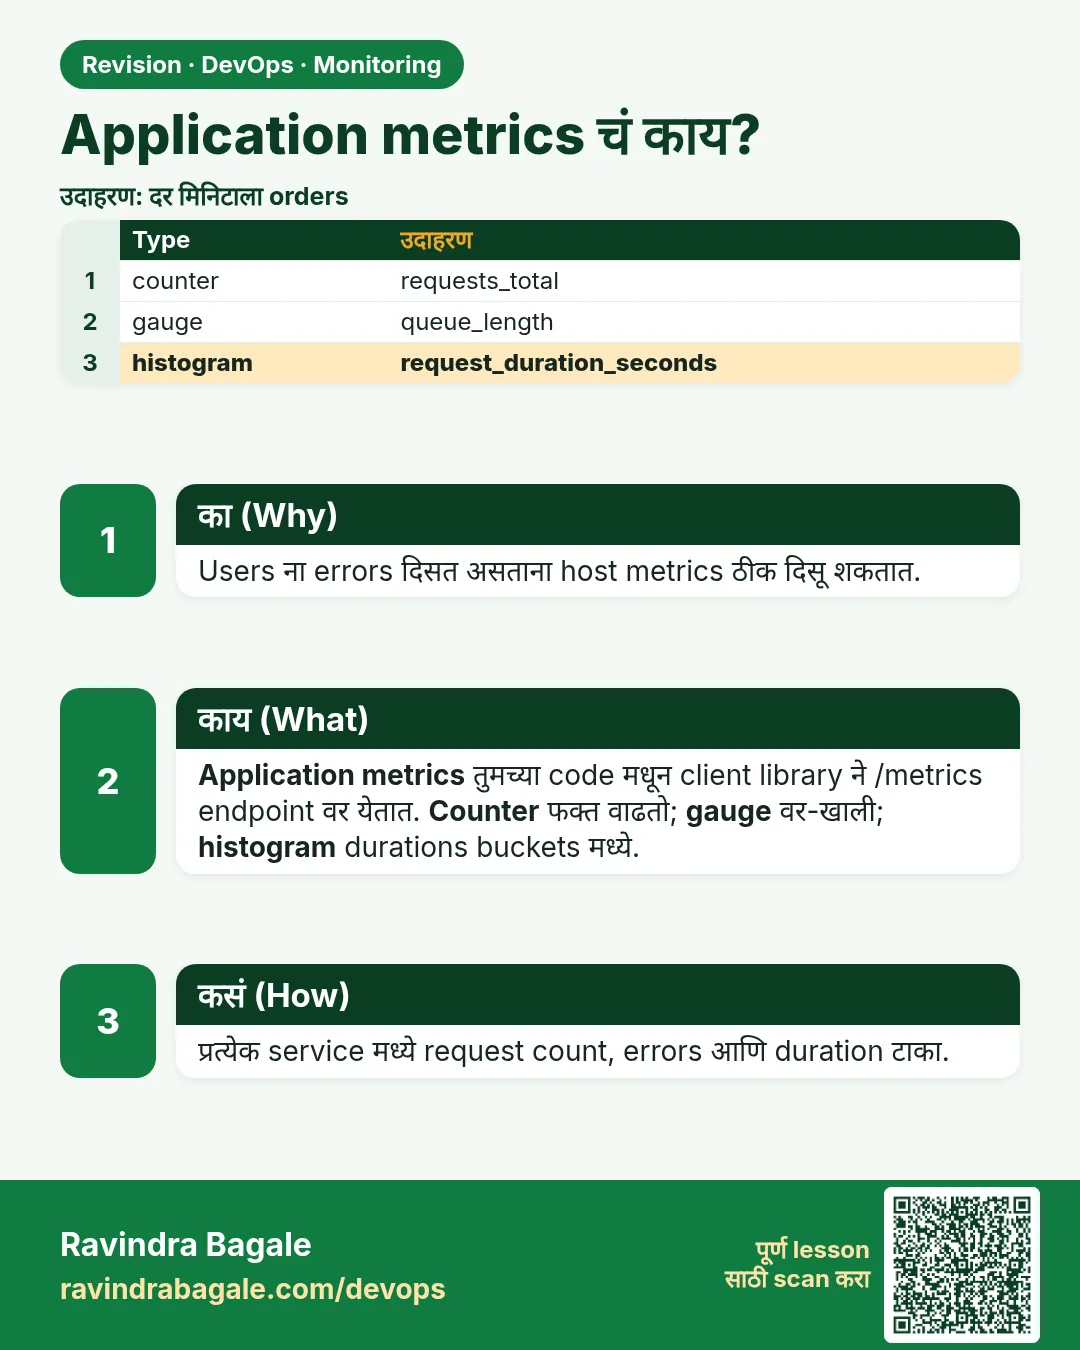
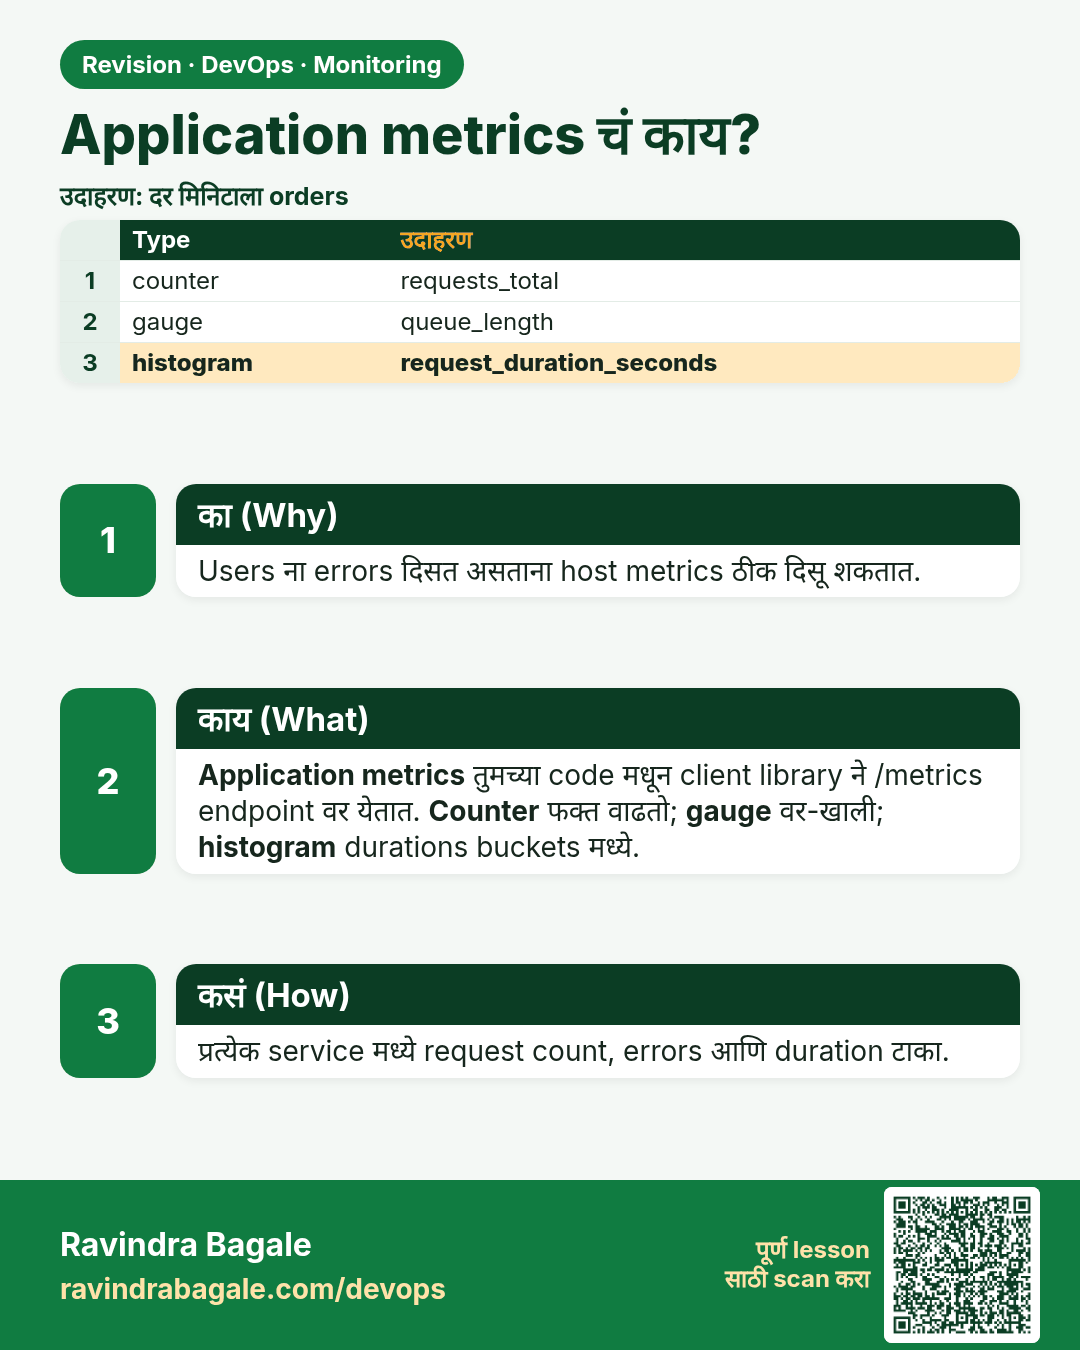
Application metrics चं काय?. Users ना errors दिसत असताना host metrics ठीक दिसू शकतात.
उजळणी (Revision) card 9 of 13: Application metrics चं काय? · PNG download करा · Card page उघडा

Lesson: 13.9 What about application metrics?

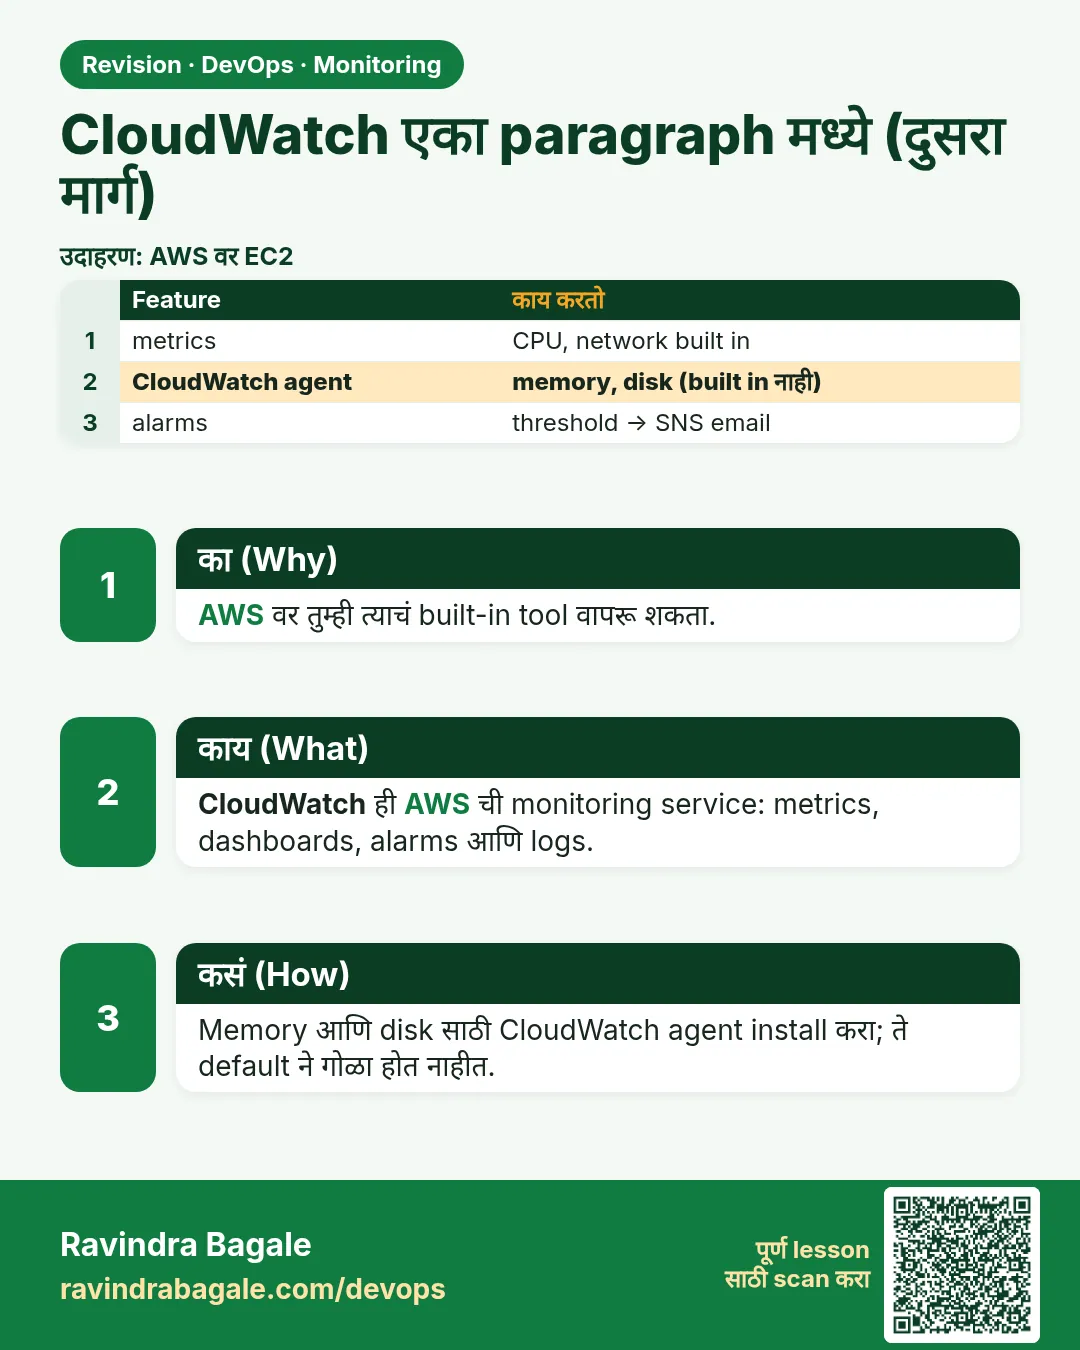
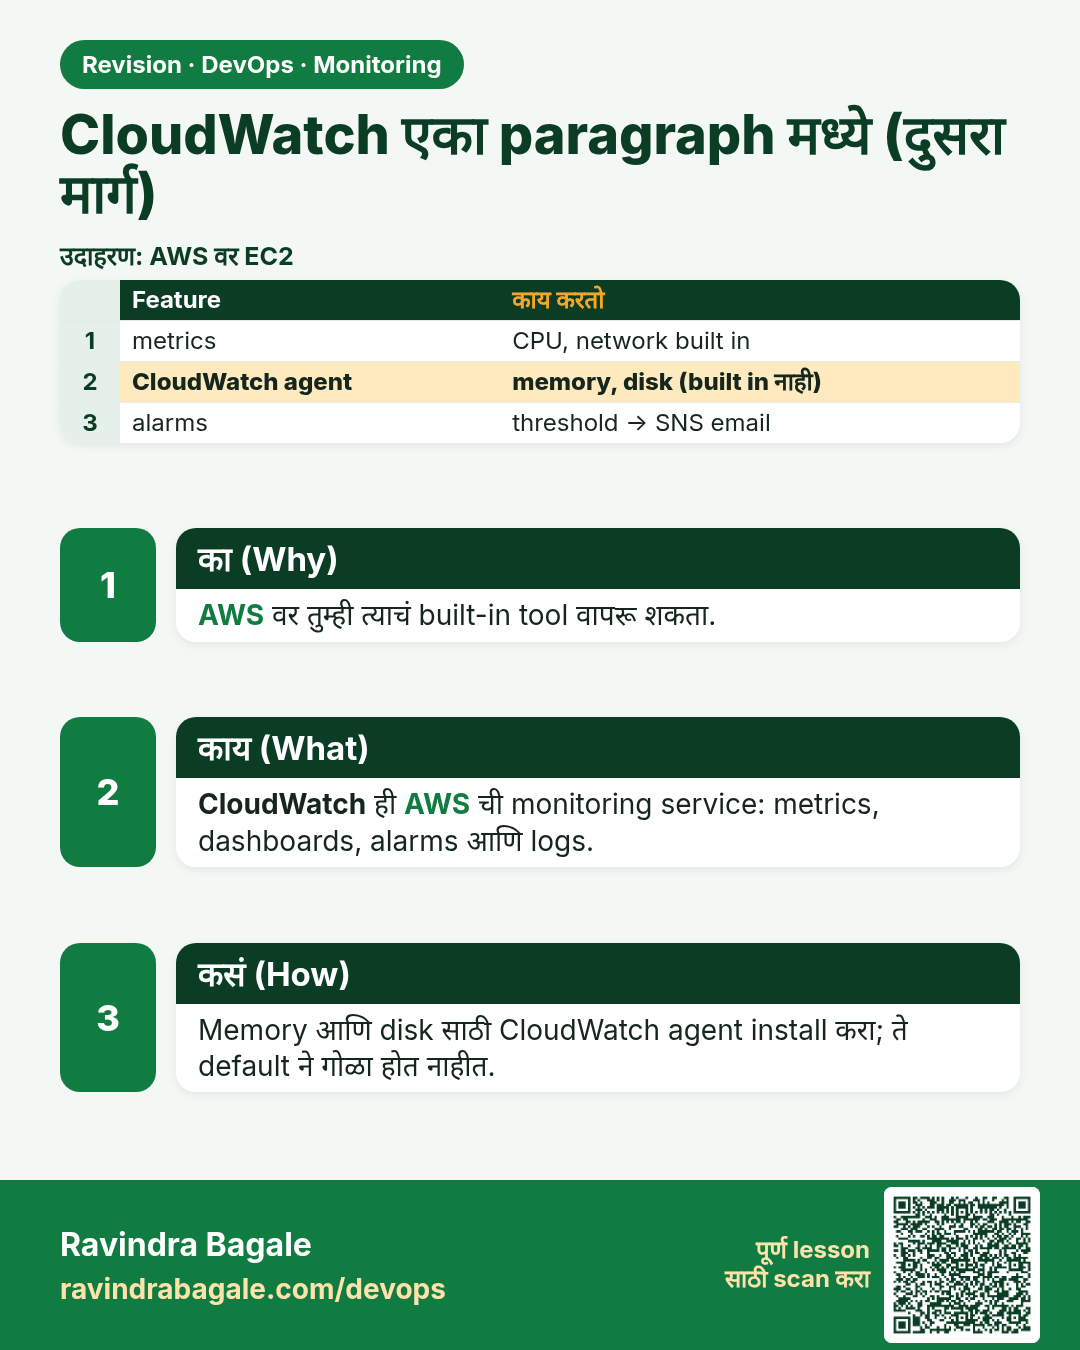
CloudWatch एका paragraph मध्ये (दुसरा मार्ग). AWS वर तुम्ही त्याचं built-in tool वापरू शकता.
उजळणी (Revision) card 10 of 13: CloudWatch एका paragraph मध्ये (दुसरा मार्ग) · PNG download करा · Card page उघडा

Lesson: 13.10 CloudWatch in one paragraph (secondary path)

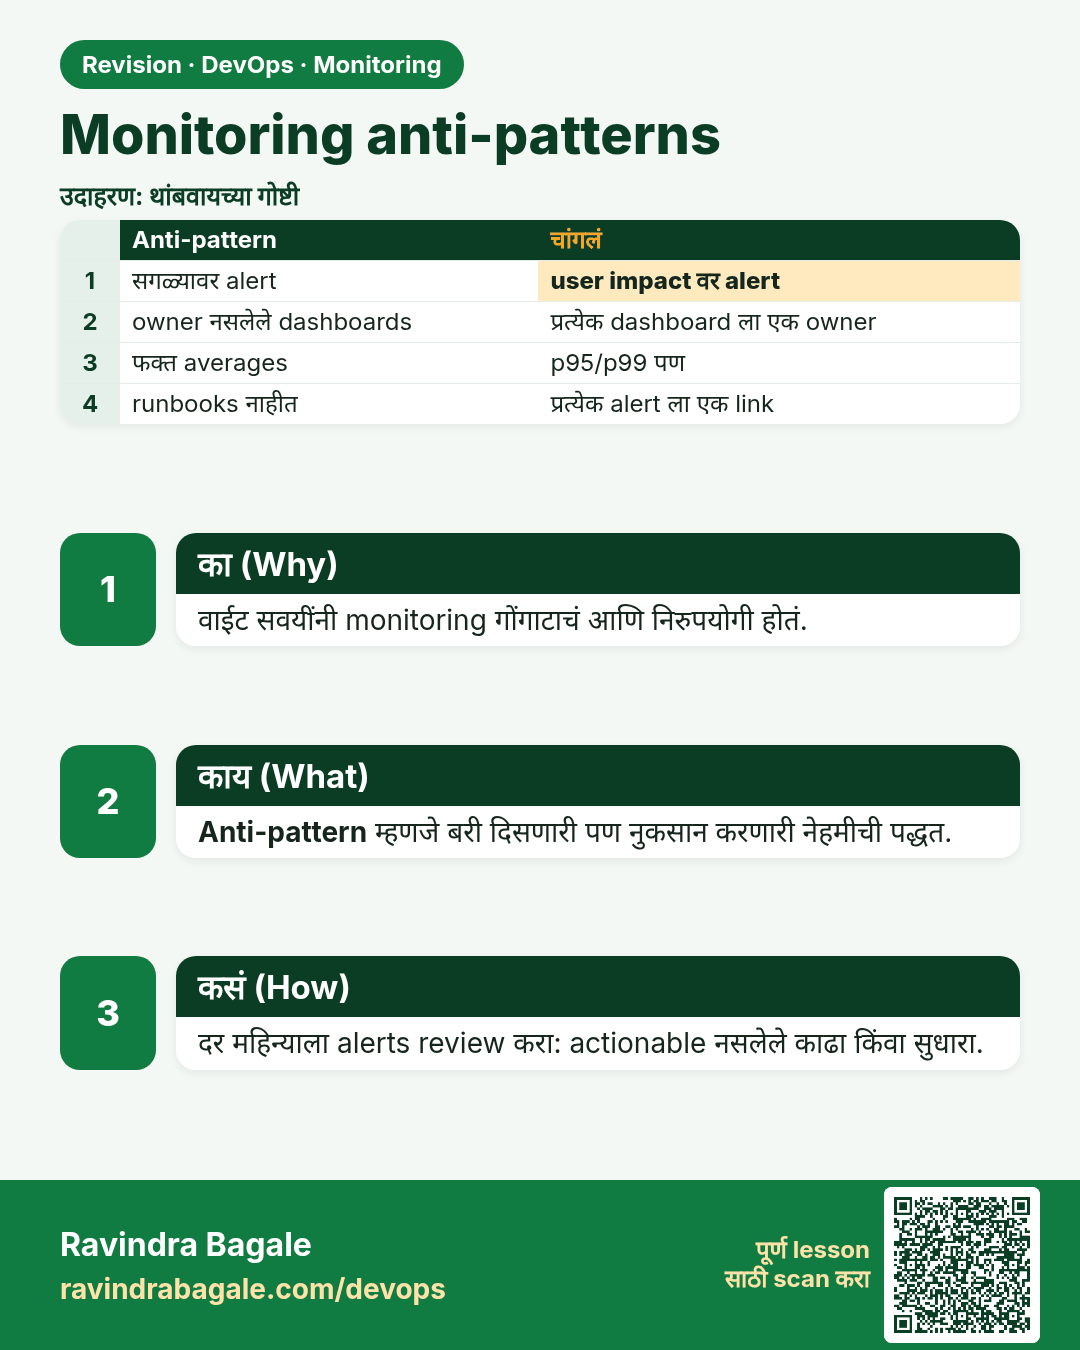
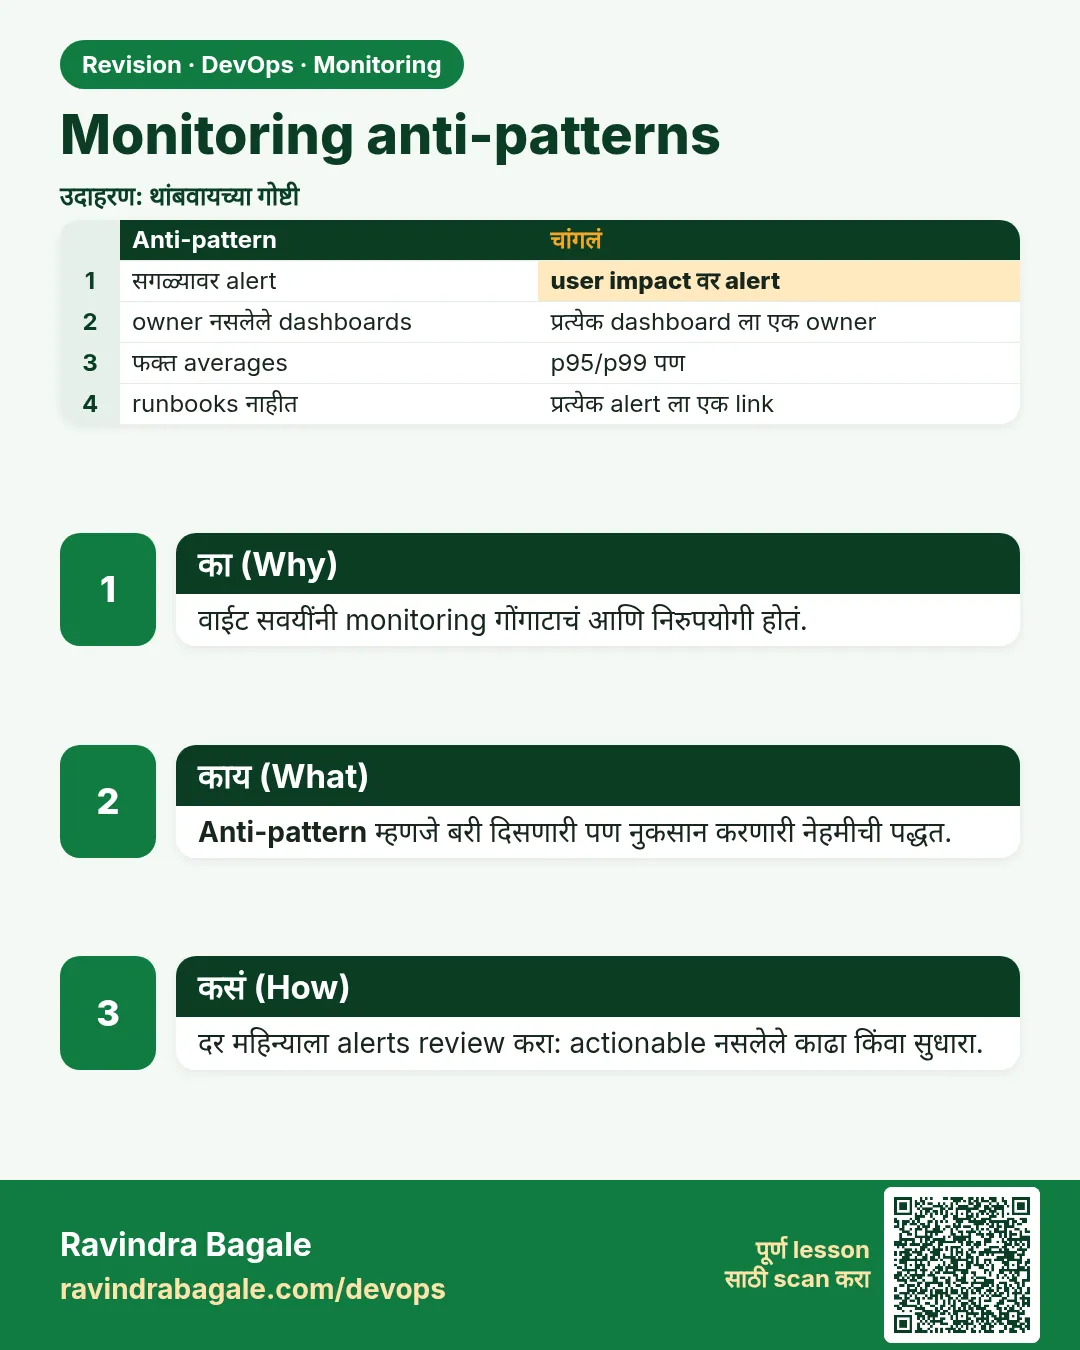
Monitoring anti-patterns. वाईट सवयींनी monitoring गोंगाटाचं आणि निरुपयोगी होतं.
उजळणी (Revision) card 11 of 13: Monitoring anti-patterns · PNG download करा · Card page उघडा

Lesson: 13.11 Anti-patterns

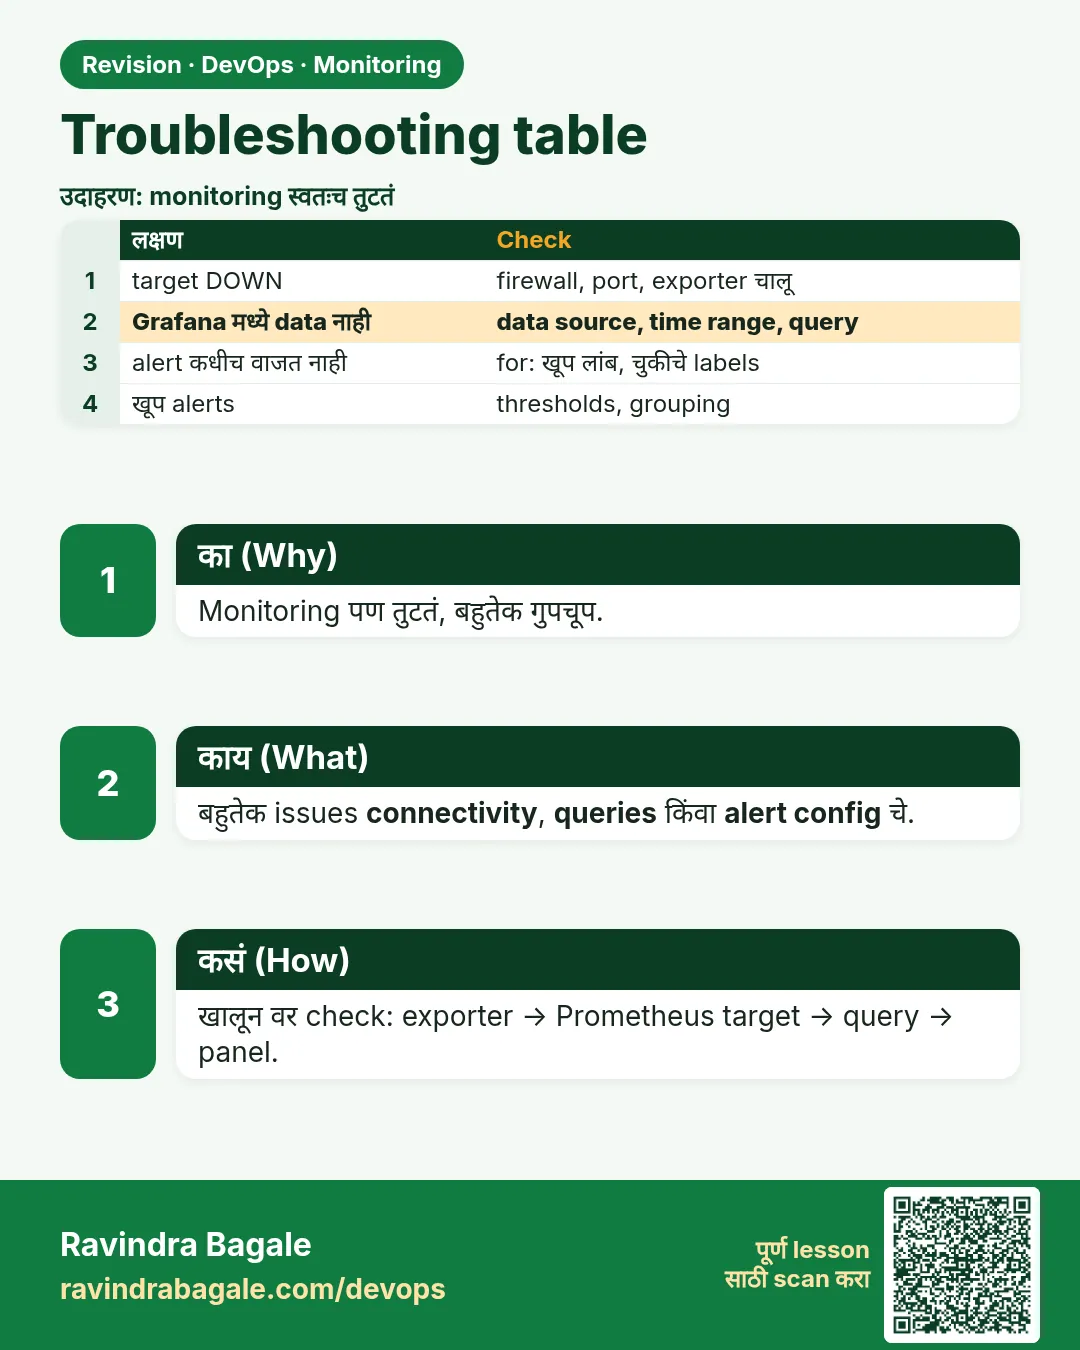
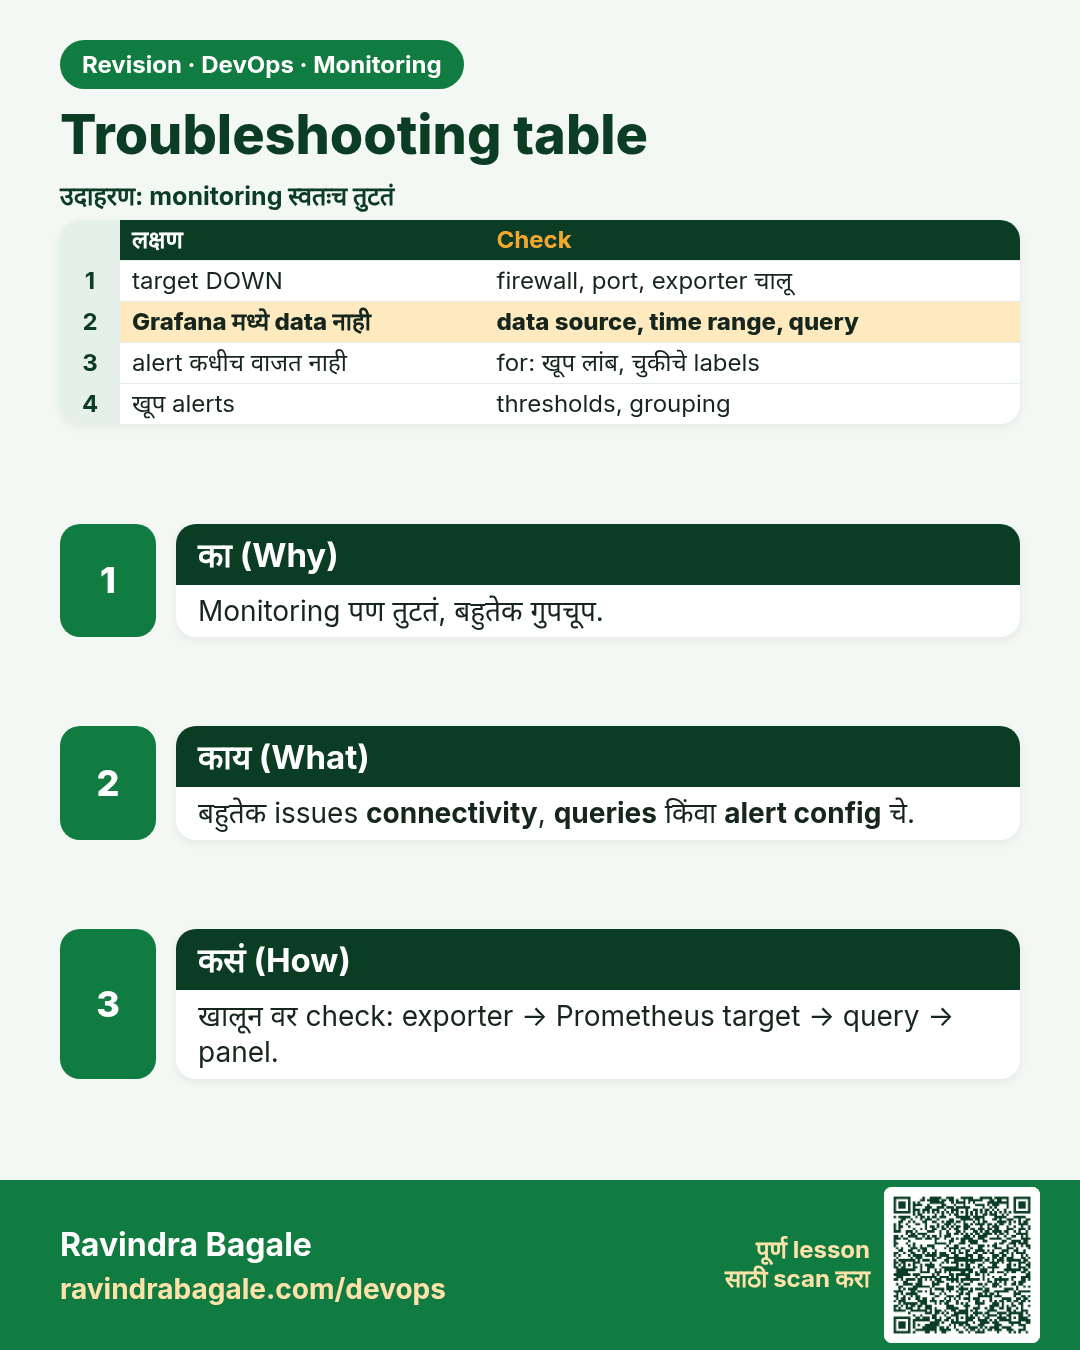
Troubleshooting table. Monitoring पण तुटतं, बहुतेक गुपचूप.
उजळणी (Revision) card 12 of 13: Troubleshooting table · PNG download करा · Card page उघडा

Lesson: 13.12 Troubleshooting table

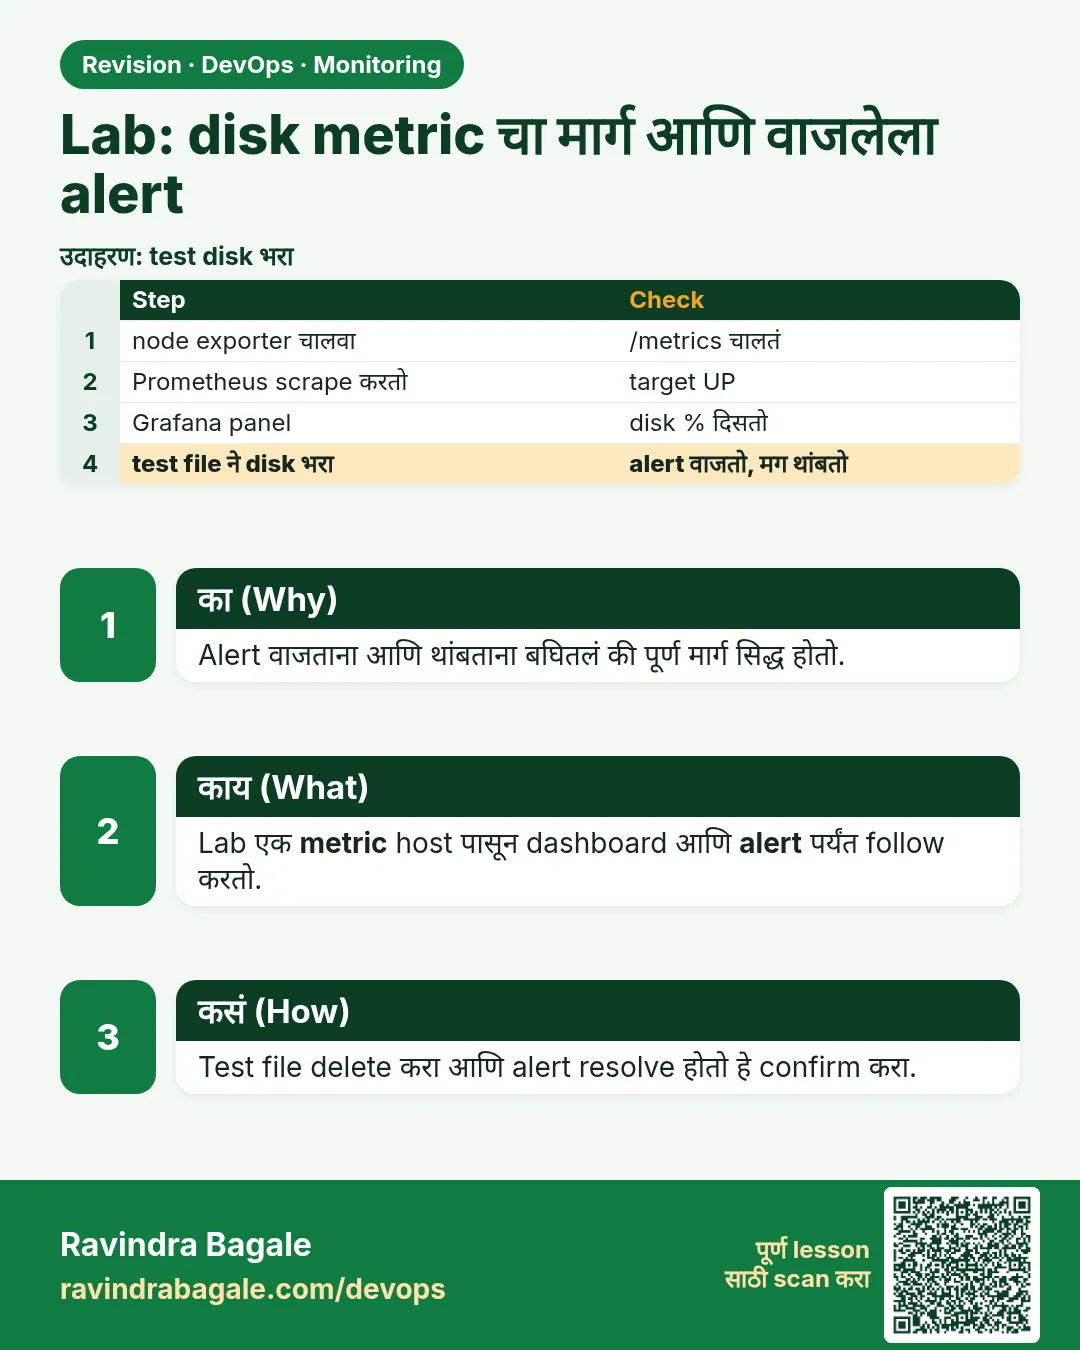
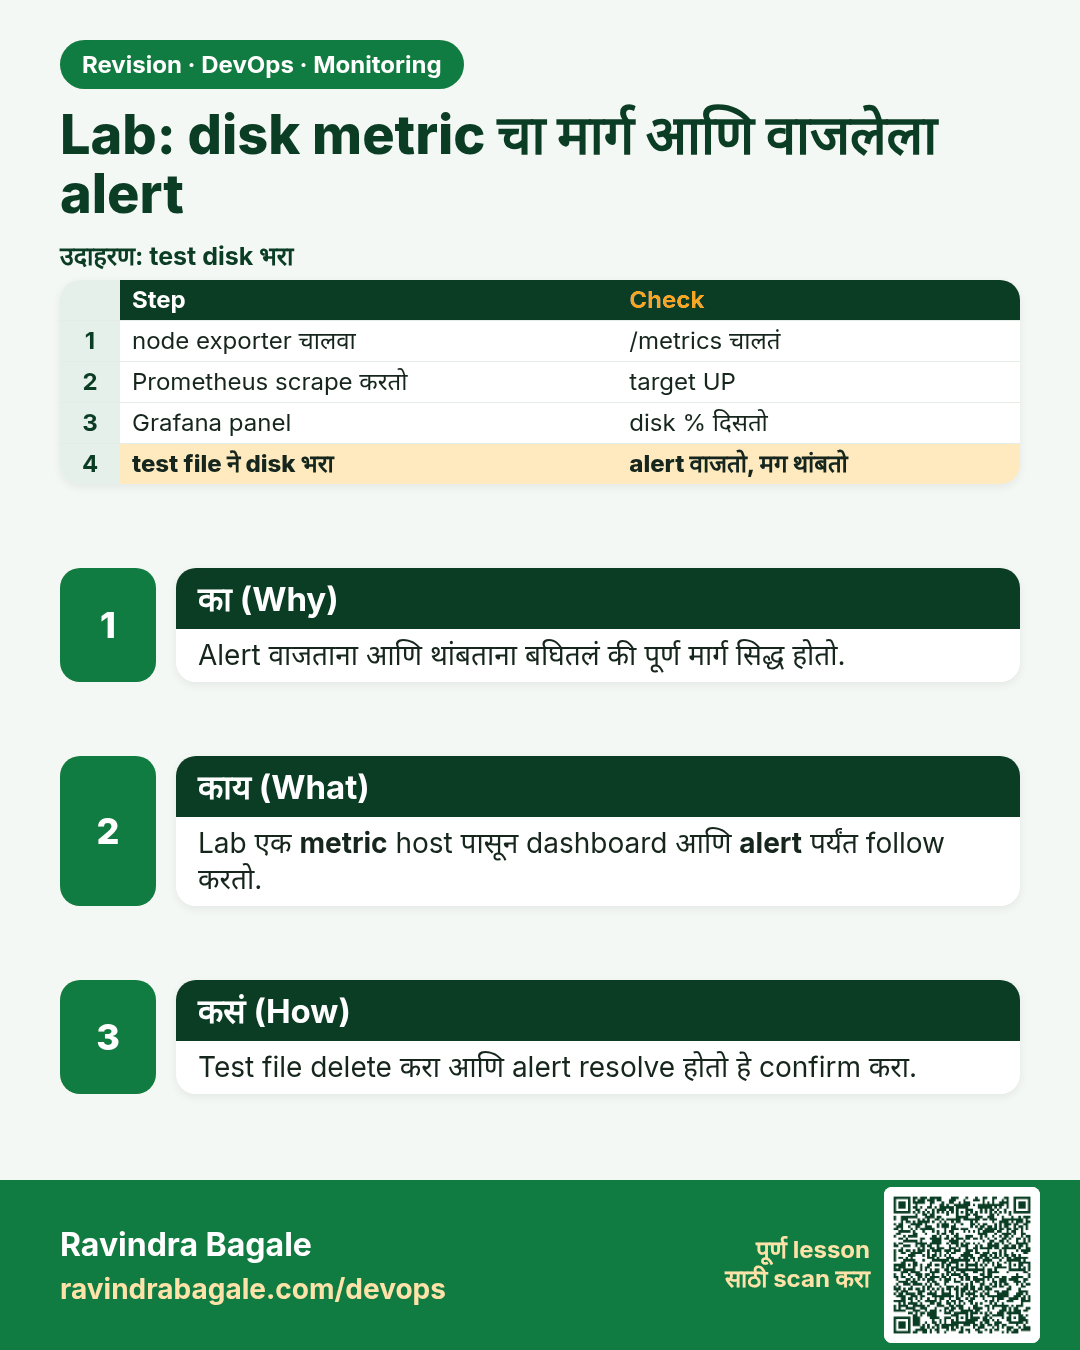
Lab: disk metric चा मार्ग आणि वाजलेला alert. Alert वाजताना आणि थांबताना बघितलं की पूर्ण मार्ग सिद्ध होतो.
उजळणी (Revision) card 13 of 13: Lab: disk metric चा मार्ग आणि वाजलेला alert · PNG download करा · Card page उघडा

Lesson: 13.13 Lab — disk metric path and a triggered alert

मुलाखत (Interview) cards

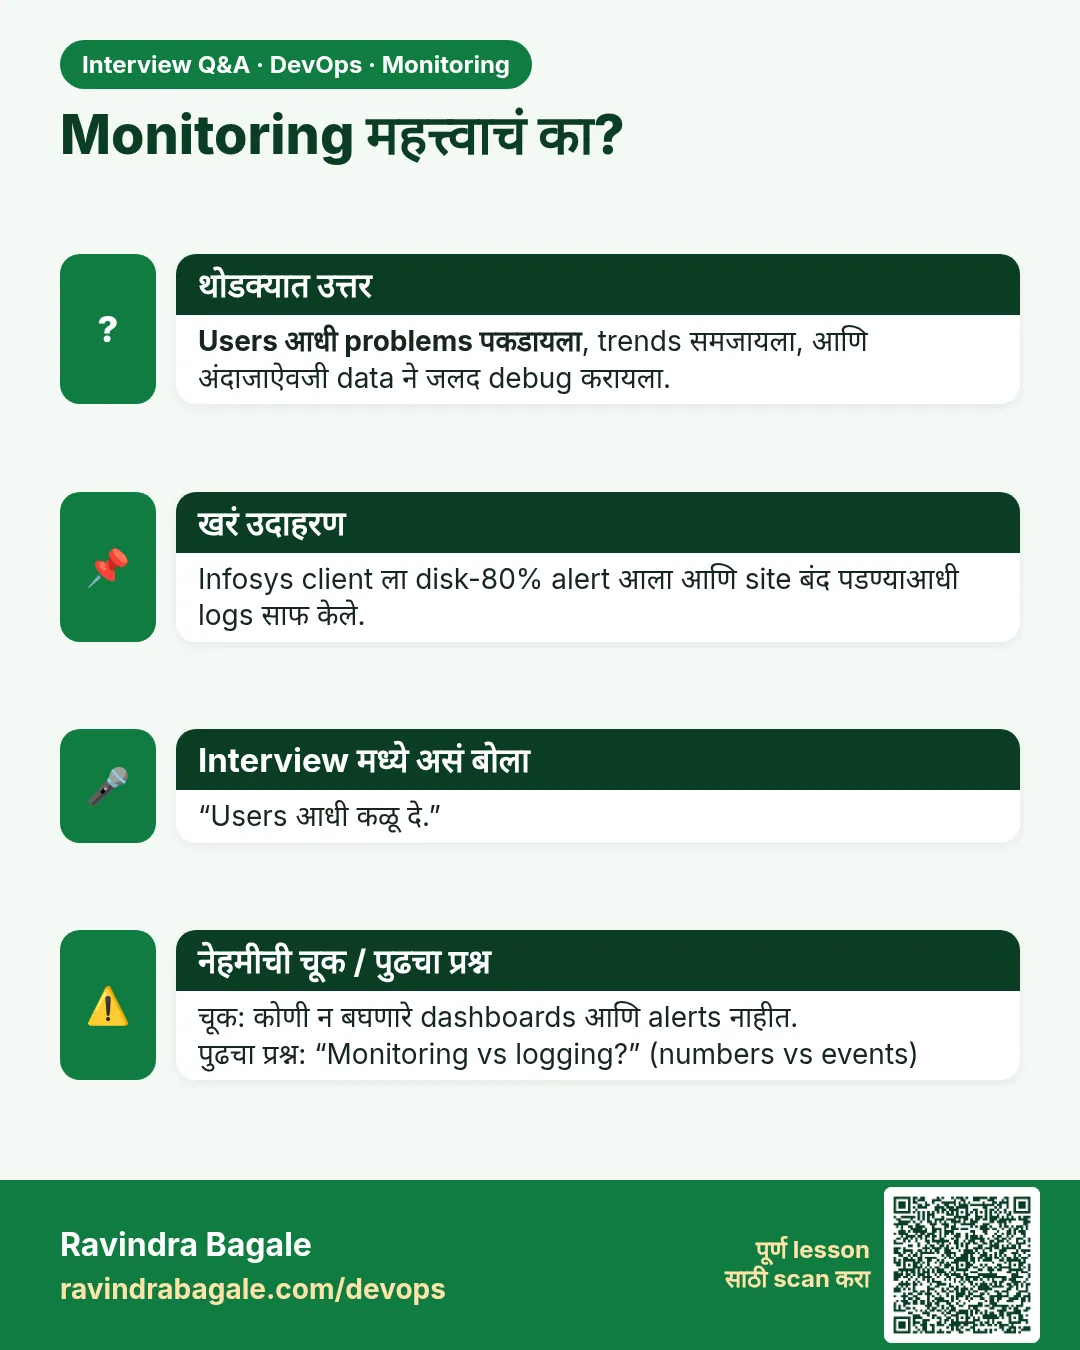
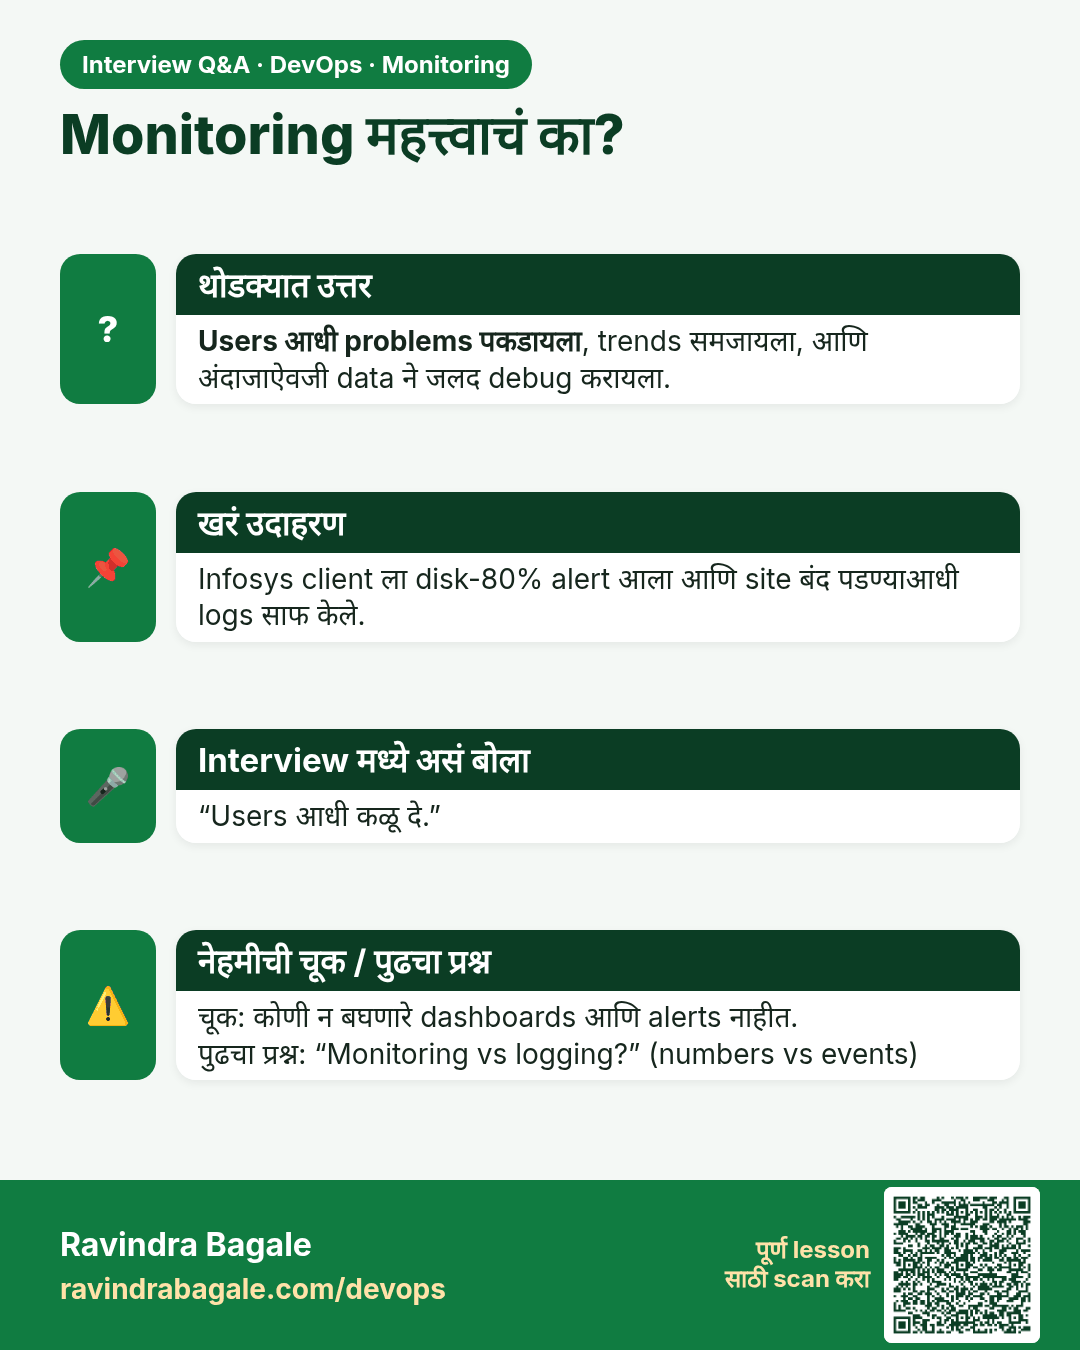
Monitoring महत्त्वाचं का? Users आधी problems पकडायला, trends समजायला, आणि अंदाजाऐवजी data ने जलद debug करायला.
मुलाखत (Interview) card 1 of 13: Monitoring महत्त्वाचं का? · PNG download करा · Card page उघडा

Lesson: 13.1 Why monitor — dashboard before the outage call
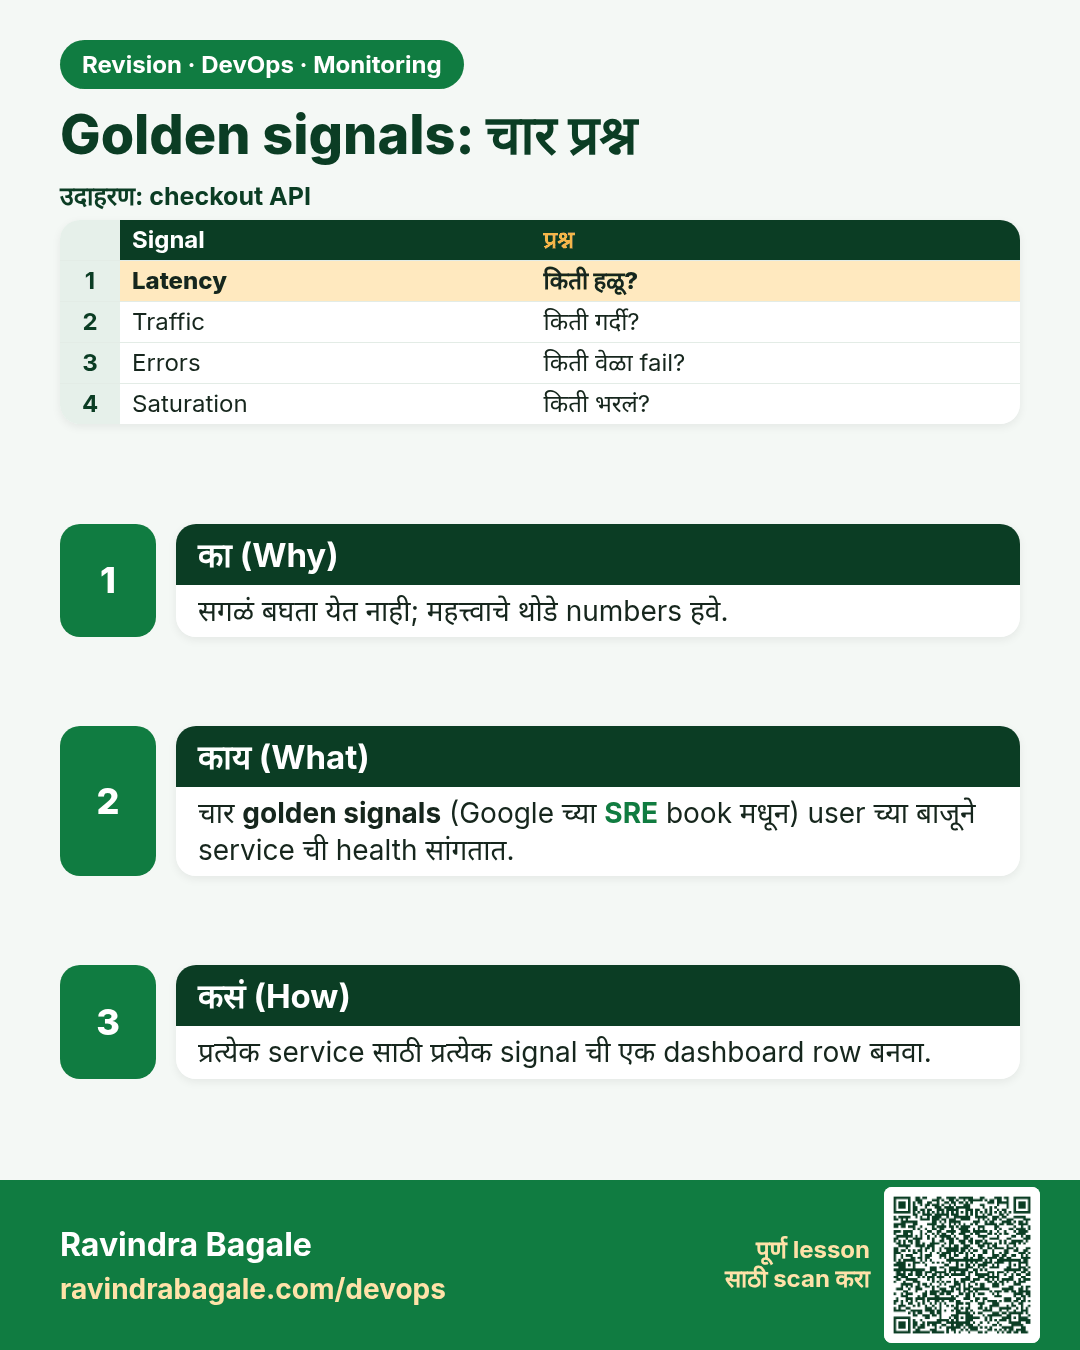
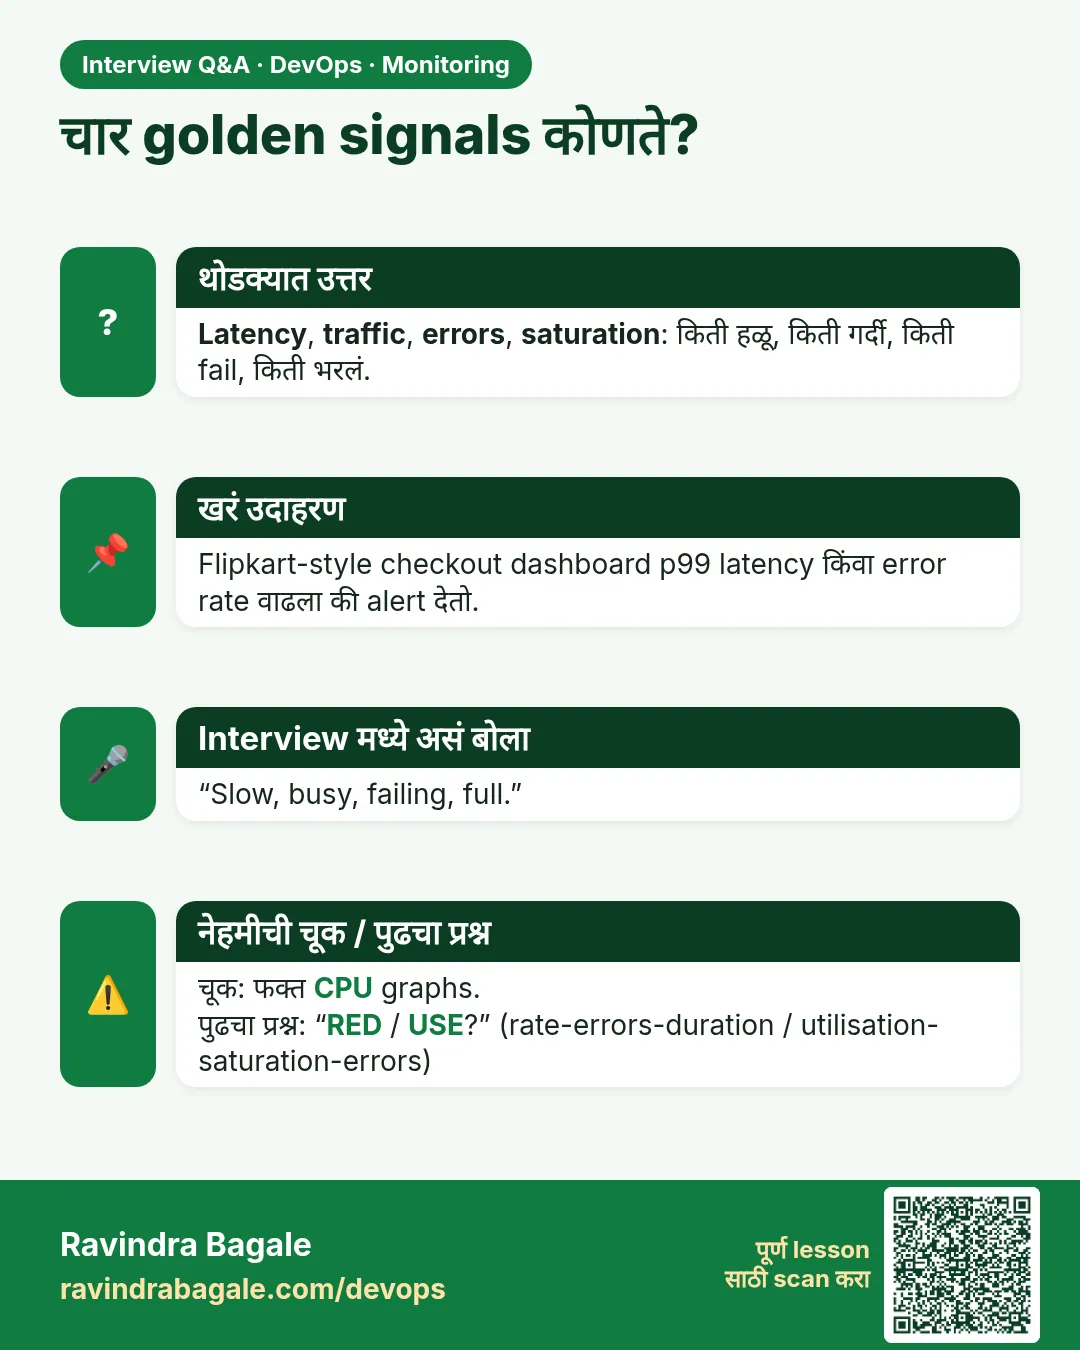
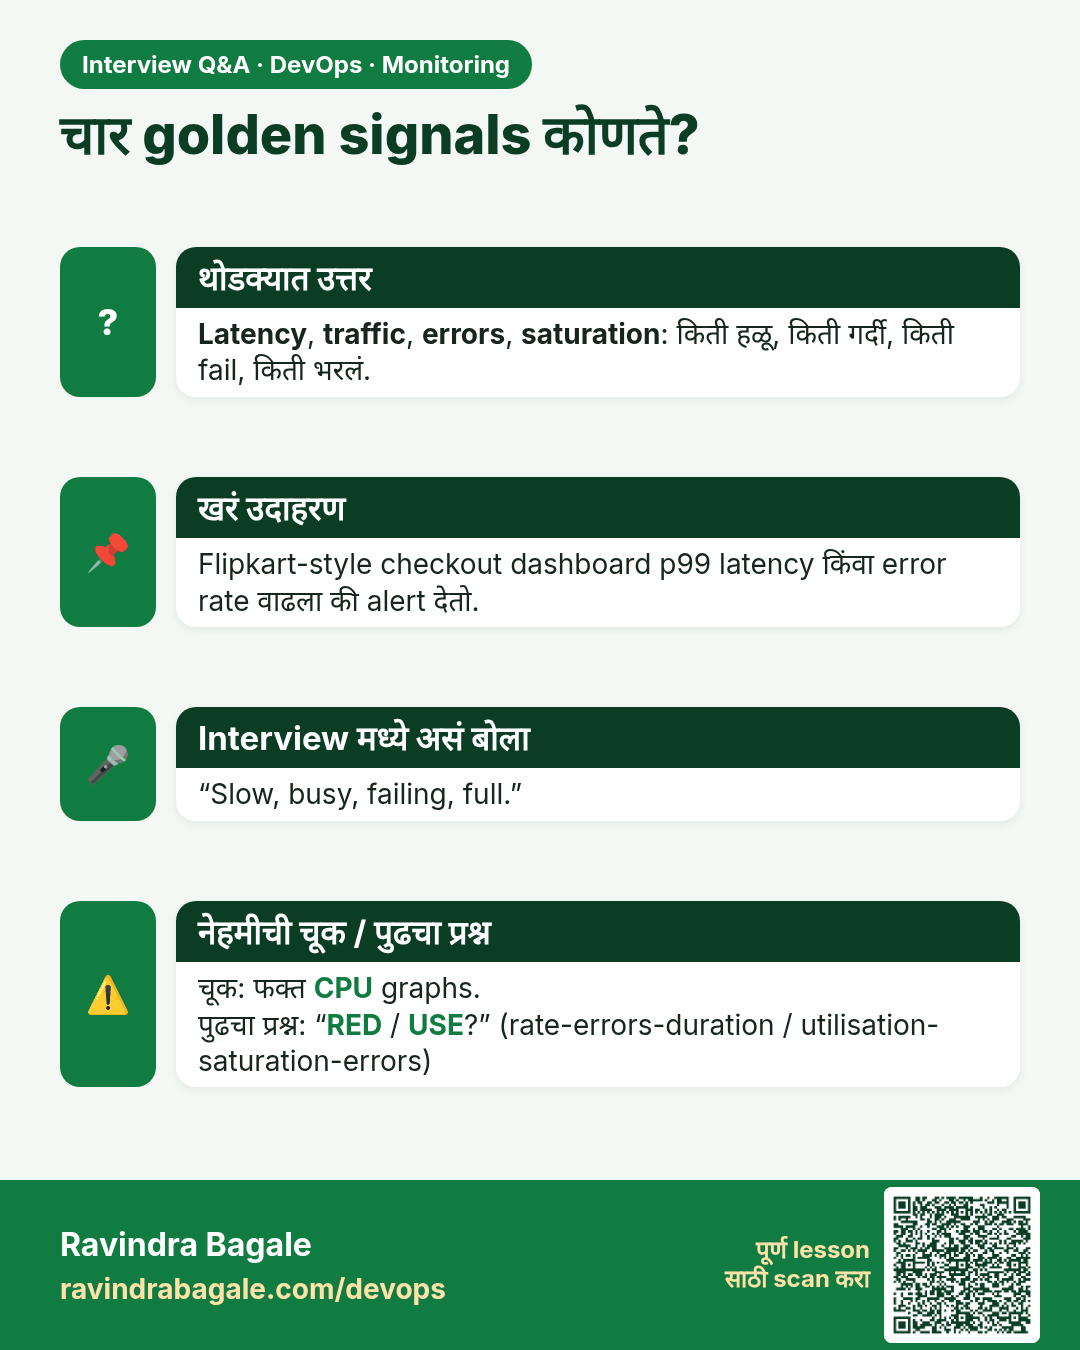
चार golden signals कोणते? Latency, traffic, errors, saturation: किती हळू, किती गर्दी, किती fail, किती भरलं.
मुलाखत (Interview) card 2 of 13: चार golden signals कोणते? · PNG download करा · Card page उघडा

Lesson: 13.2 Golden signals — four questions in plain English
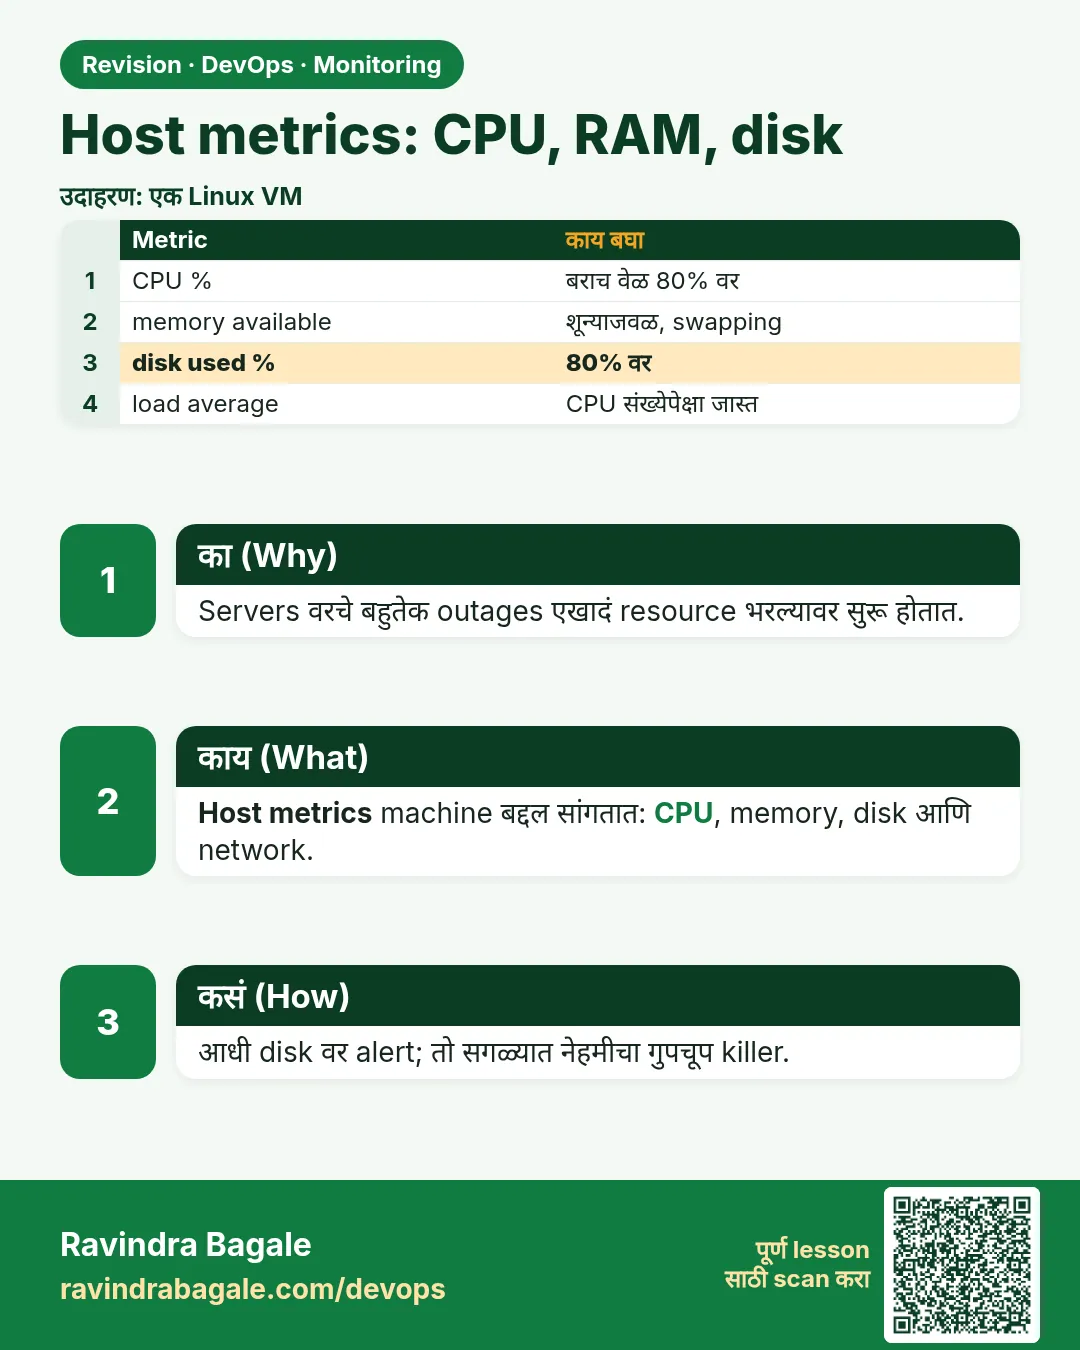
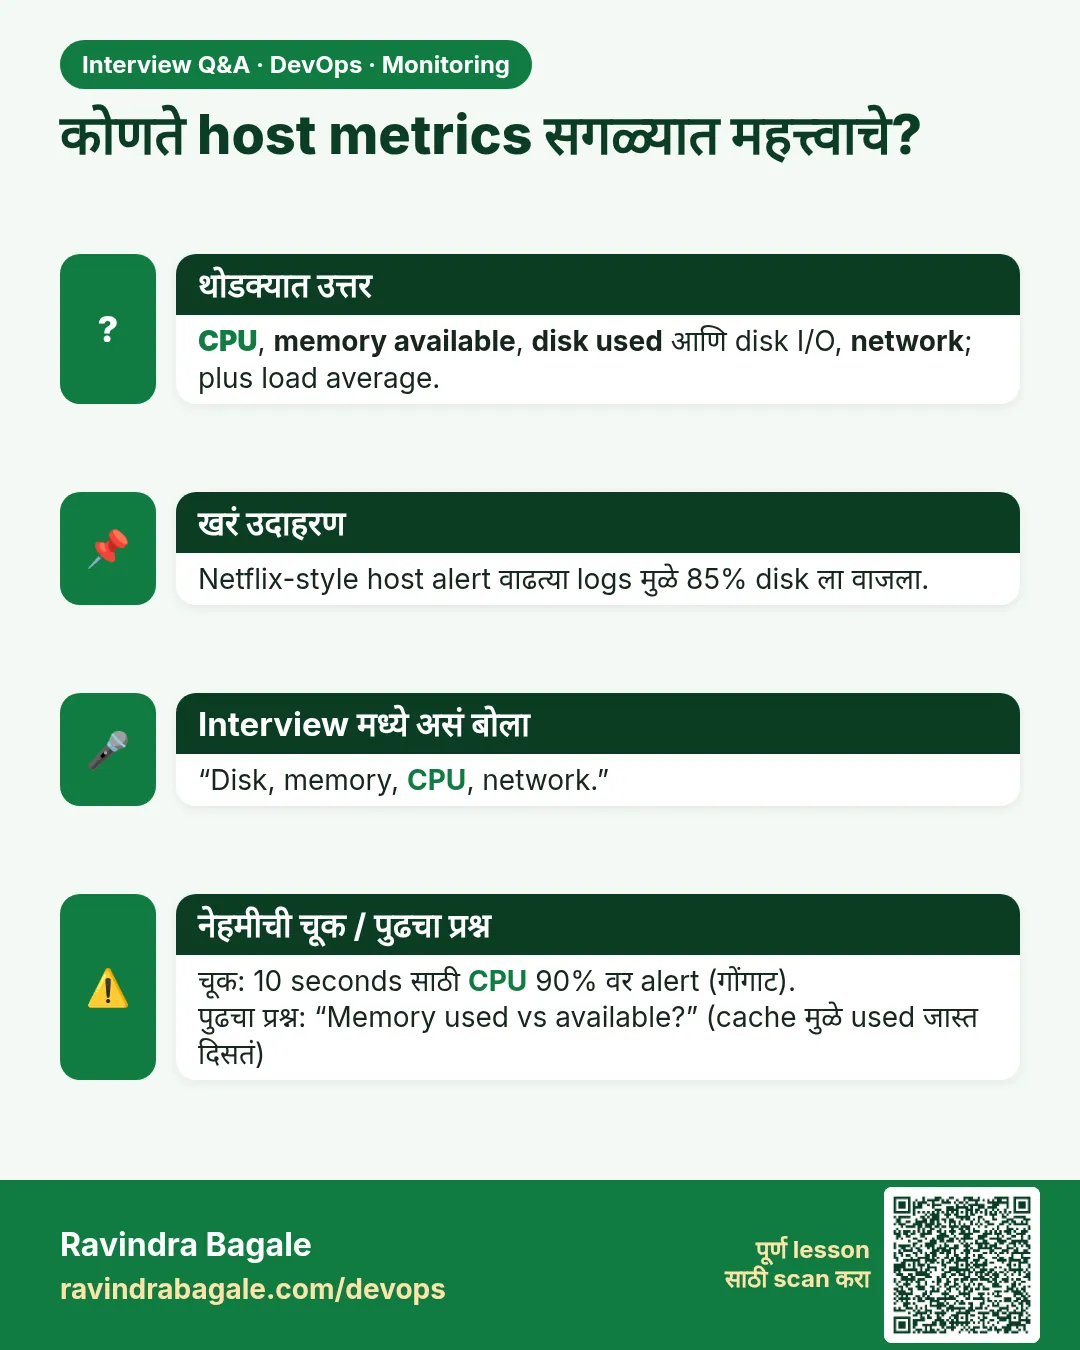
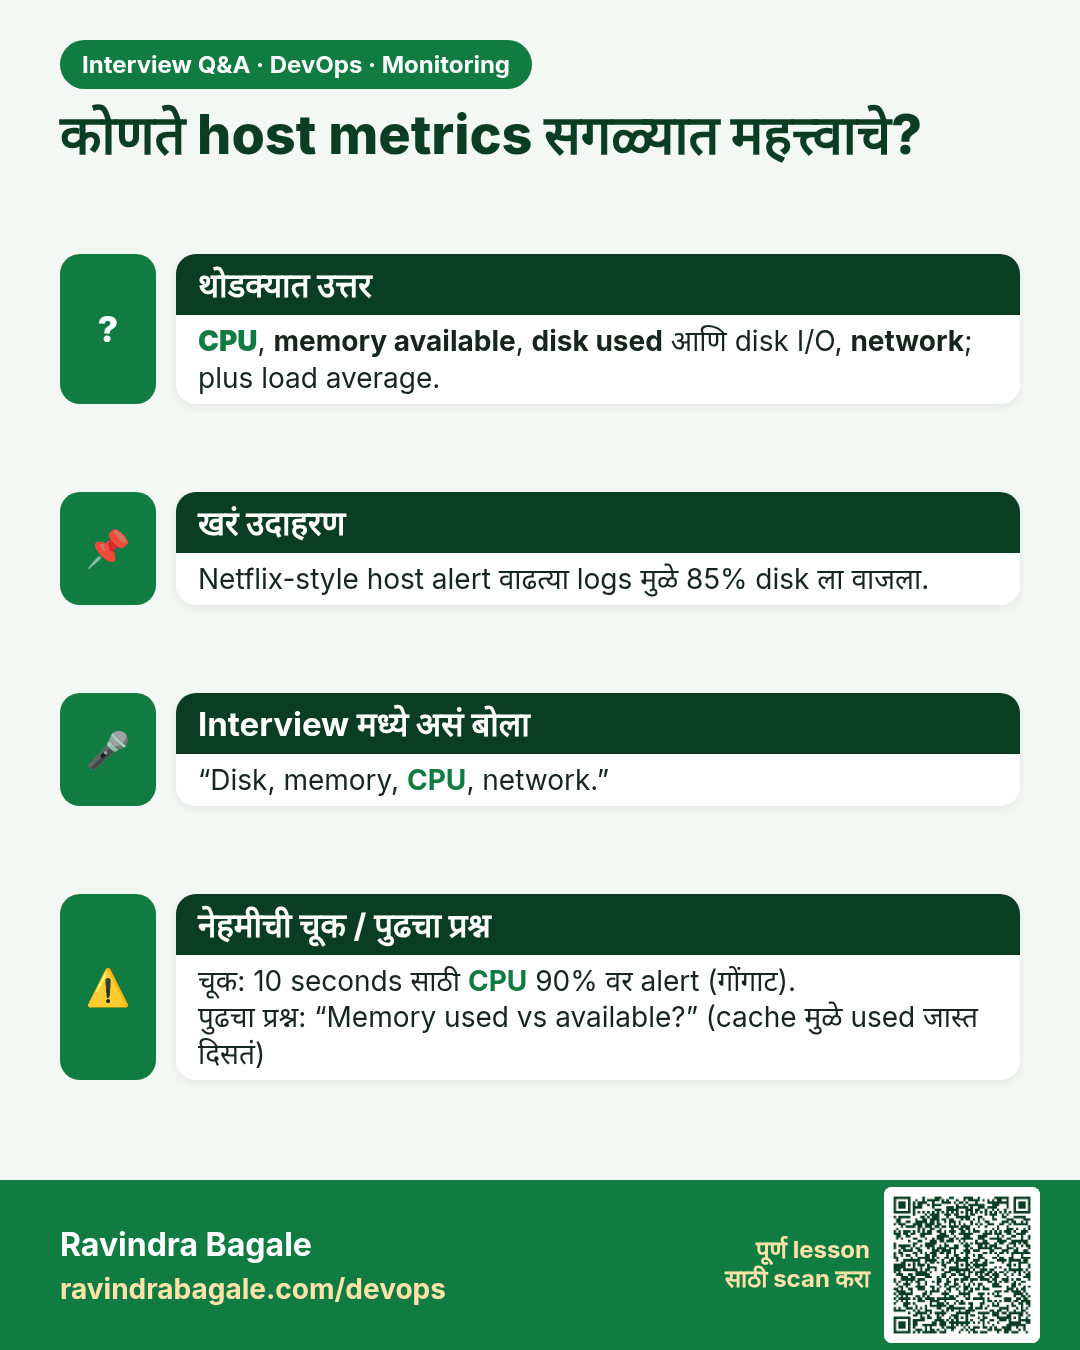
कोणते host metrics सगळ्यात महत्त्वाचे? CPU, memory available, disk used आणि disk I/O, network; plus load average.
मुलाखत (Interview) card 3 of 13: कोणते host metrics सगळ्यात महत्त्वाचे? · PNG download करा · Card page उघडा

Lesson: 13.3 Host metrics — CPU, RAM, disk
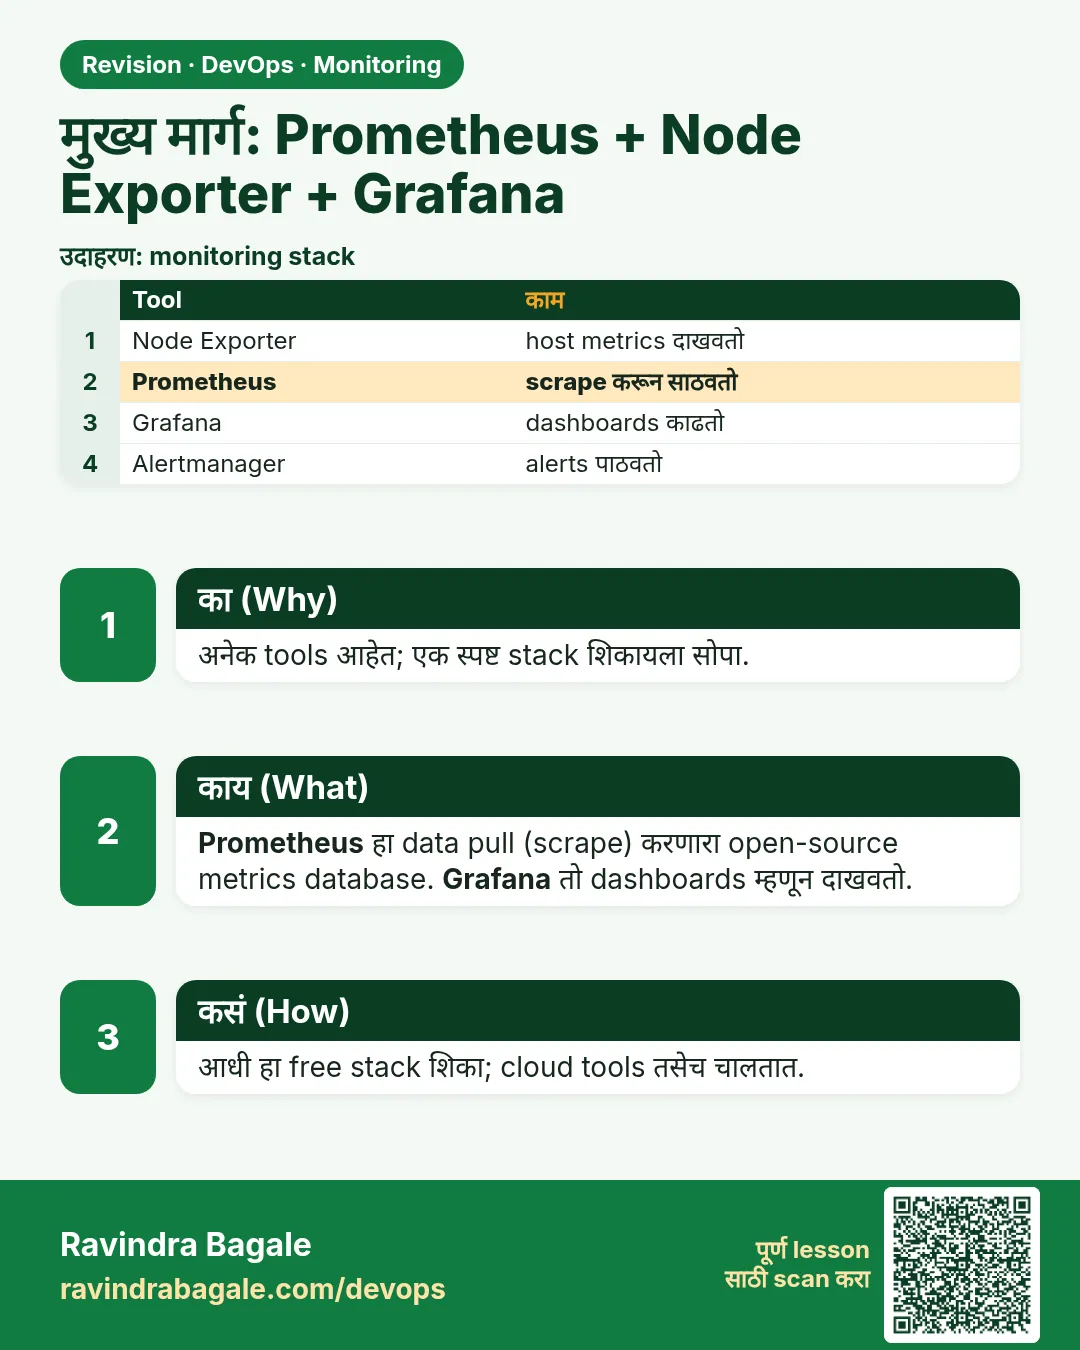
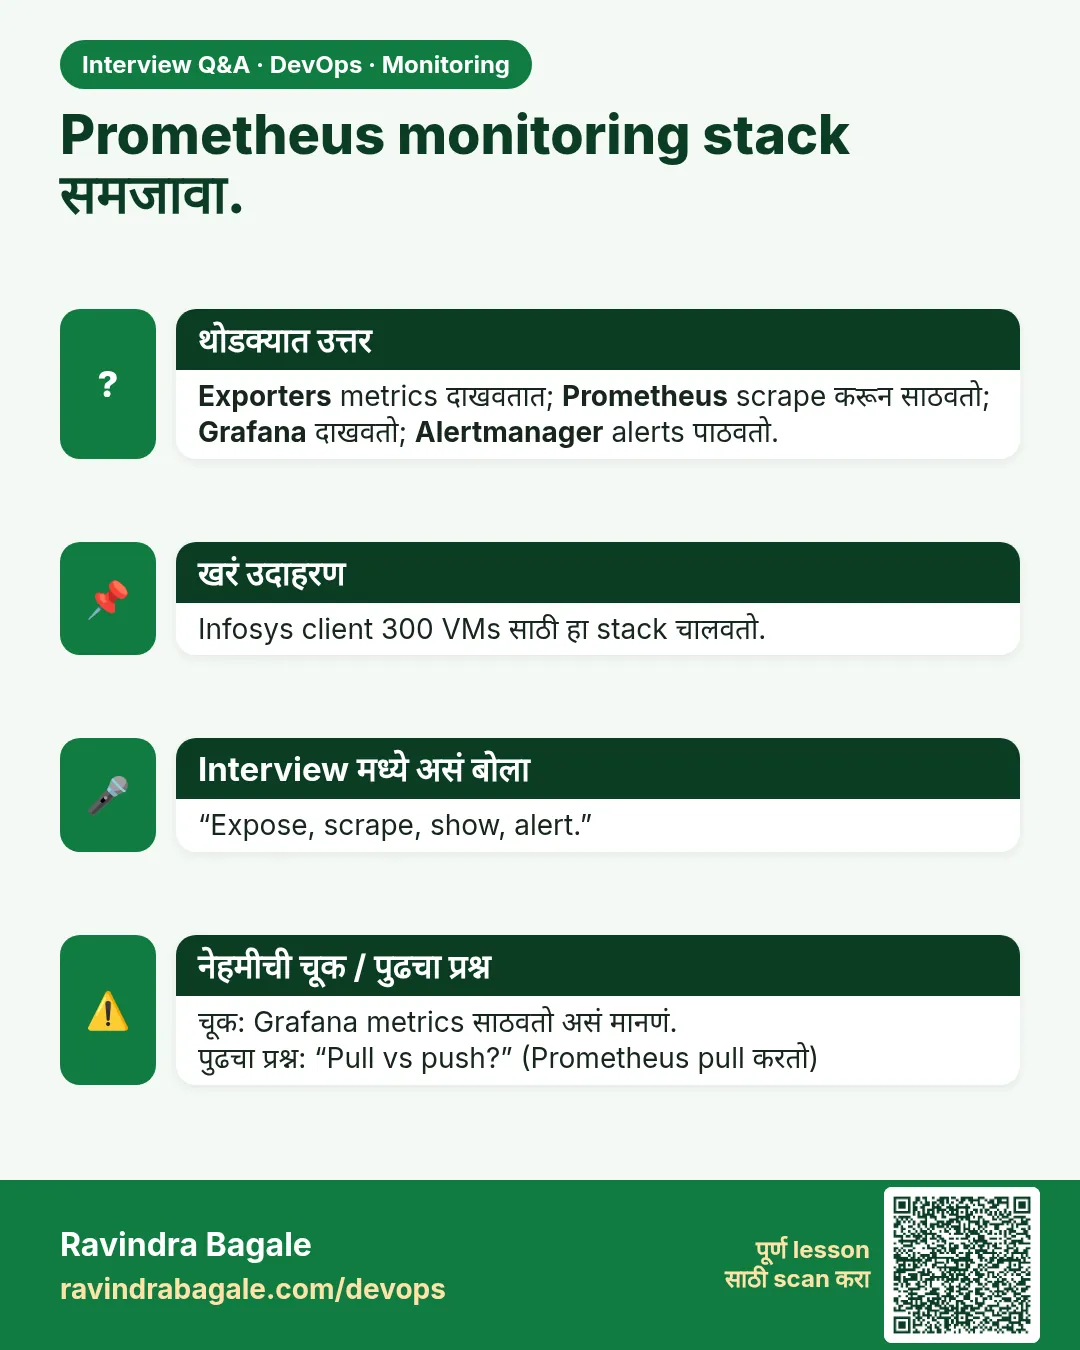
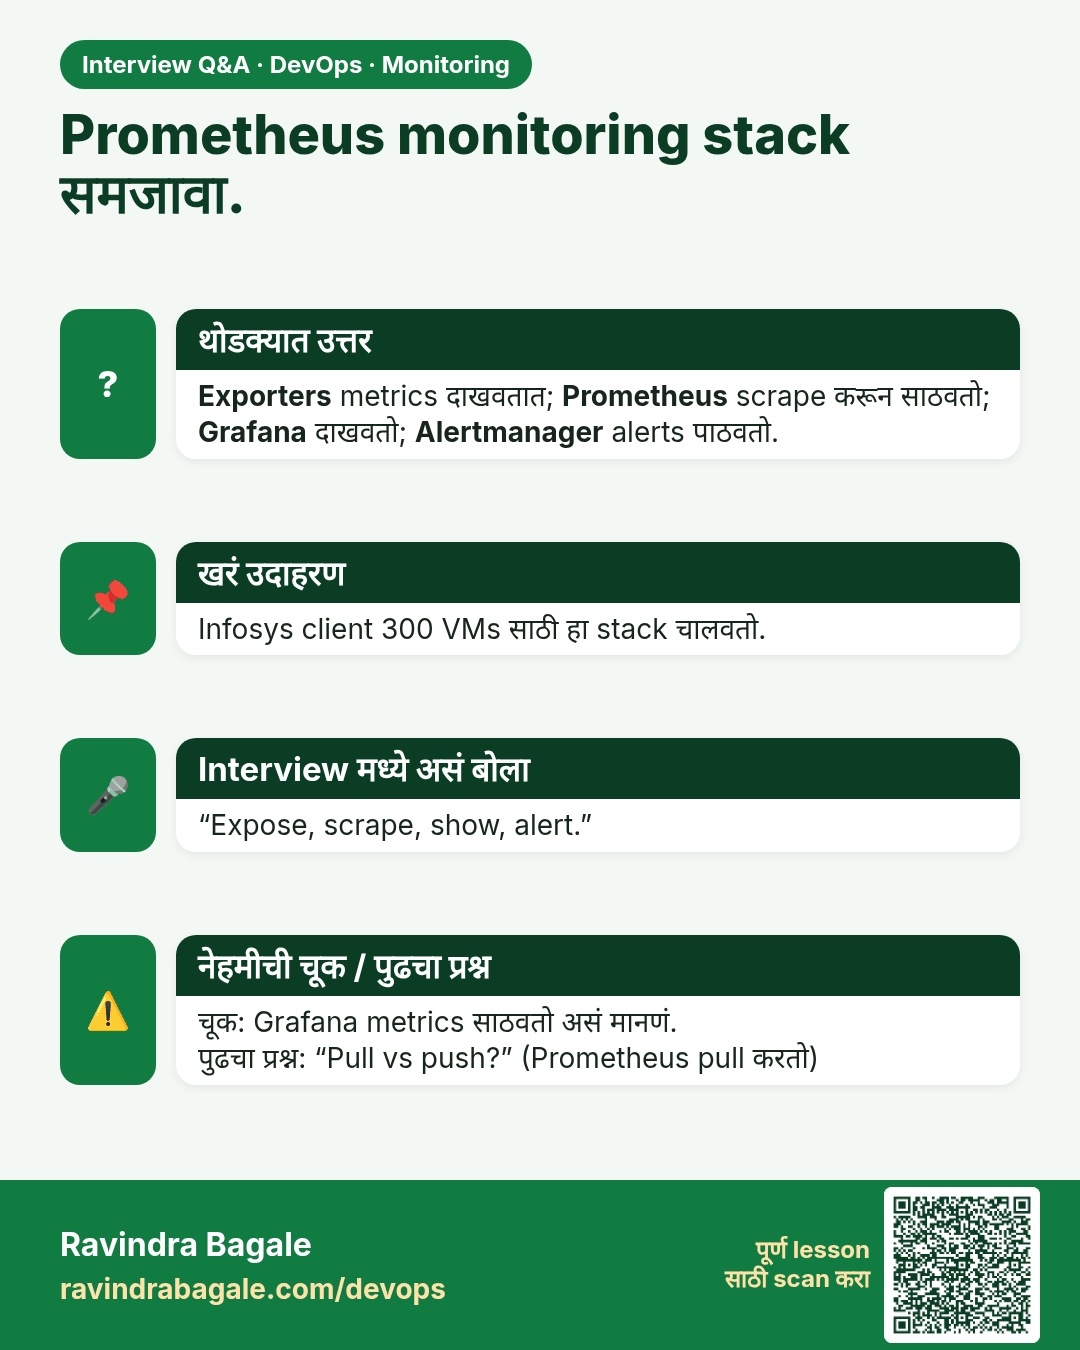
Prometheus monitoring stack समजावा. Exporters metrics दाखवतात; Prometheus scrape करून साठवतो; Grafana दाखवतो; Alertmanager alerts पाठवतो.
मुलाखत (Interview) card 4 of 13: Prometheus monitoring stack समजावा. · PNG download करा · Card page उघडा

Lesson: 13.4 Primary path — Prometheus + Node Exporter + Grafana
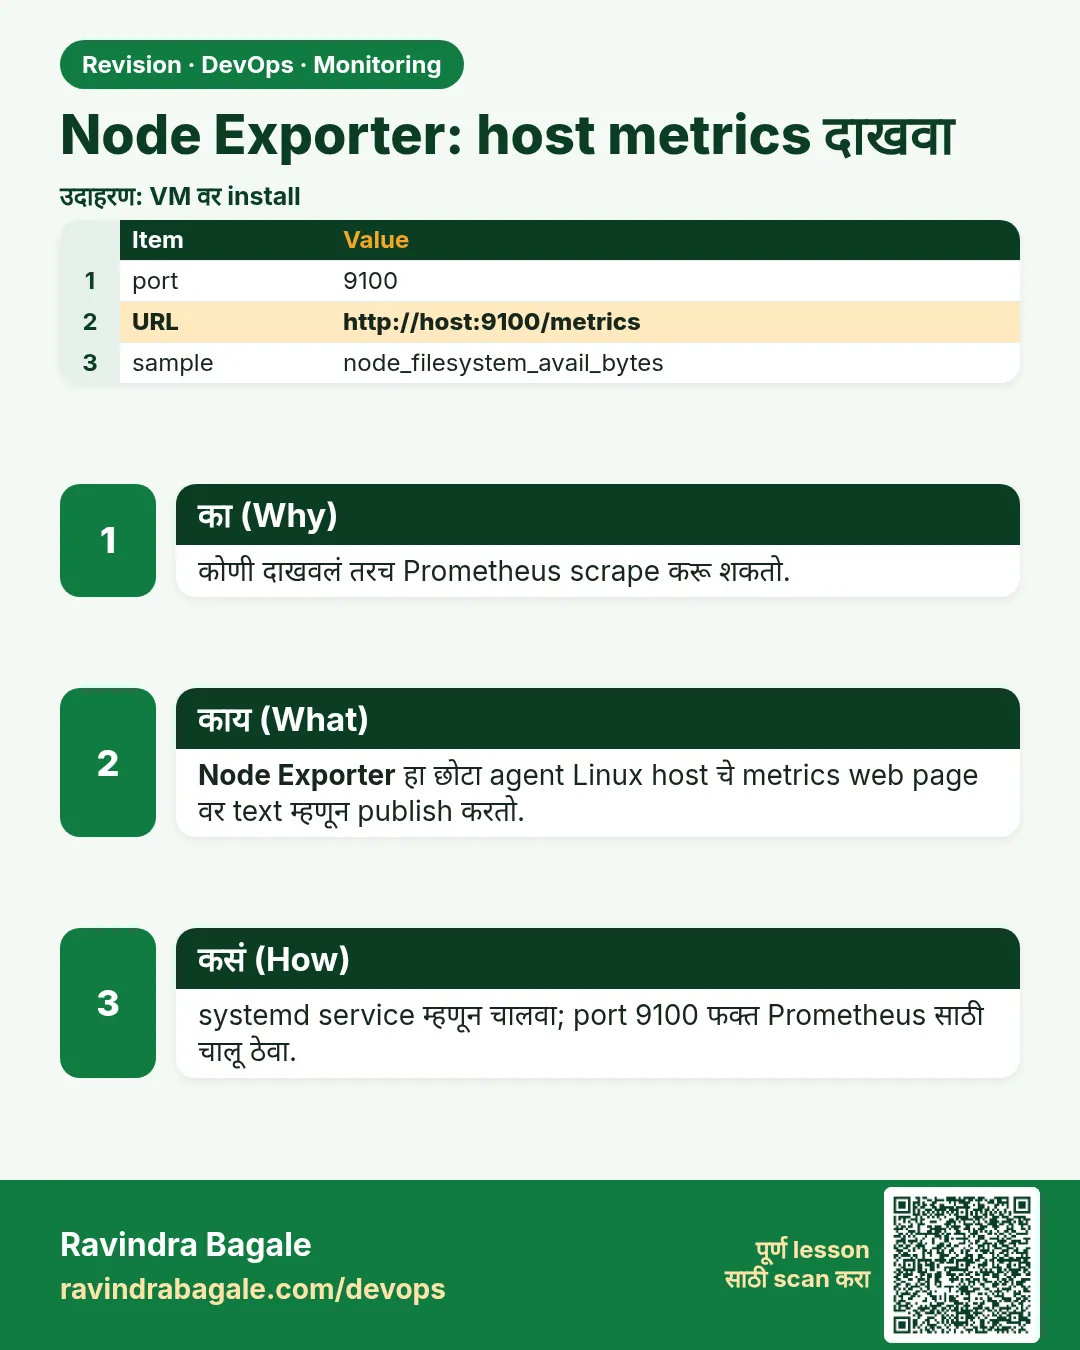
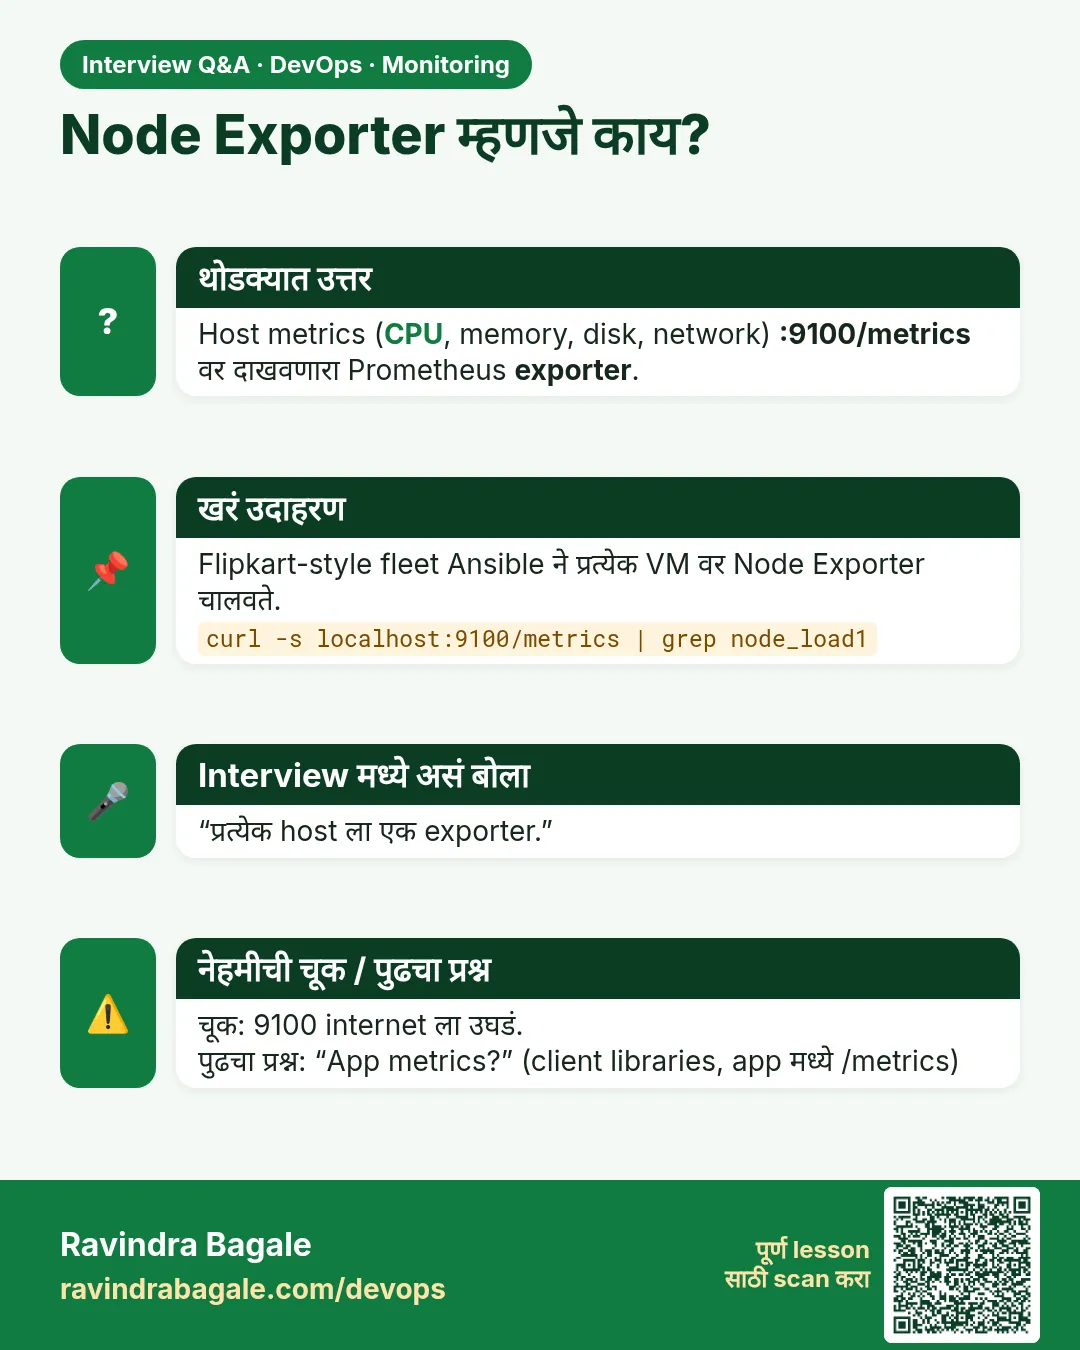
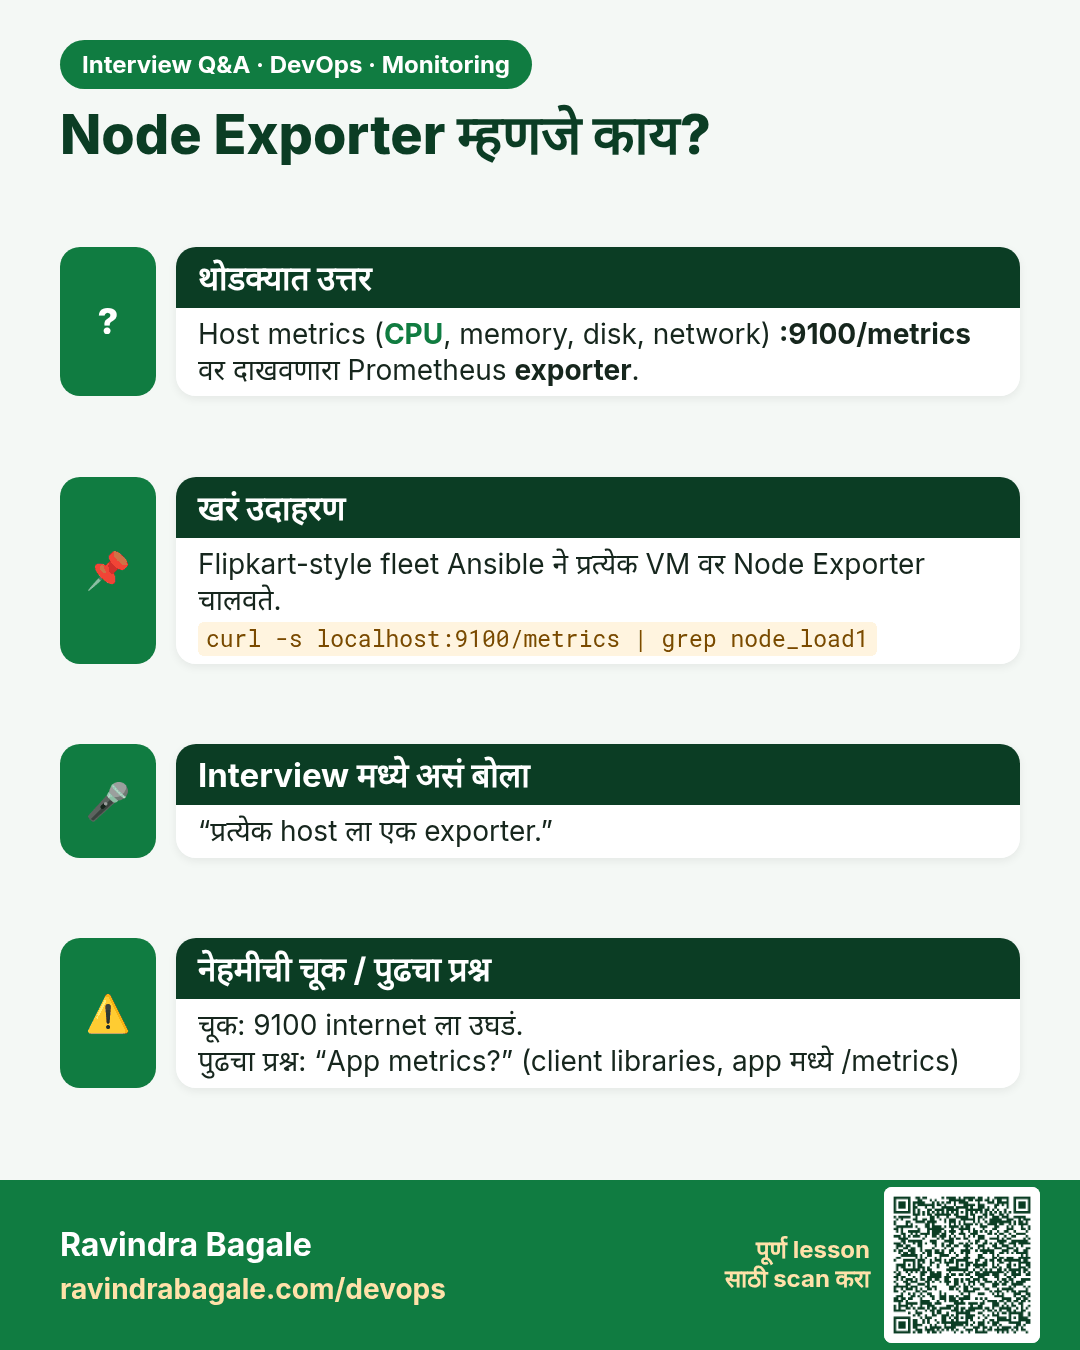
Node Exporter म्हणजे काय? Host metrics (CPU, memory, disk, network) :9100/metrics वर दाखवणारा Prometheus exporter.
मुलाखत (Interview) card 5 of 13: Node Exporter म्हणजे काय? · PNG download करा · Card page उघडा

Lesson: 13.5 Node Exporter — expose host metrics
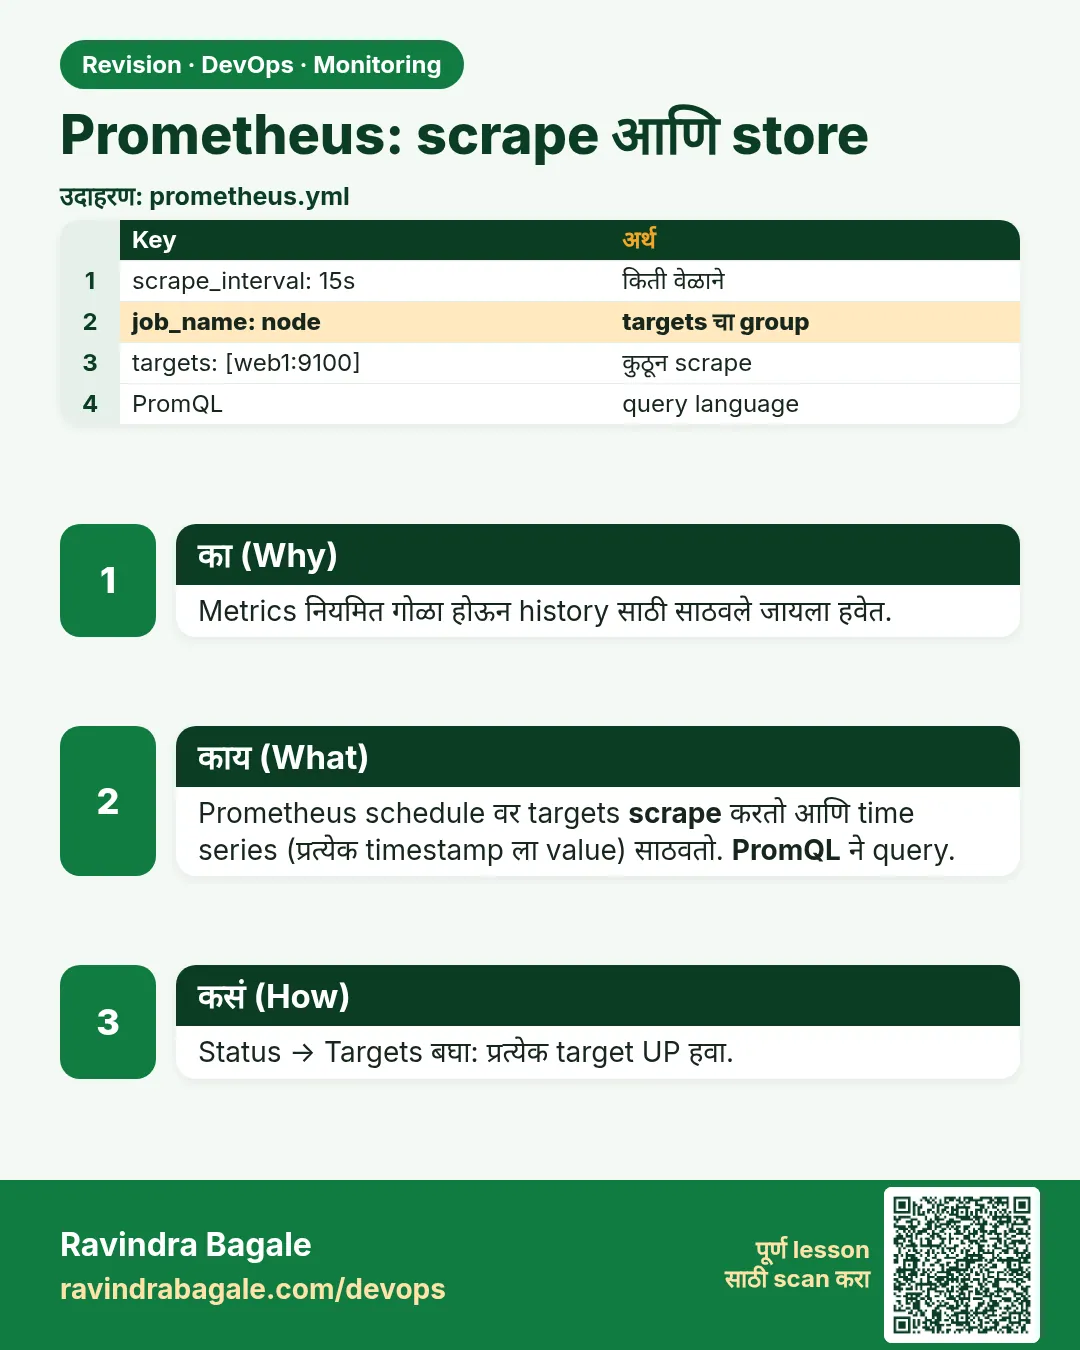
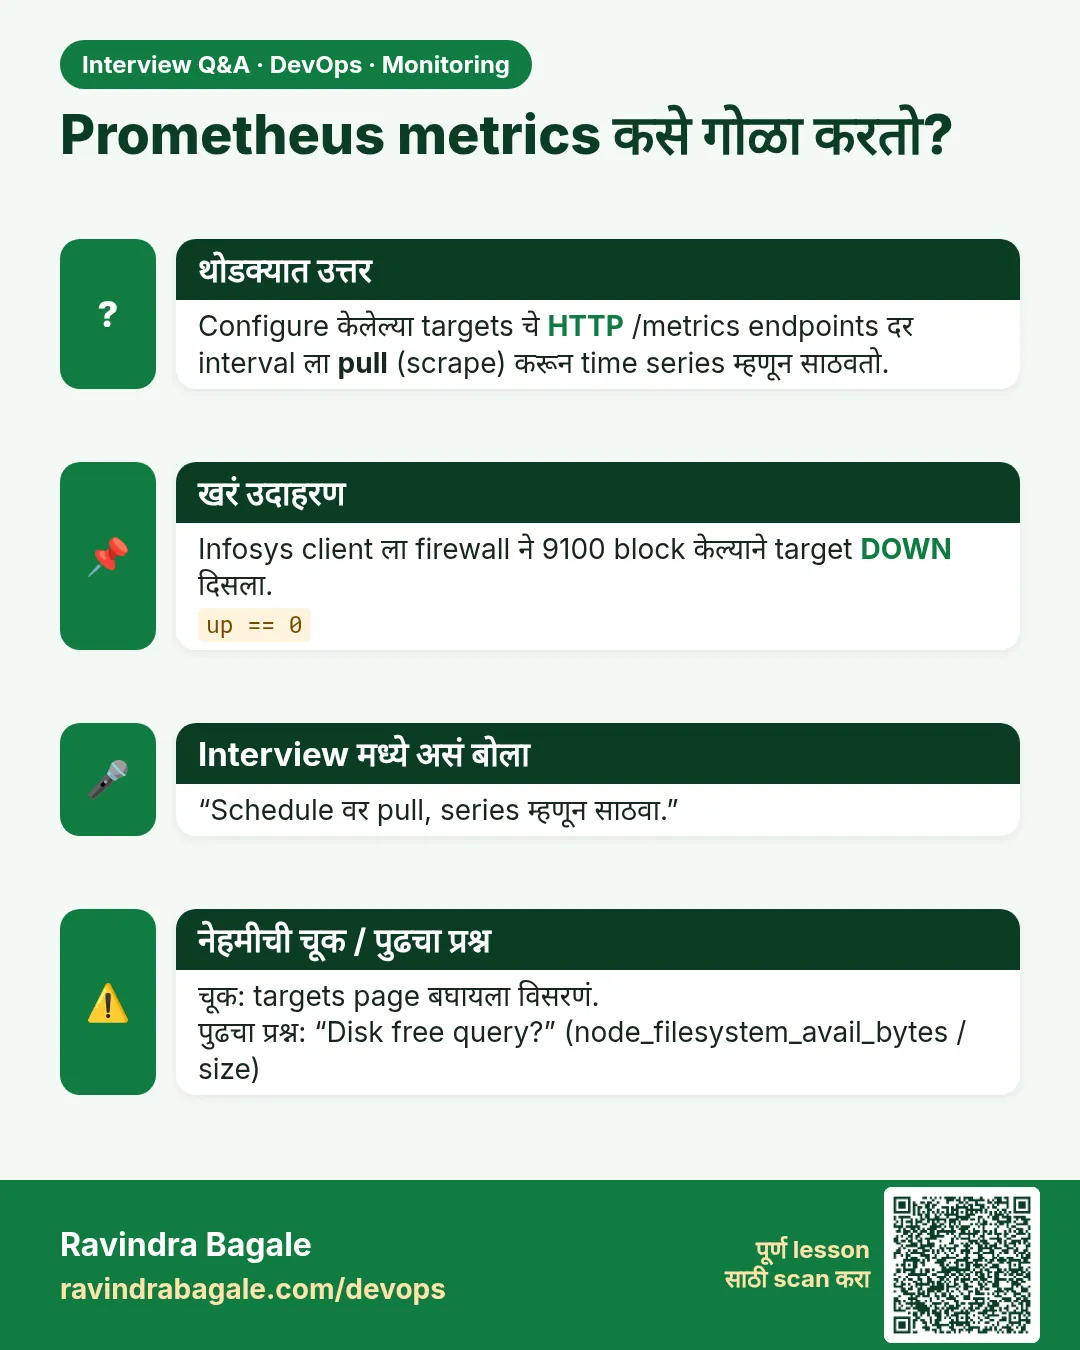
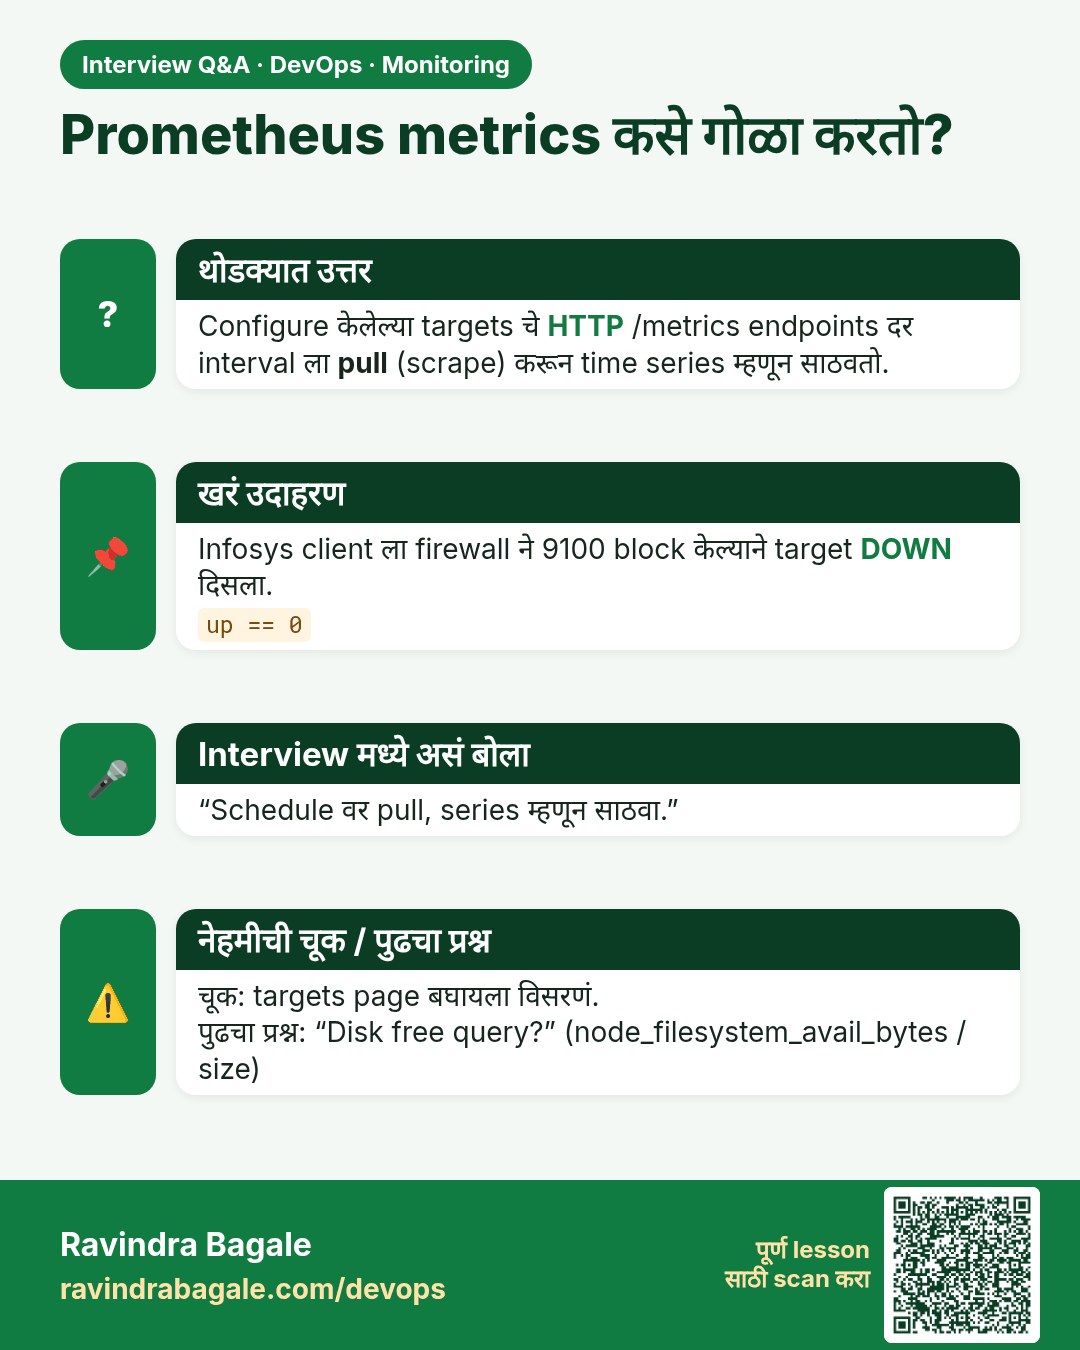
Prometheus metrics कसे गोळा करतो? Configure केलेल्या targets चे HTTP /metrics endpoints दर interval ला pull (scrape) करून time series म्हणून साठवतो.
मुलाखत (Interview) card 6 of 13: Prometheus metrics कसे गोळा करतो? · PNG download करा · Card page उघडा

Lesson: 13.6 Prometheus — scrape and store
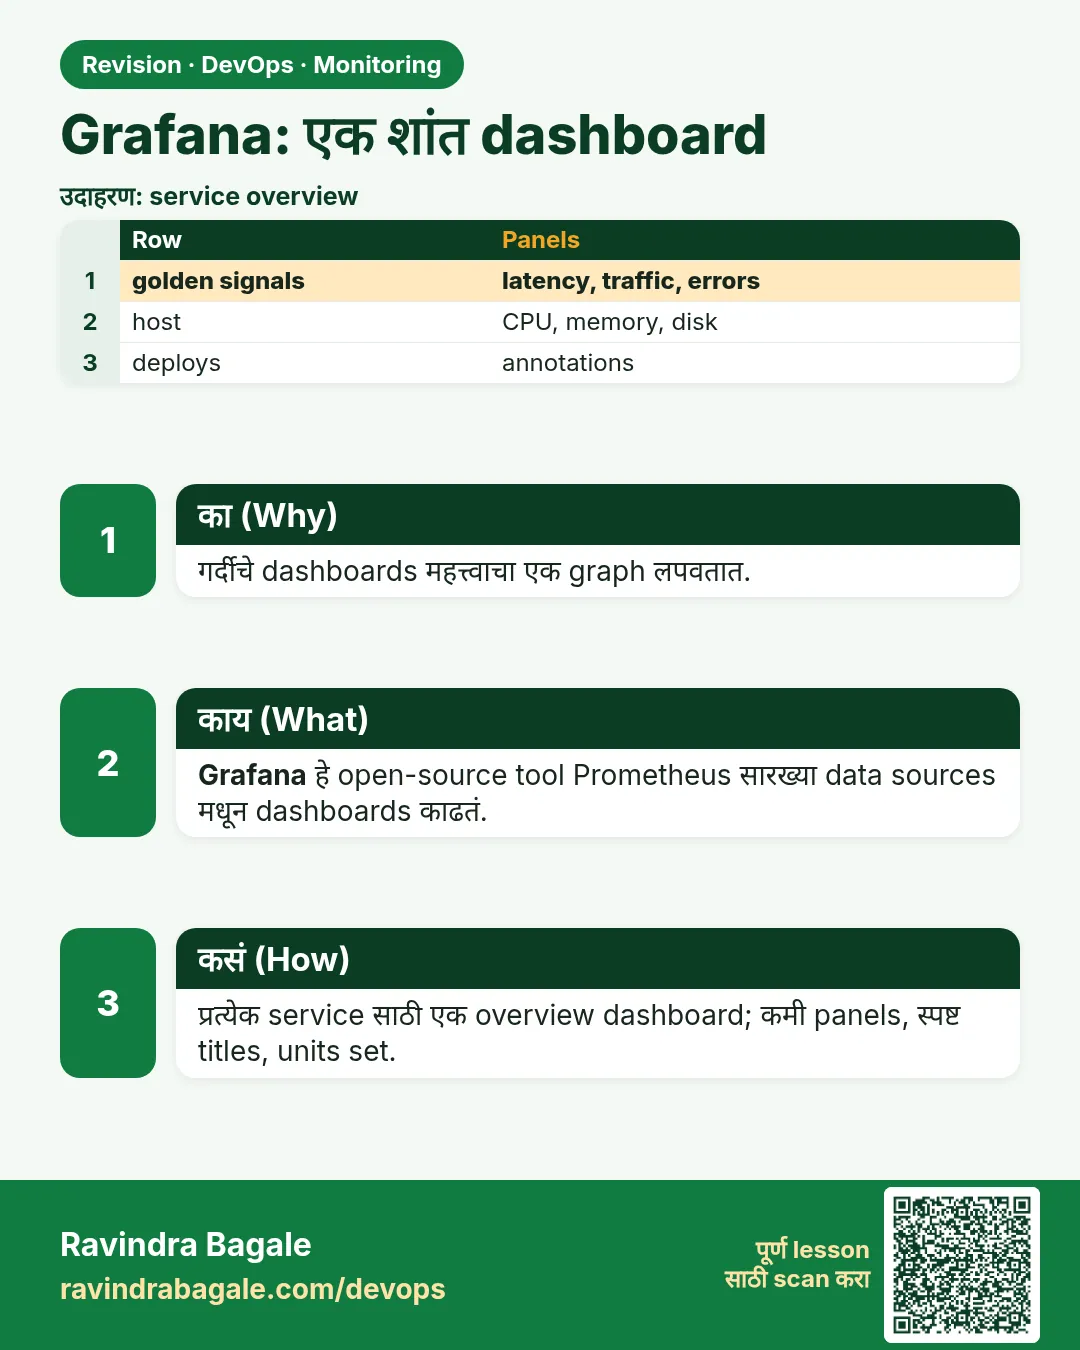
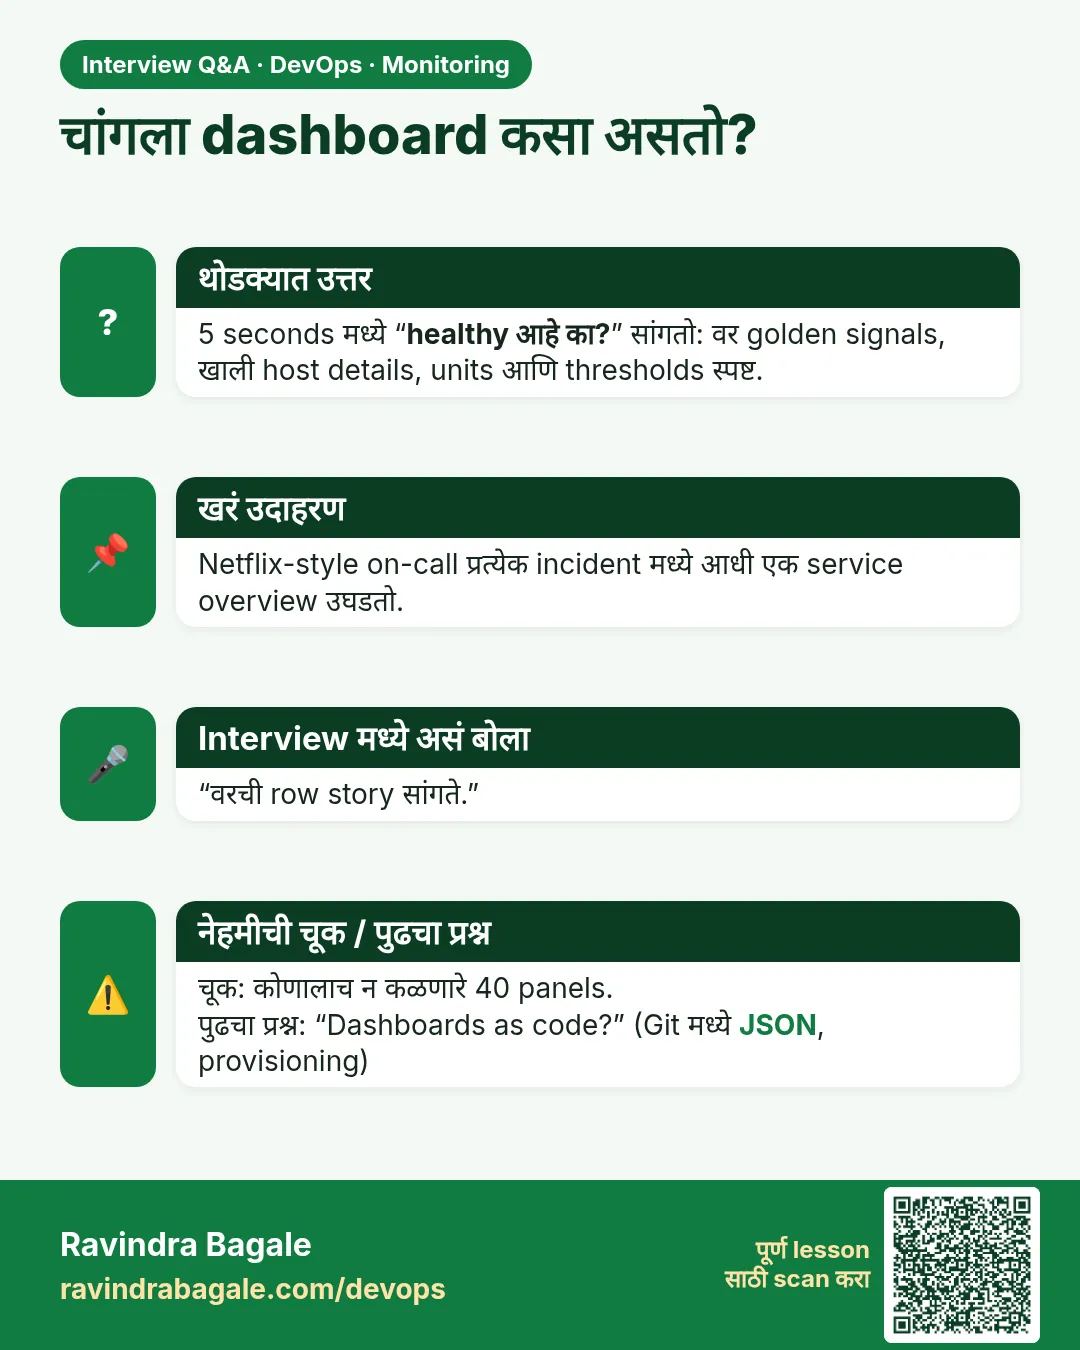
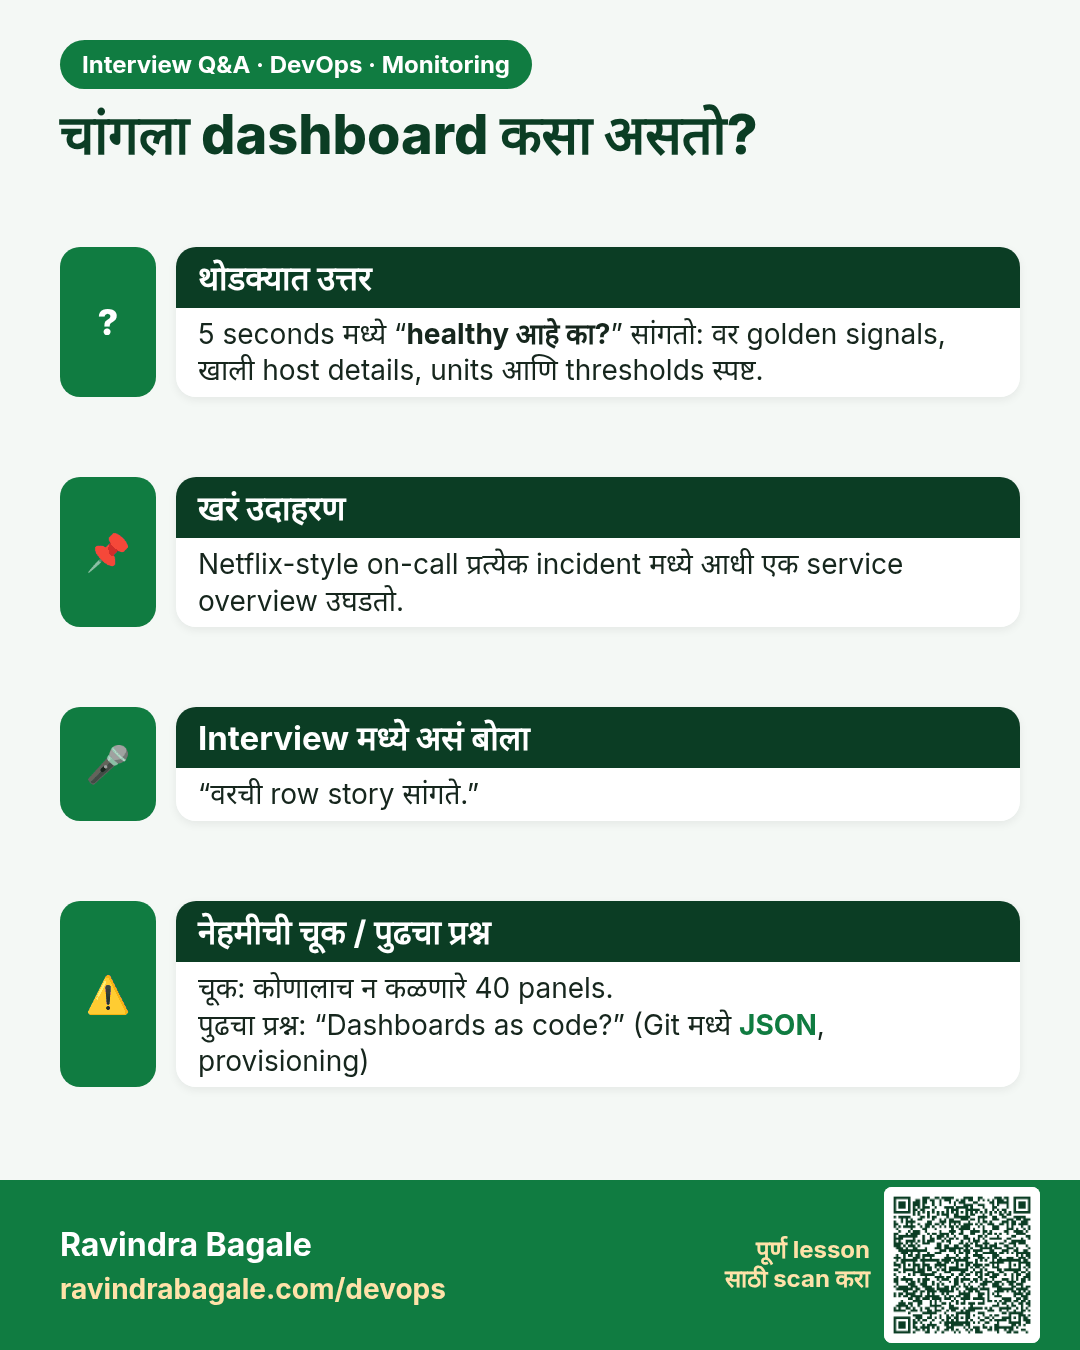
चांगला dashboard कसा असतो? 5 seconds मध्ये “healthy आहे का?” सांगतो: वर golden signals, खाली host details, units आणि thresholds स्पष्ट.
मुलाखत (Interview) card 7 of 13: चांगला dashboard कसा असतो? · PNG download करा · Card page उघडा

Lesson: 13.7 Grafana — one calm dashboard

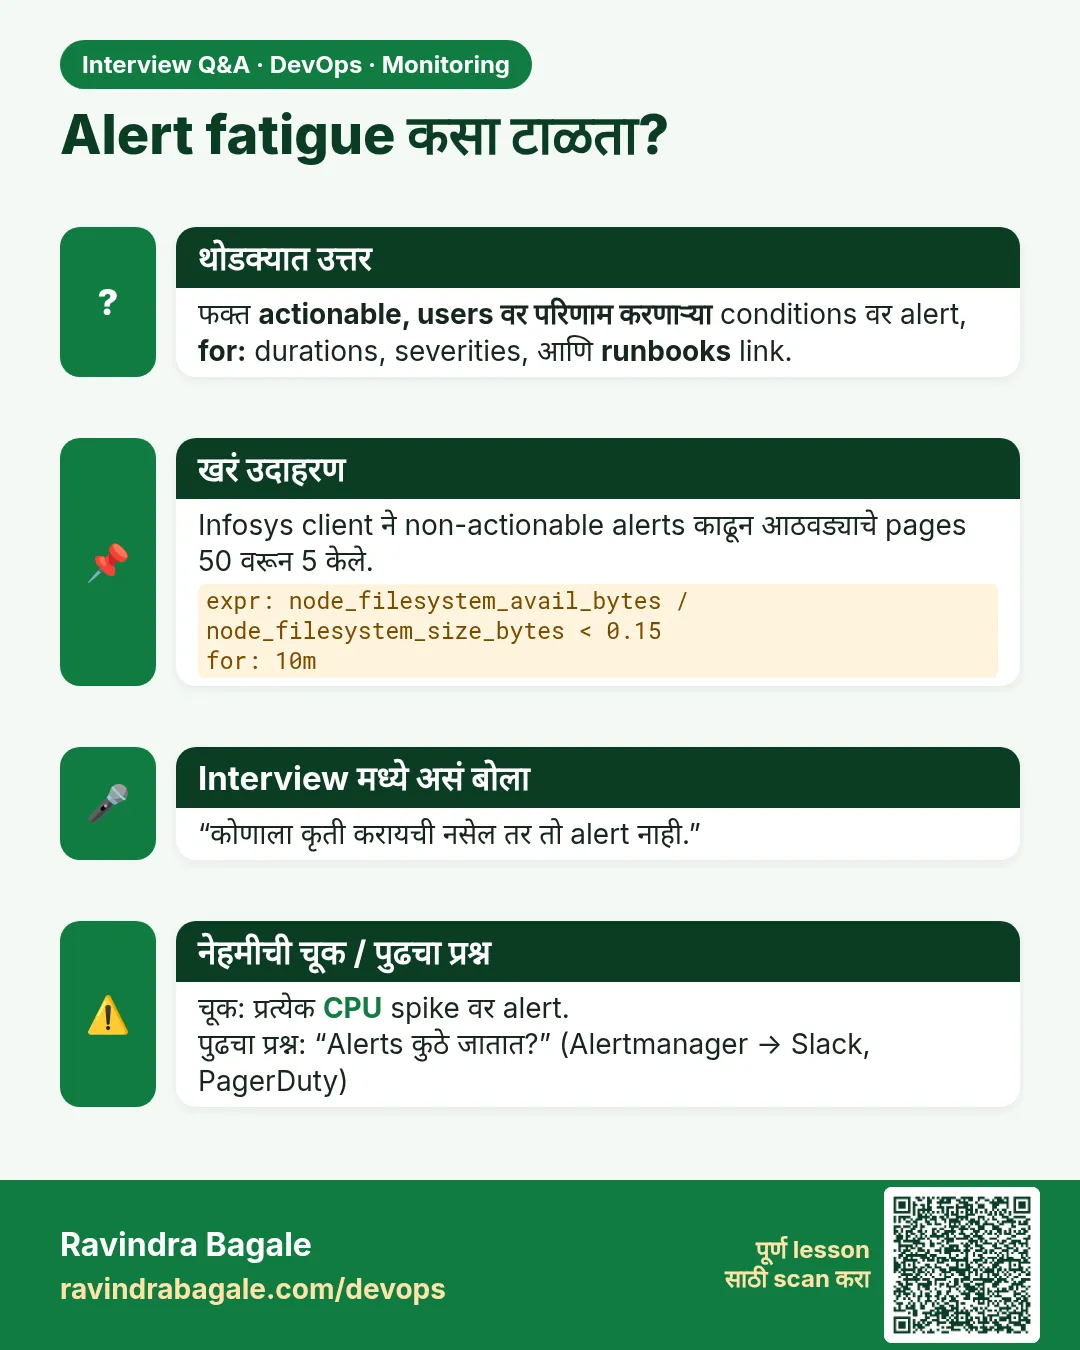
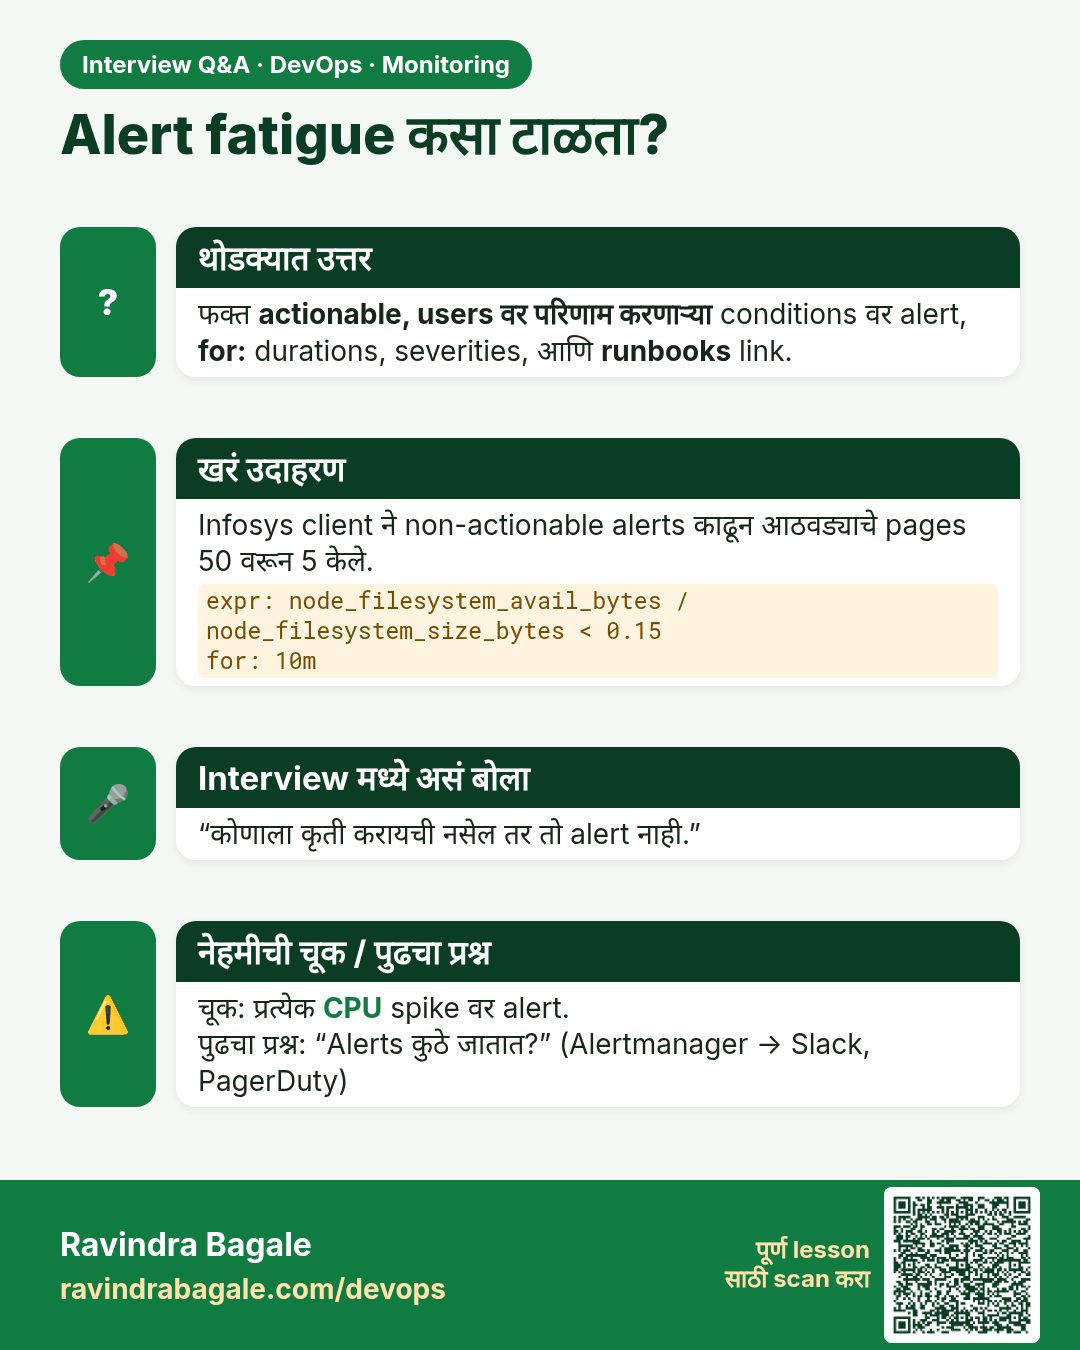
Alert fatigue कसा टाळता? फक्त actionable, users वर परिणाम करणाऱ्या conditions वर alert, for: durations, severities, आणि runbooks link.
मुलाखत (Interview) card 8 of 13: Alert fatigue कसा टाळता? · PNG download करा · Card page उघडा

Lesson: 13.8 Alerting — one disk threshold that matters

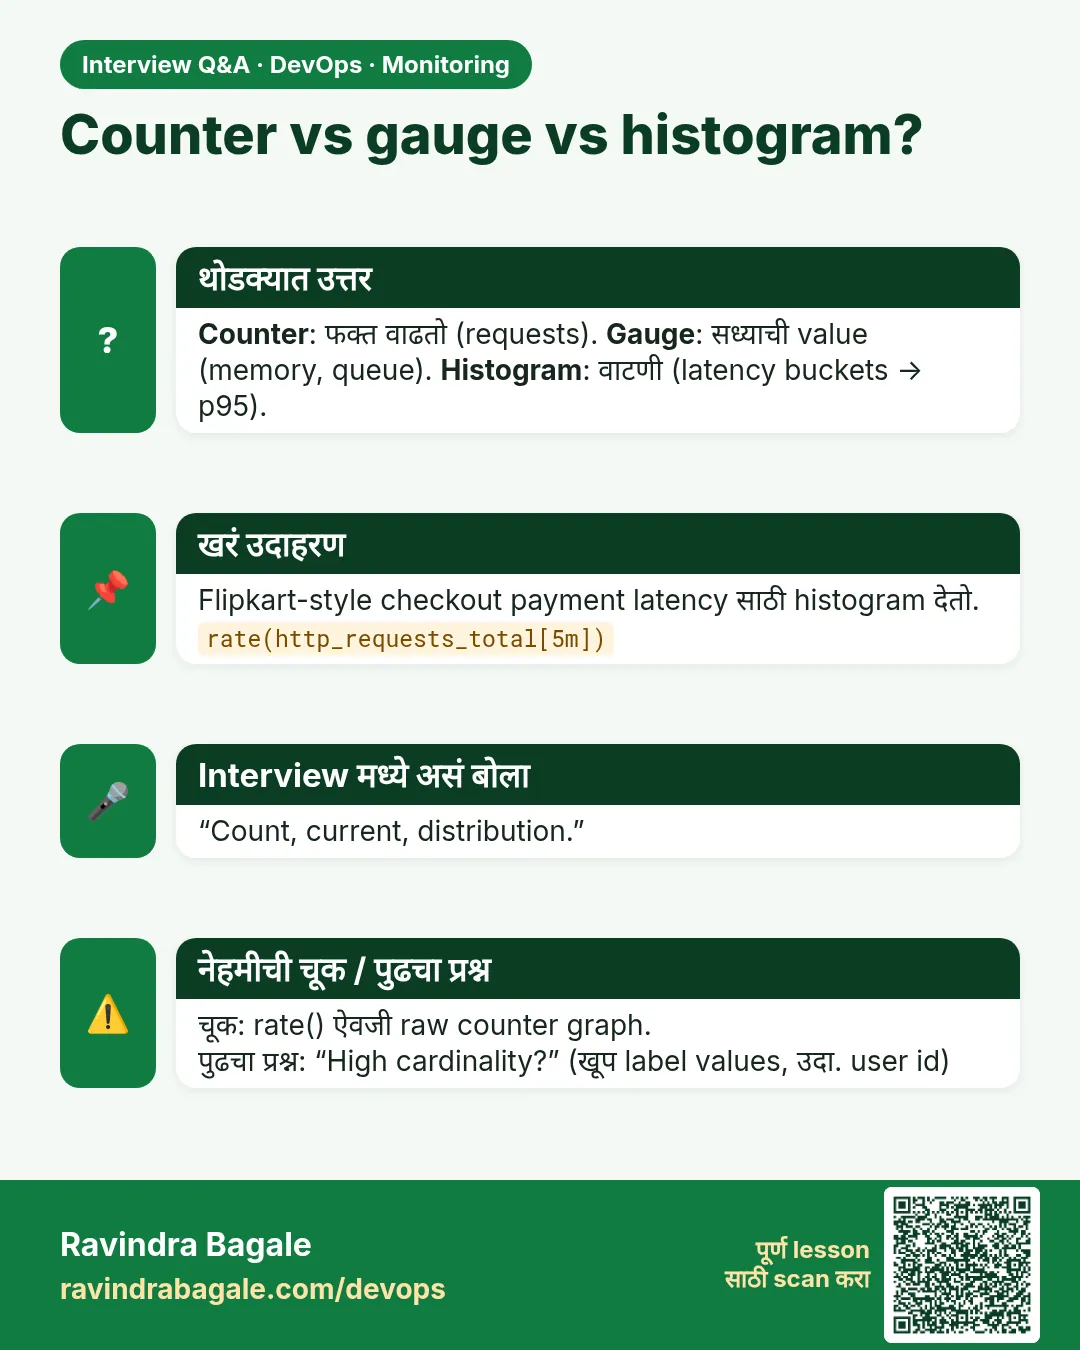
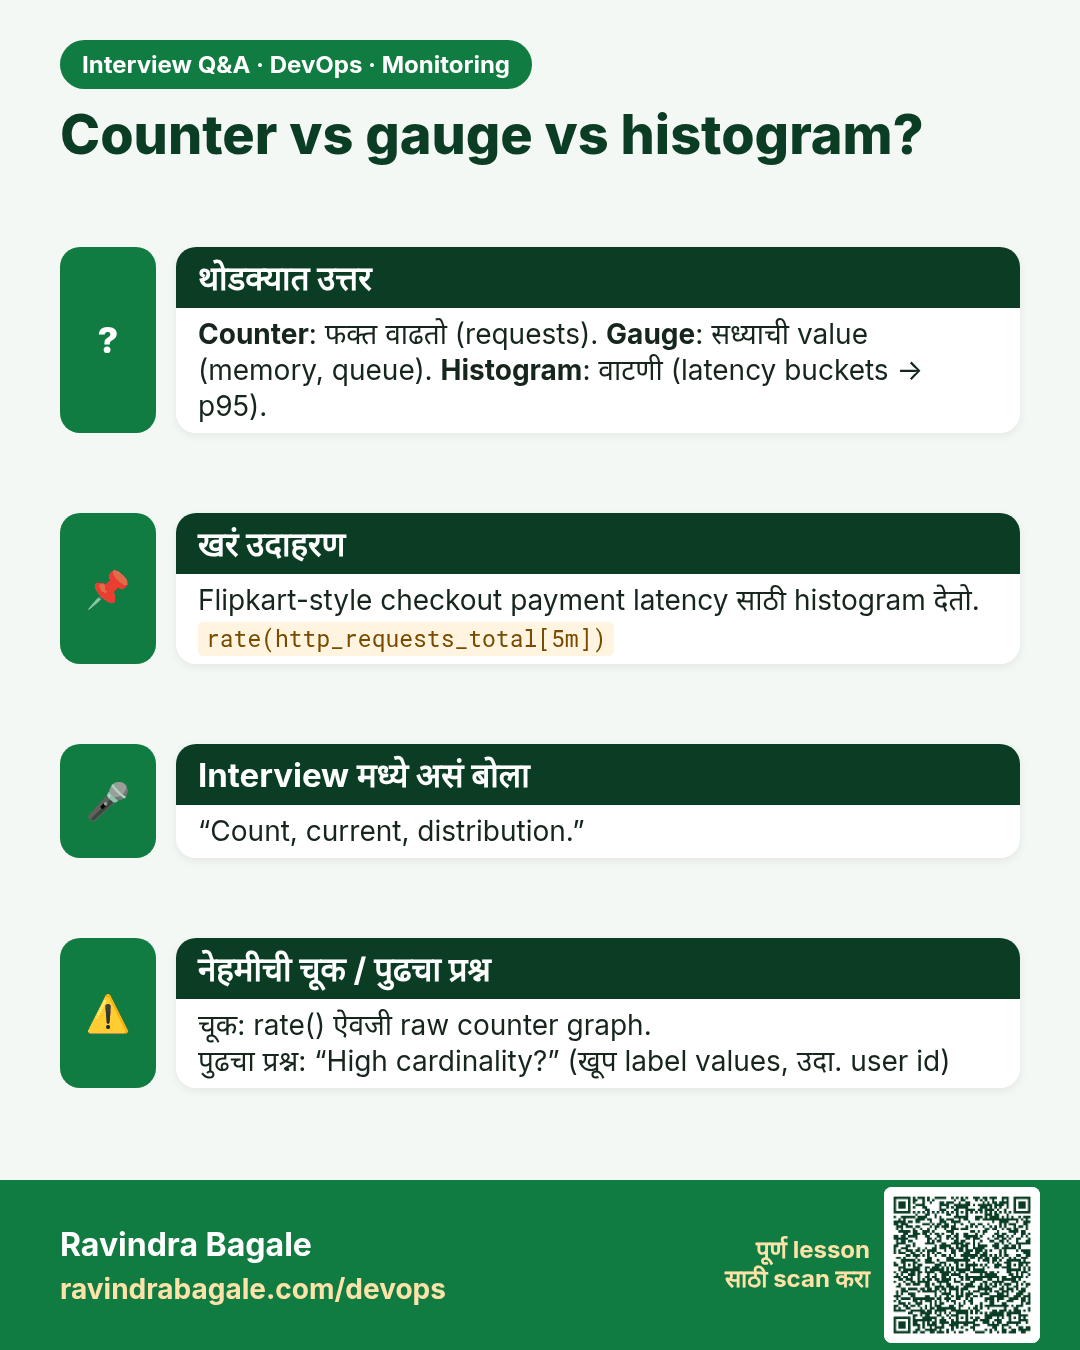
Counter vs gauge vs histogram? Counter: फक्त वाढतो (requests). Gauge: सध्याची value (memory, queue). Histogram: वाटणी (latency buckets → p95).
मुलाखत (Interview) card 9 of 13: Counter vs gauge vs histogram? · PNG download करा · Card page उघडा

Lesson: 13.9 What about application metrics?

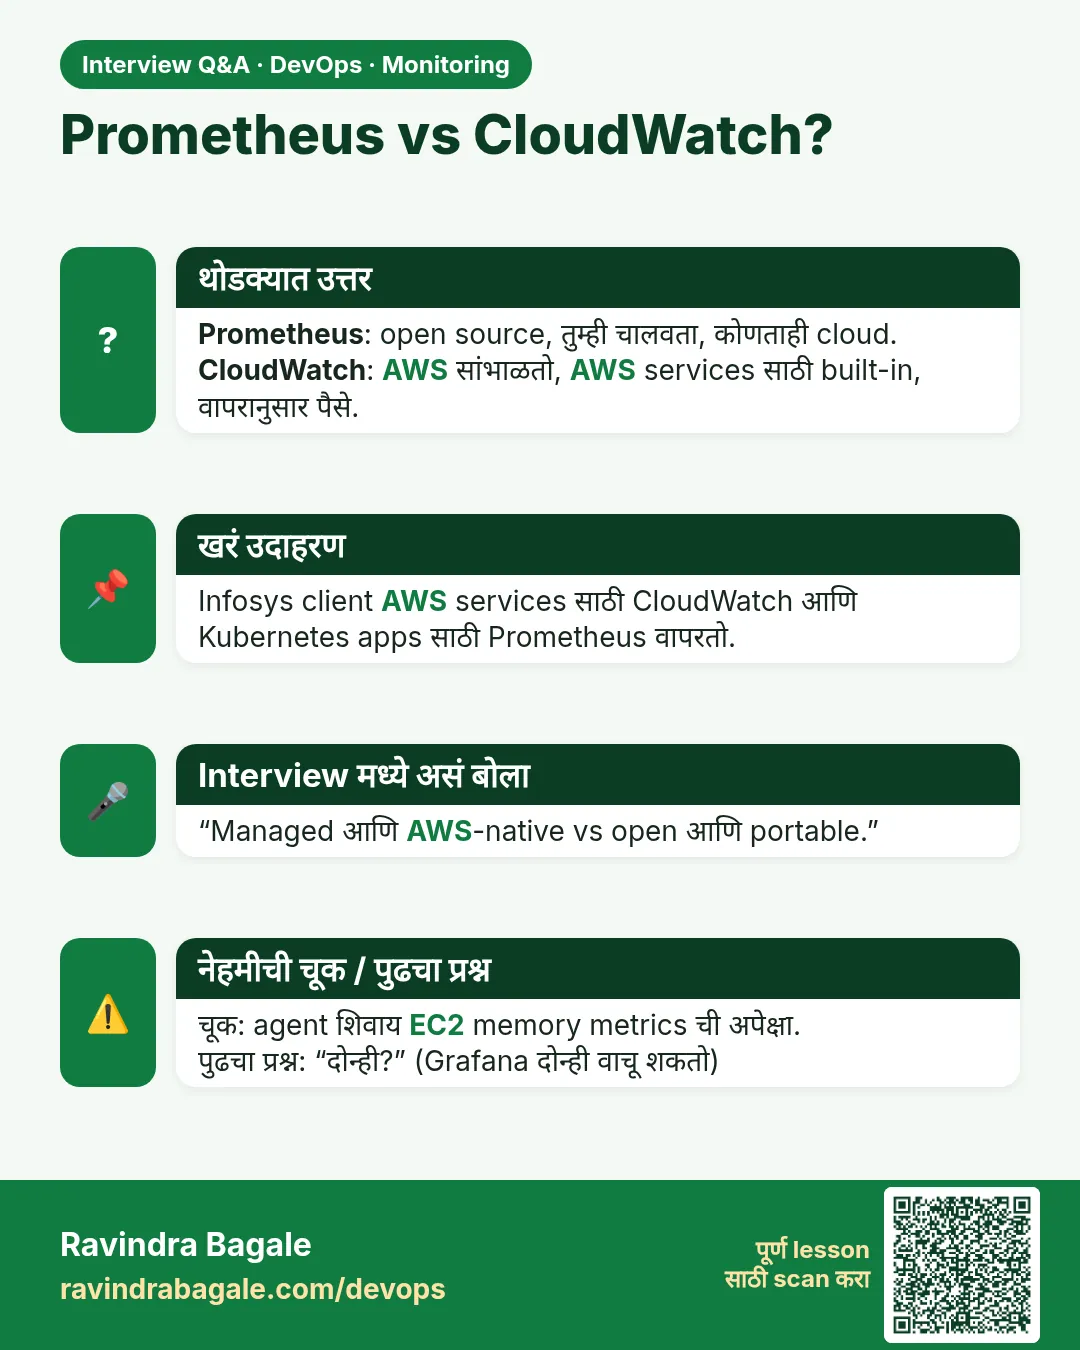
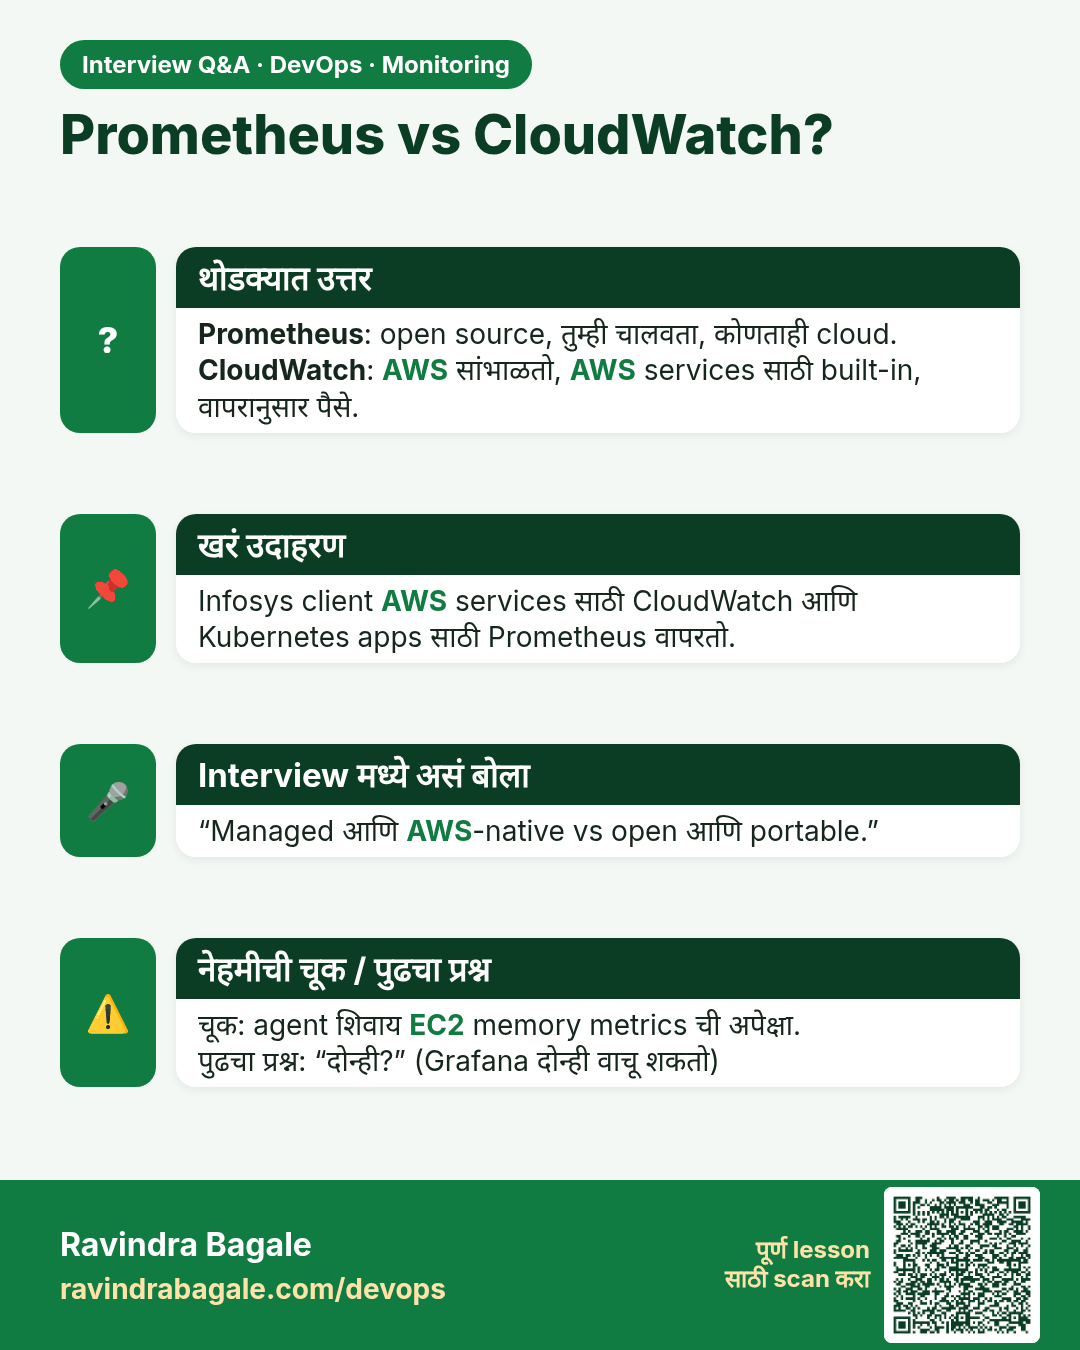
Prometheus vs CloudWatch? Prometheus: open source, तुम्ही चालवता, कोणताही cloud. CloudWatch: AWS सांभाळतो, AWS services साठी built-in, वापरानुसार पैसे.
मुलाखत (Interview) card 10 of 13: Prometheus vs CloudWatch? · PNG download करा · Card page उघडा

Lesson: 13.10 CloudWatch in one paragraph (secondary path)

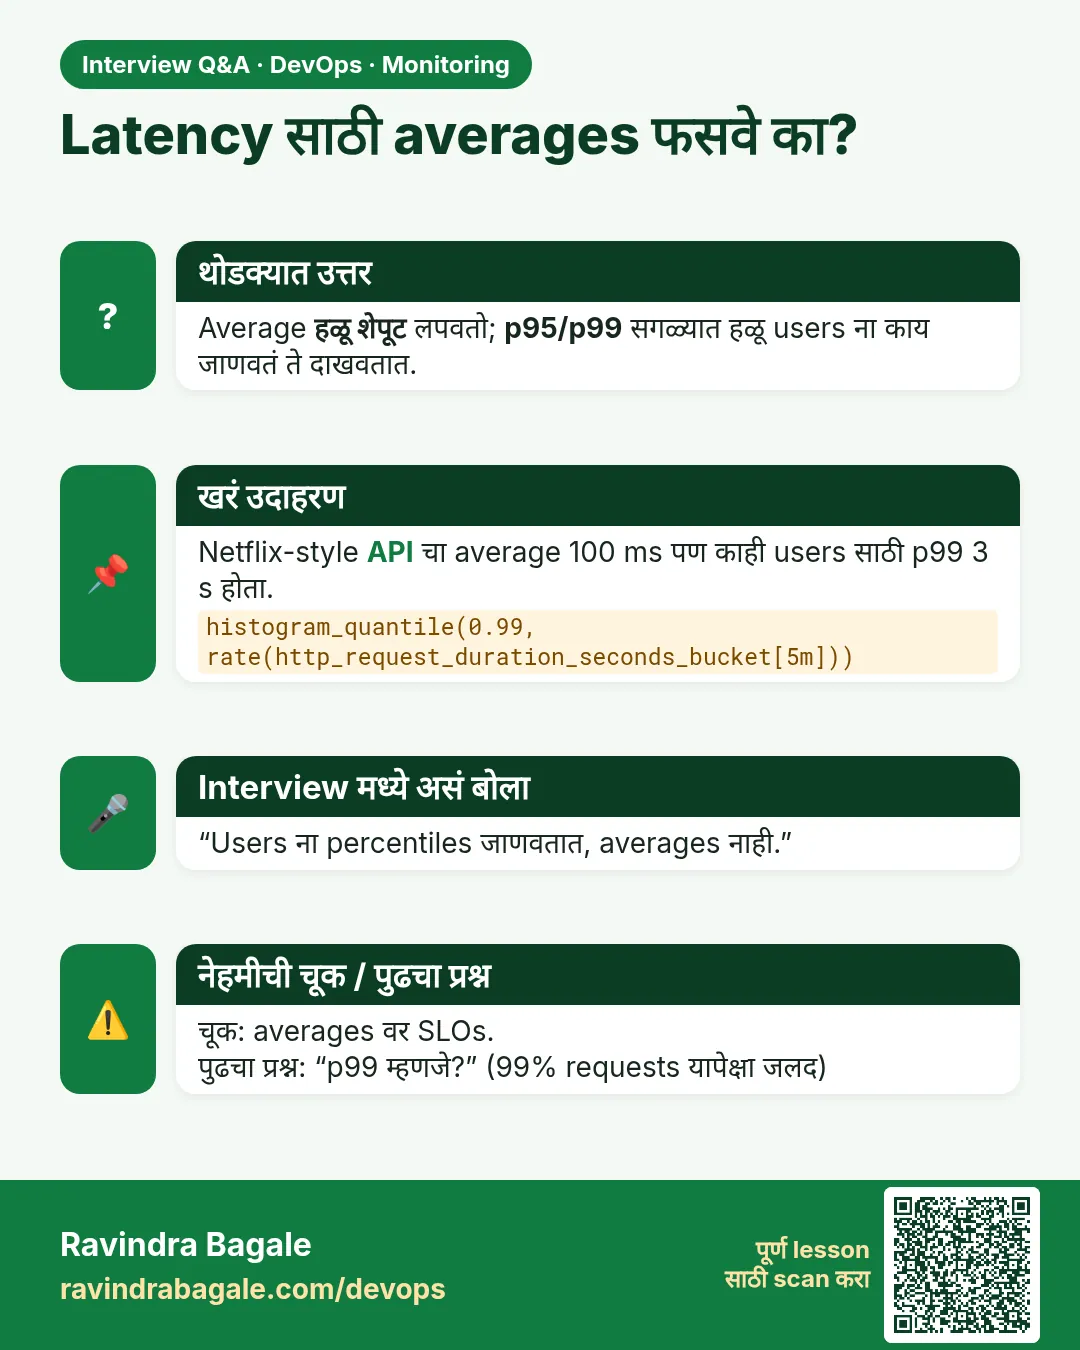
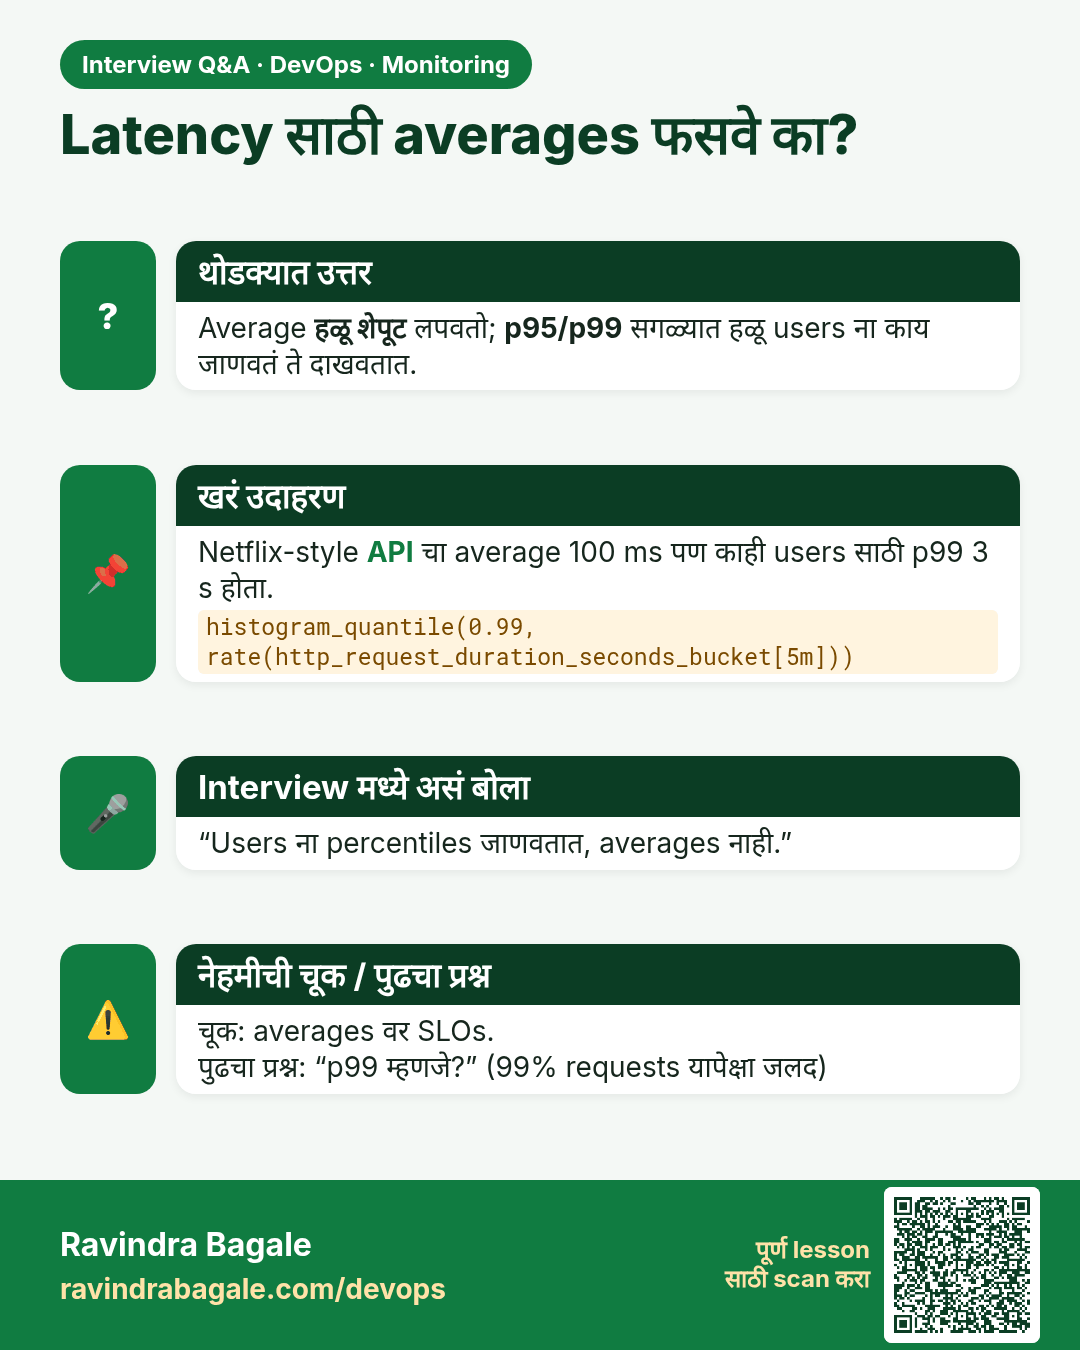
Latency साठी averages फसवे का? Average हळू शेपूट लपवतो; p95/p99 सगळ्यात हळू users ना काय जाणवतं ते दाखवतात.
मुलाखत (Interview) card 11 of 13: Latency साठी averages फसवे का? · PNG download करा · Card page उघडा

Lesson: 13.11 Anti-patterns

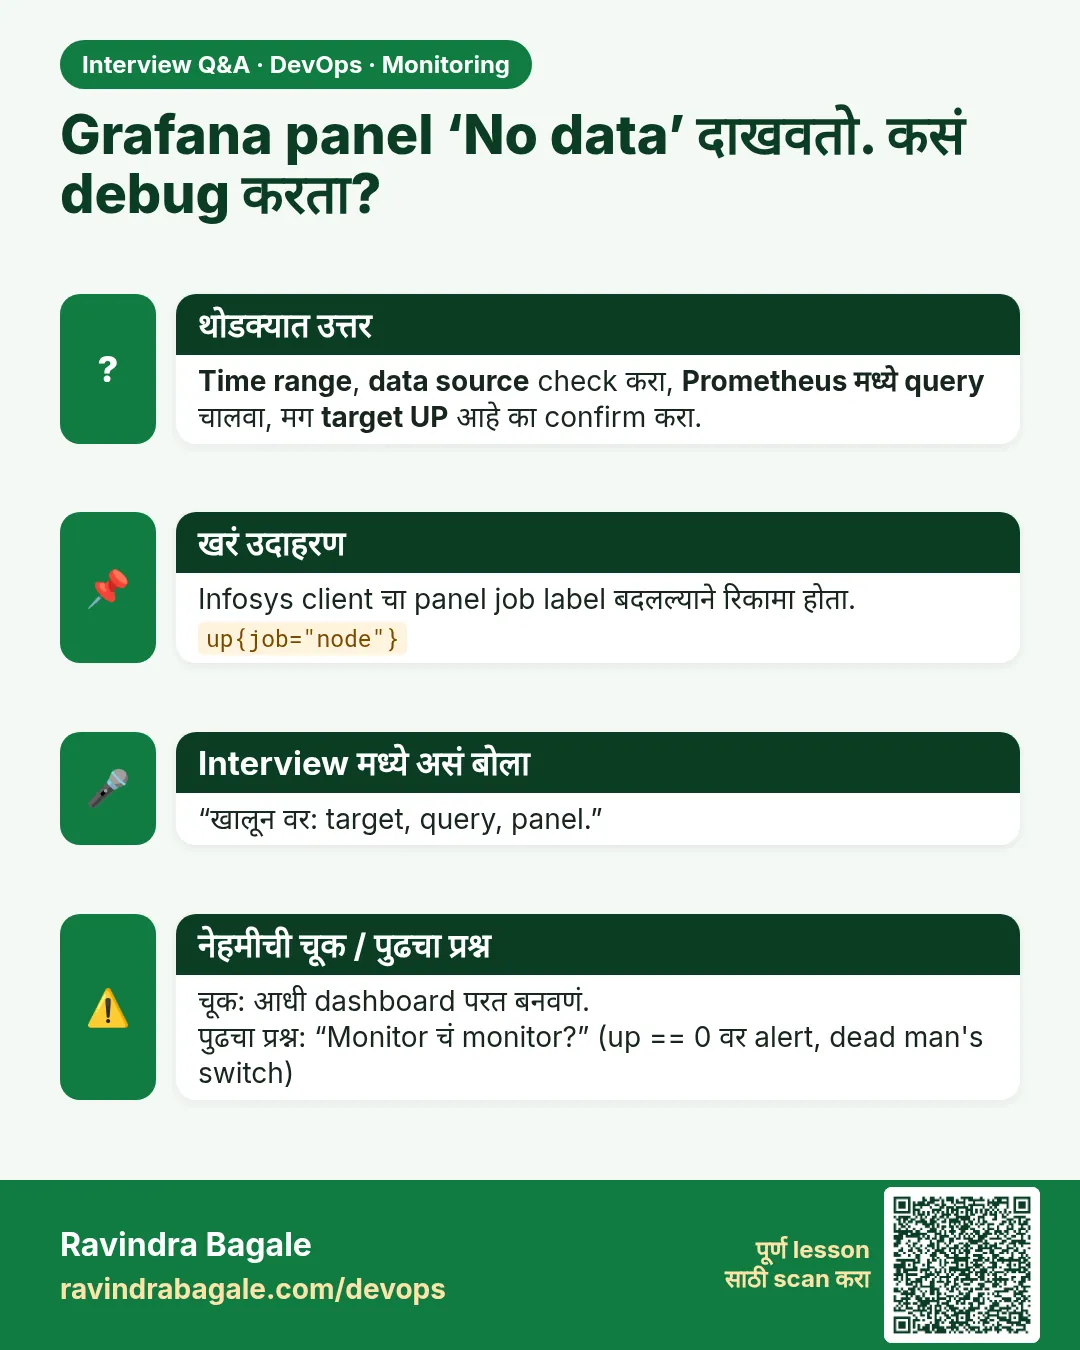
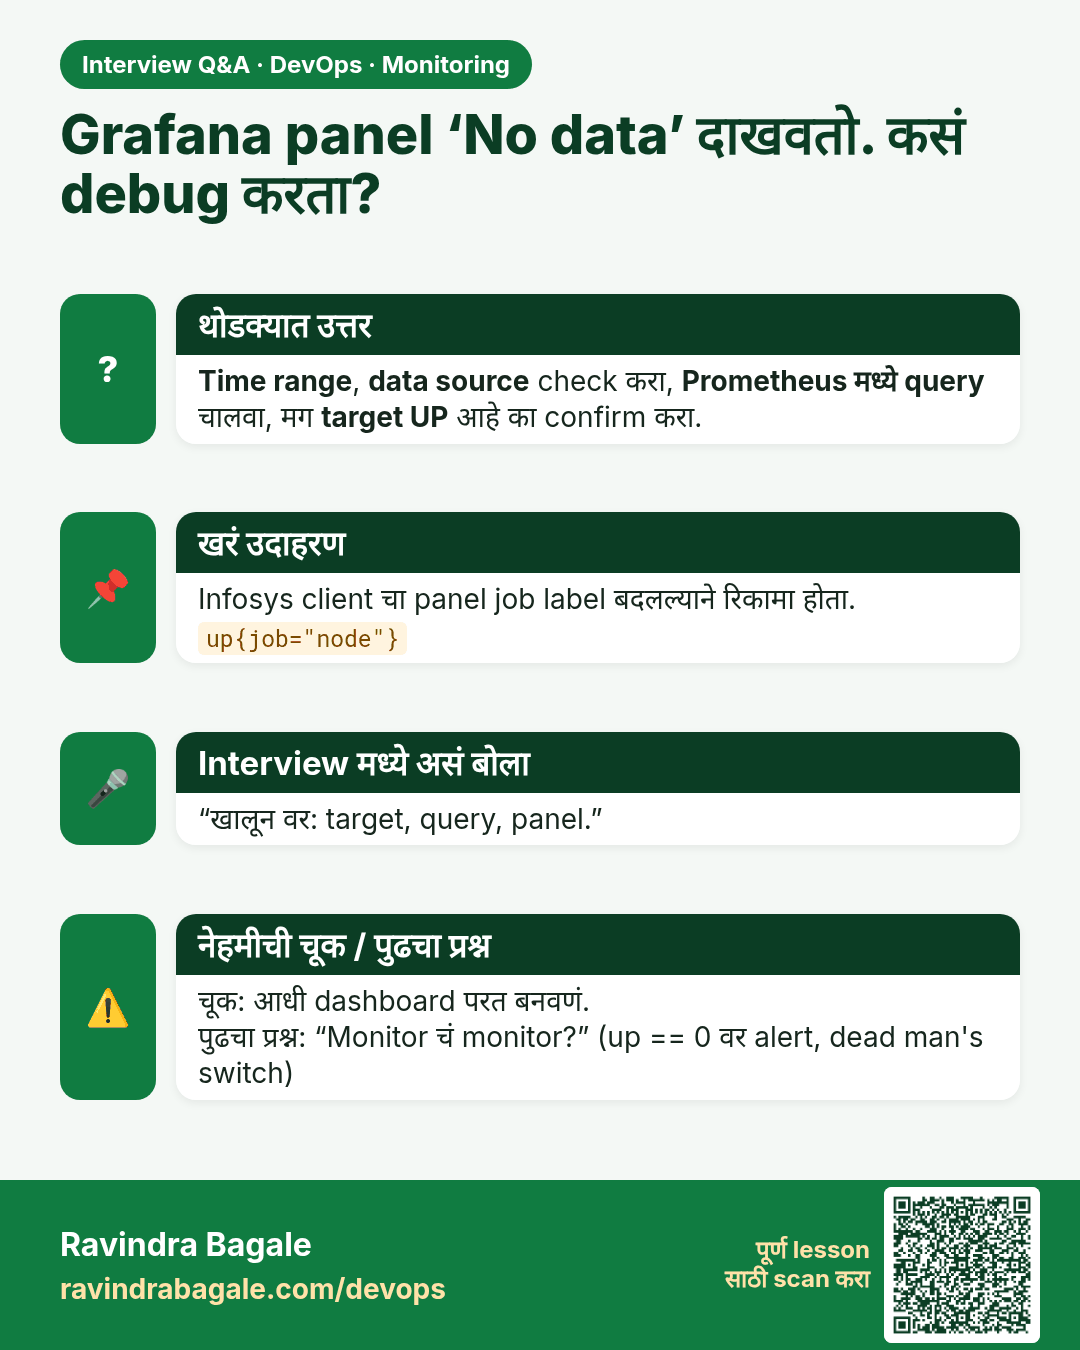
Grafana panel ‘No data’ दाखवतो. कसं debug करता? Time range, data source check करा, Prometheus मध्ये query चालवा, मग target UP आहे का confirm करा.
मुलाखत (Interview) card 12 of 13: Grafana panel ‘No data’ दाखवतो. कसं debug करता? · PNG download करा · Card page उघडा

Lesson: 13.12 Troubleshooting table

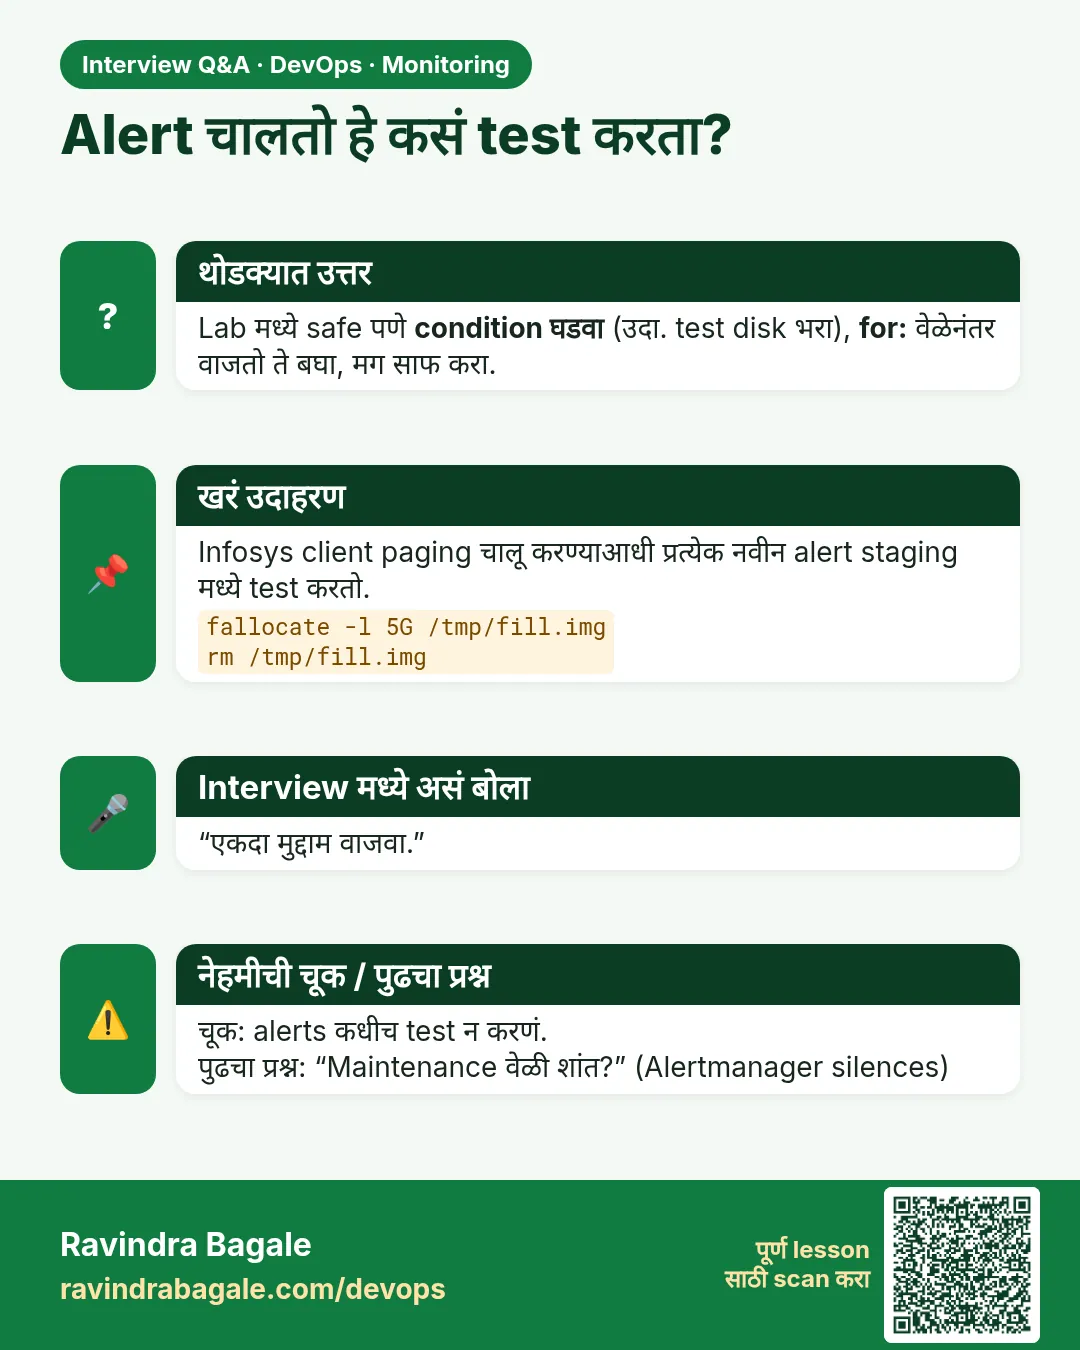
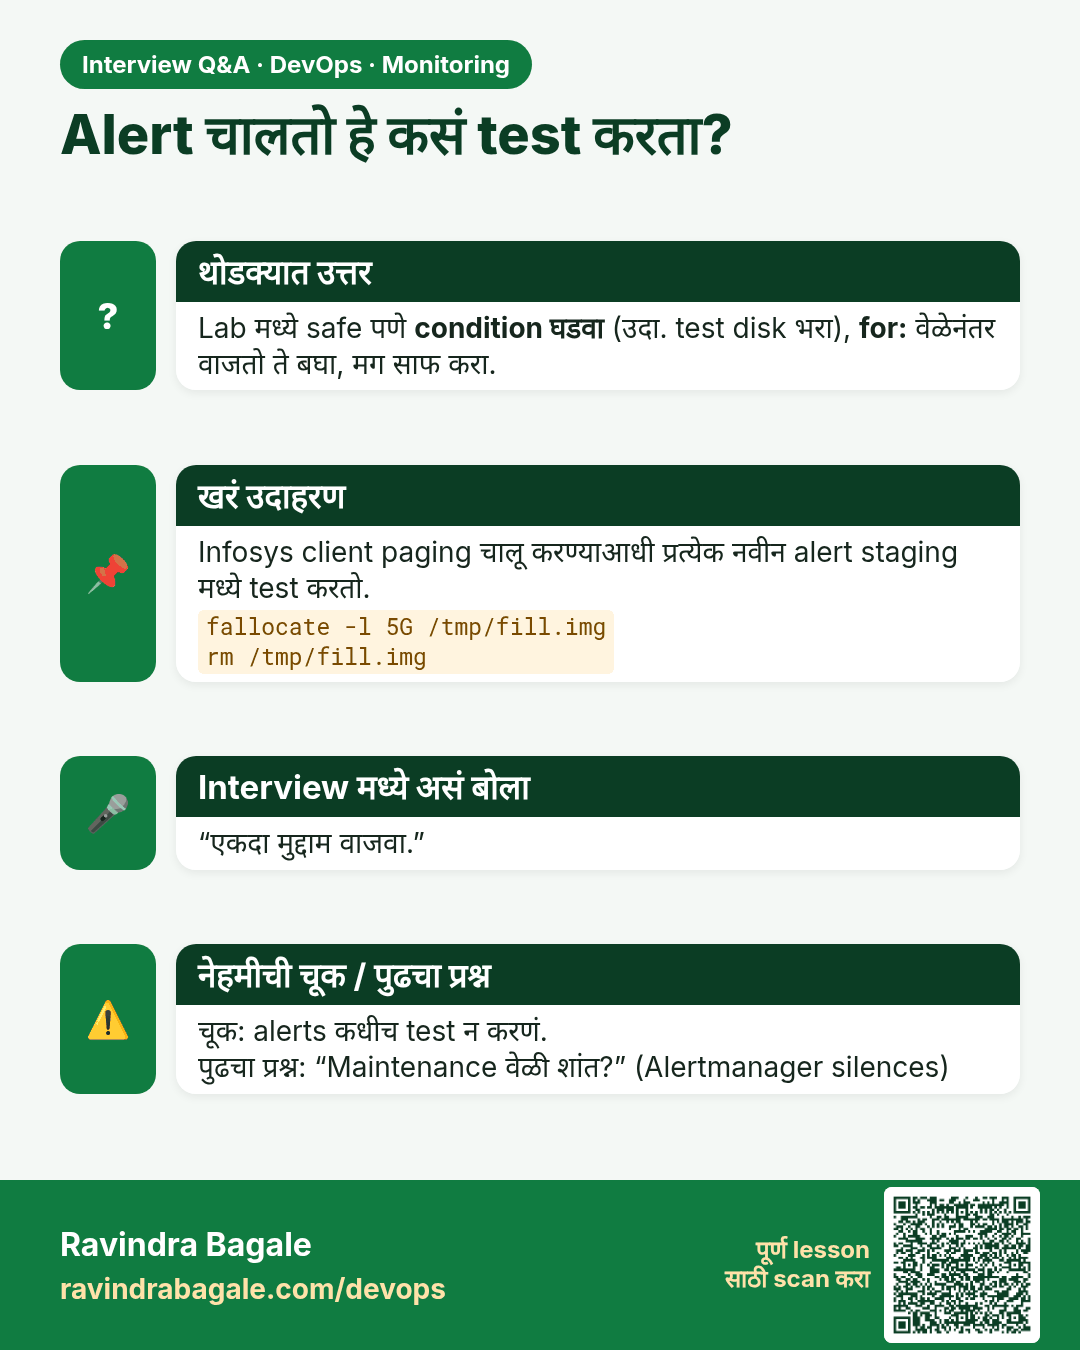
Alert चालतो हे कसं test करता? Lab मध्ये safe पणे condition घडवा (उदा. test disk भरा), for: वेळेनंतर वाजतो ते बघा, मग साफ करा.
मुलाखत (Interview) card 13 of 13: Alert चालतो हे कसं test करता? · PNG download करा · Card page उघडा

Lesson: 13.13 Lab — disk metric path and a triggered alert

तुलना (Comparison) cards

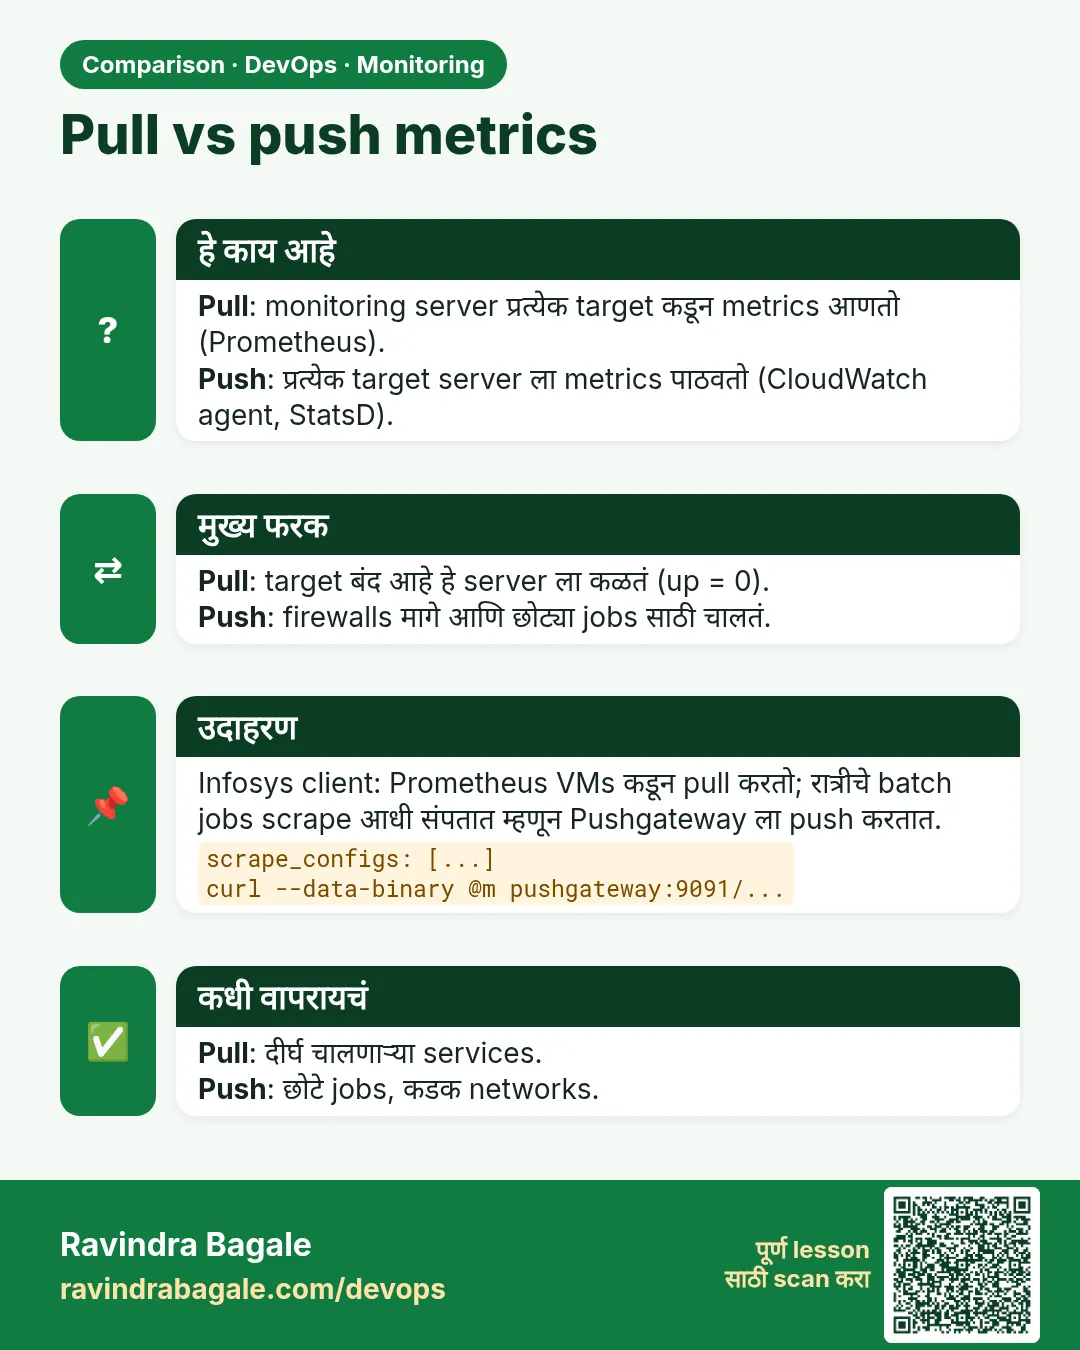
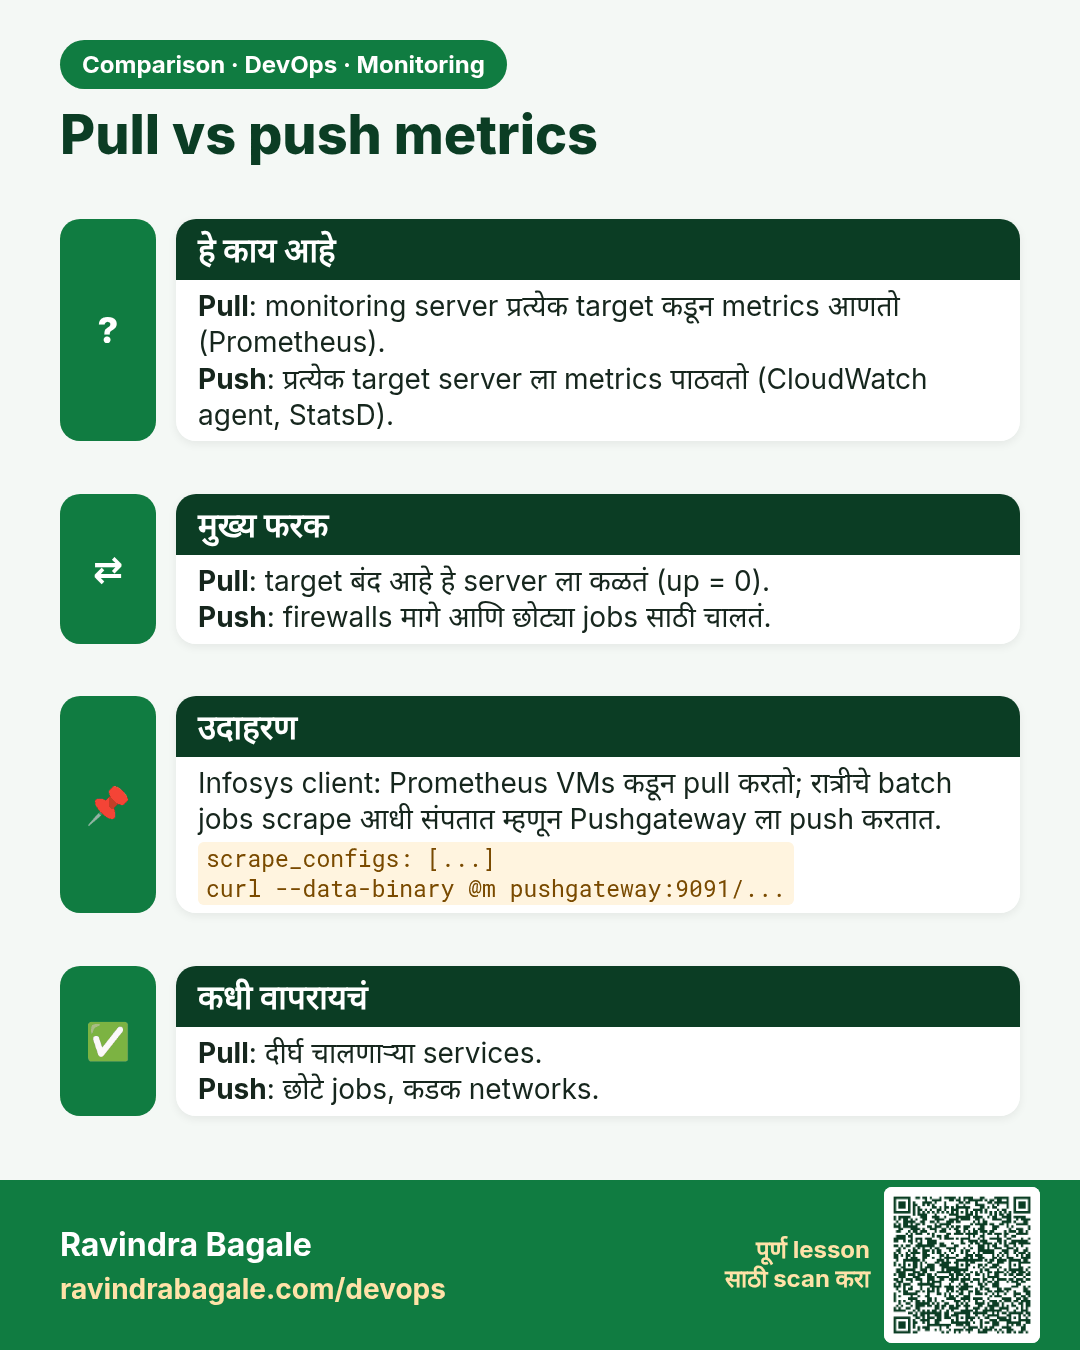
Pull vs push metrics. Pull: monitoring server प्रत्येक target कडून metrics आणतो (Prometheus).Push: प्रत्येक target server ला metrics पाठवतो (CloudWatch agent, StatsD).
तुलना (Comparison) card 1 of 3: Pull vs push metrics · PNG download करा · Card page उघडा

Lesson: 13.6 Prometheus — scrape and store
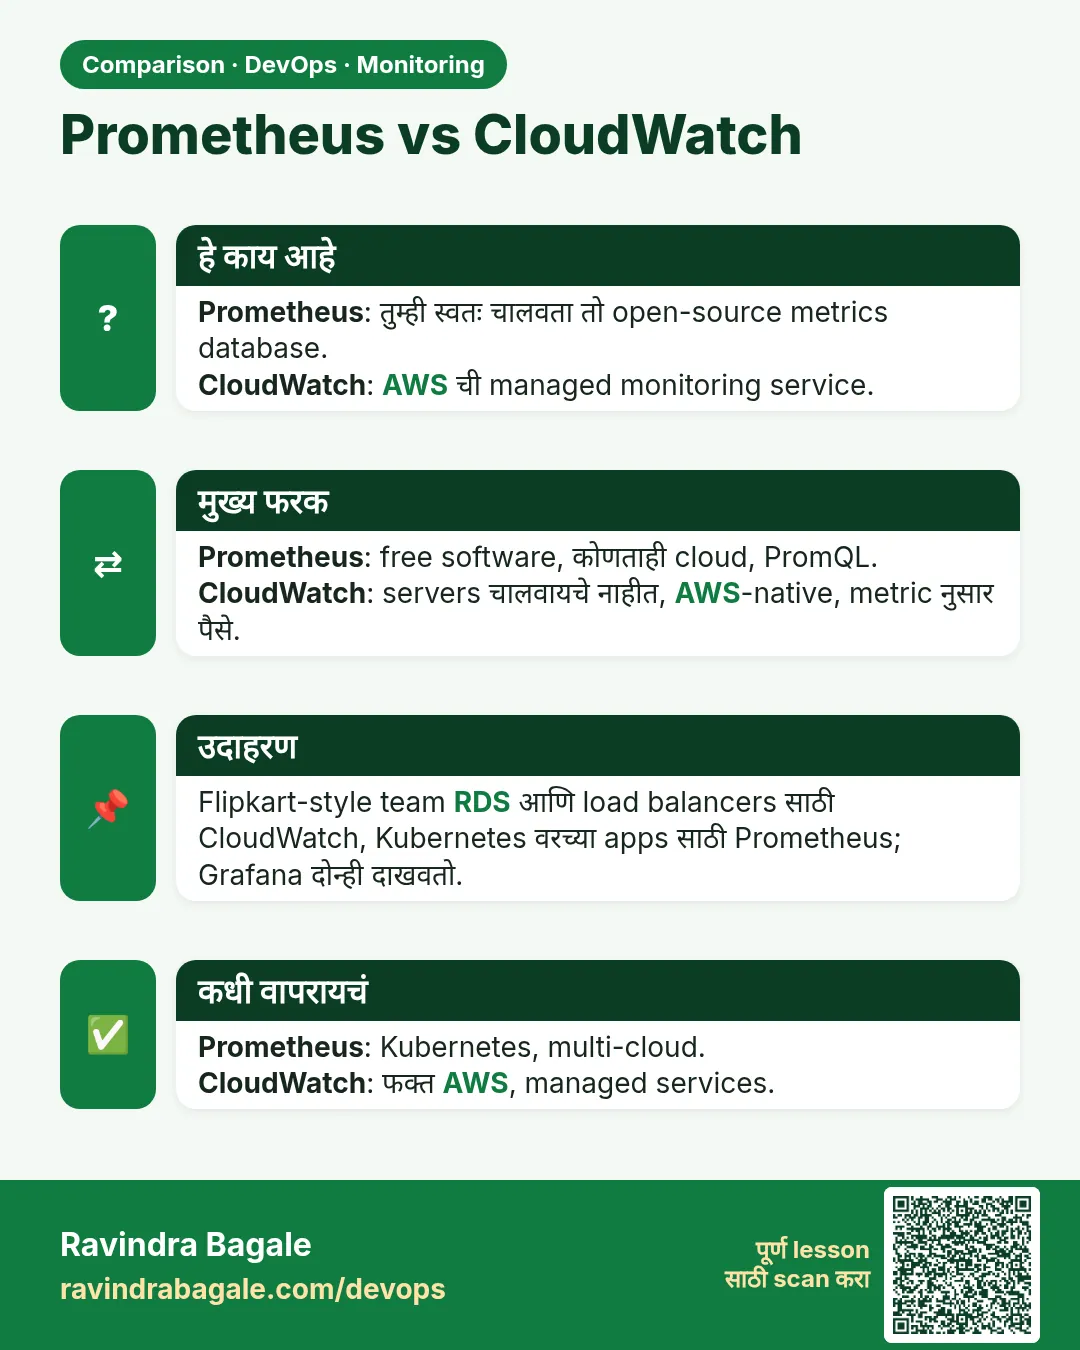
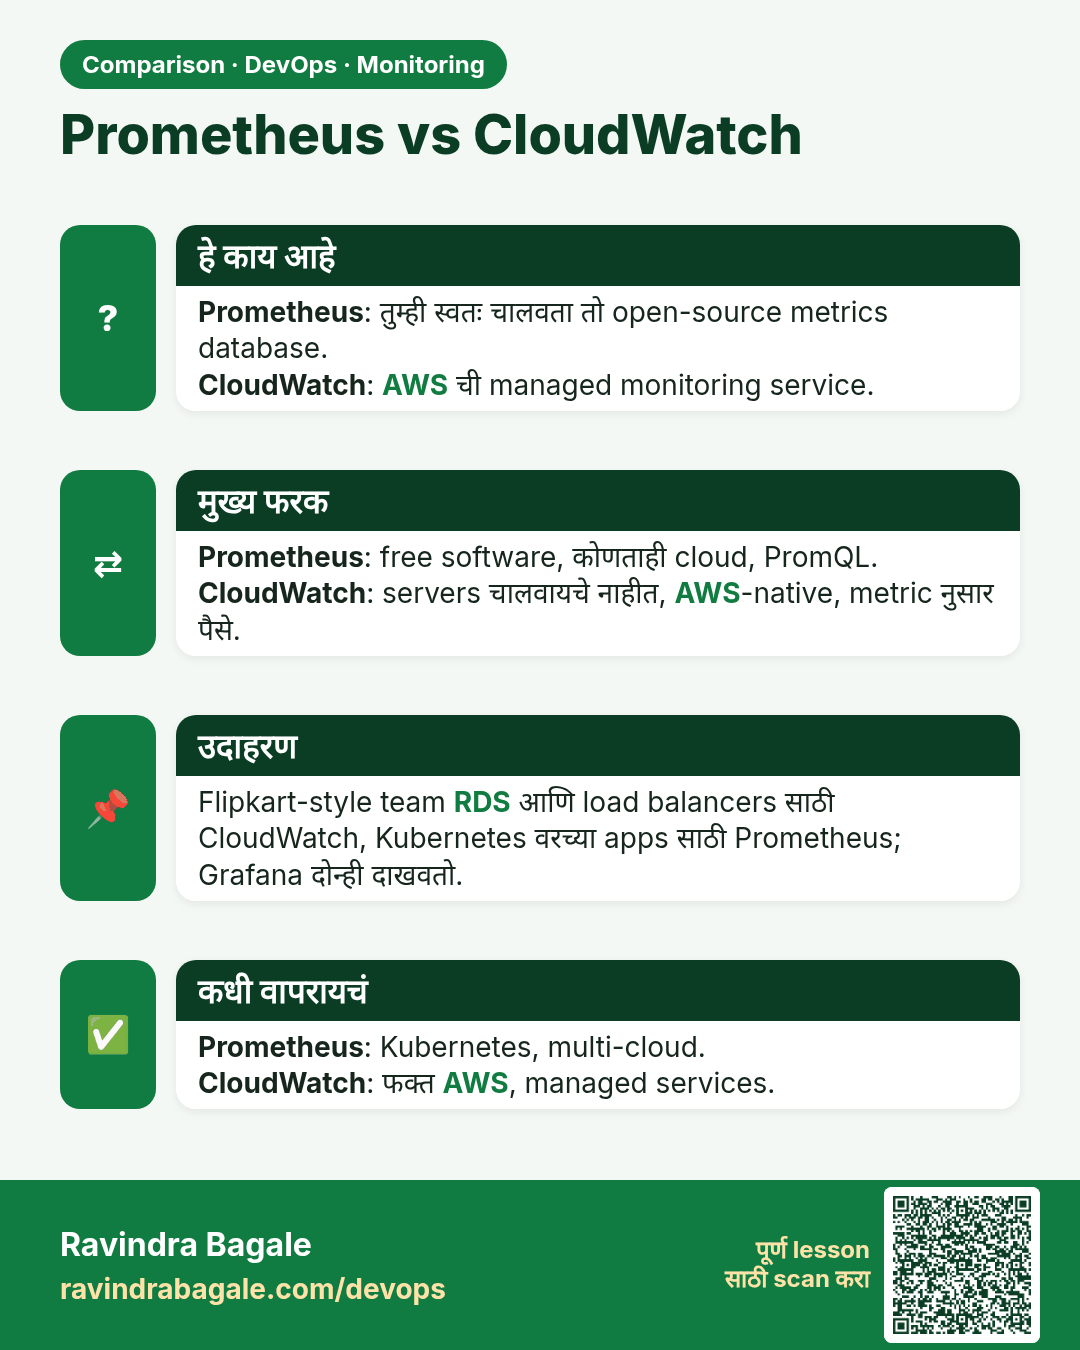
Prometheus vs CloudWatch. Prometheus: तुम्ही स्वतः चालवता तो open-source metrics database.CloudWatch: AWS ची managed monitoring service.
तुलना (Comparison) card 2 of 3: Prometheus vs CloudWatch · PNG download करा · Card page उघडा

Lesson: 13.10 CloudWatch in one paragraph (secondary path)
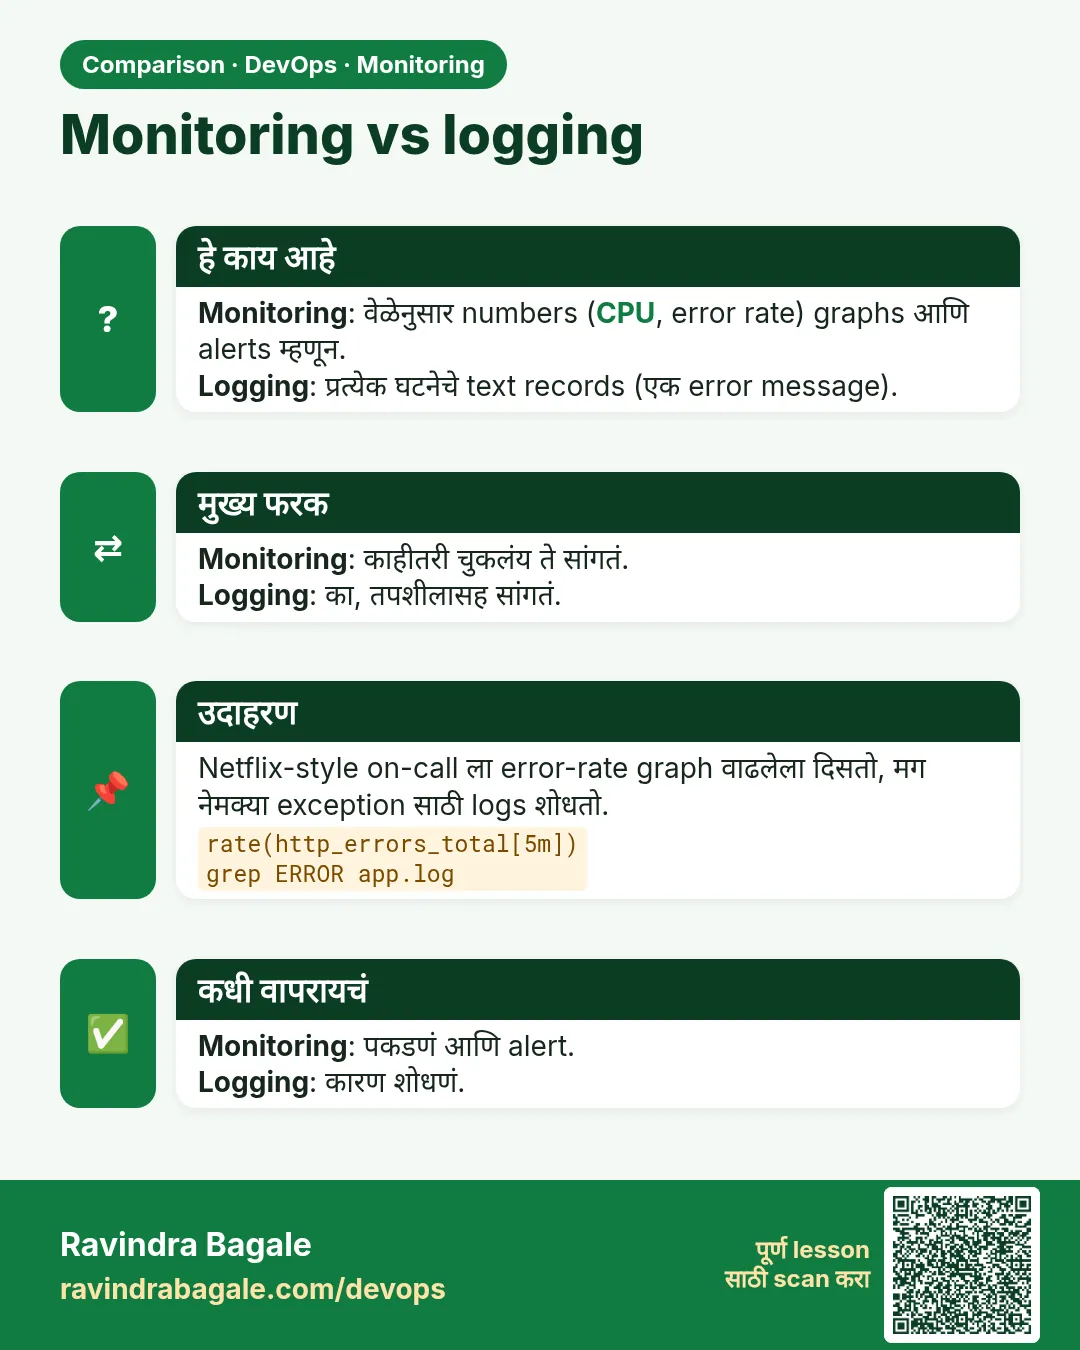
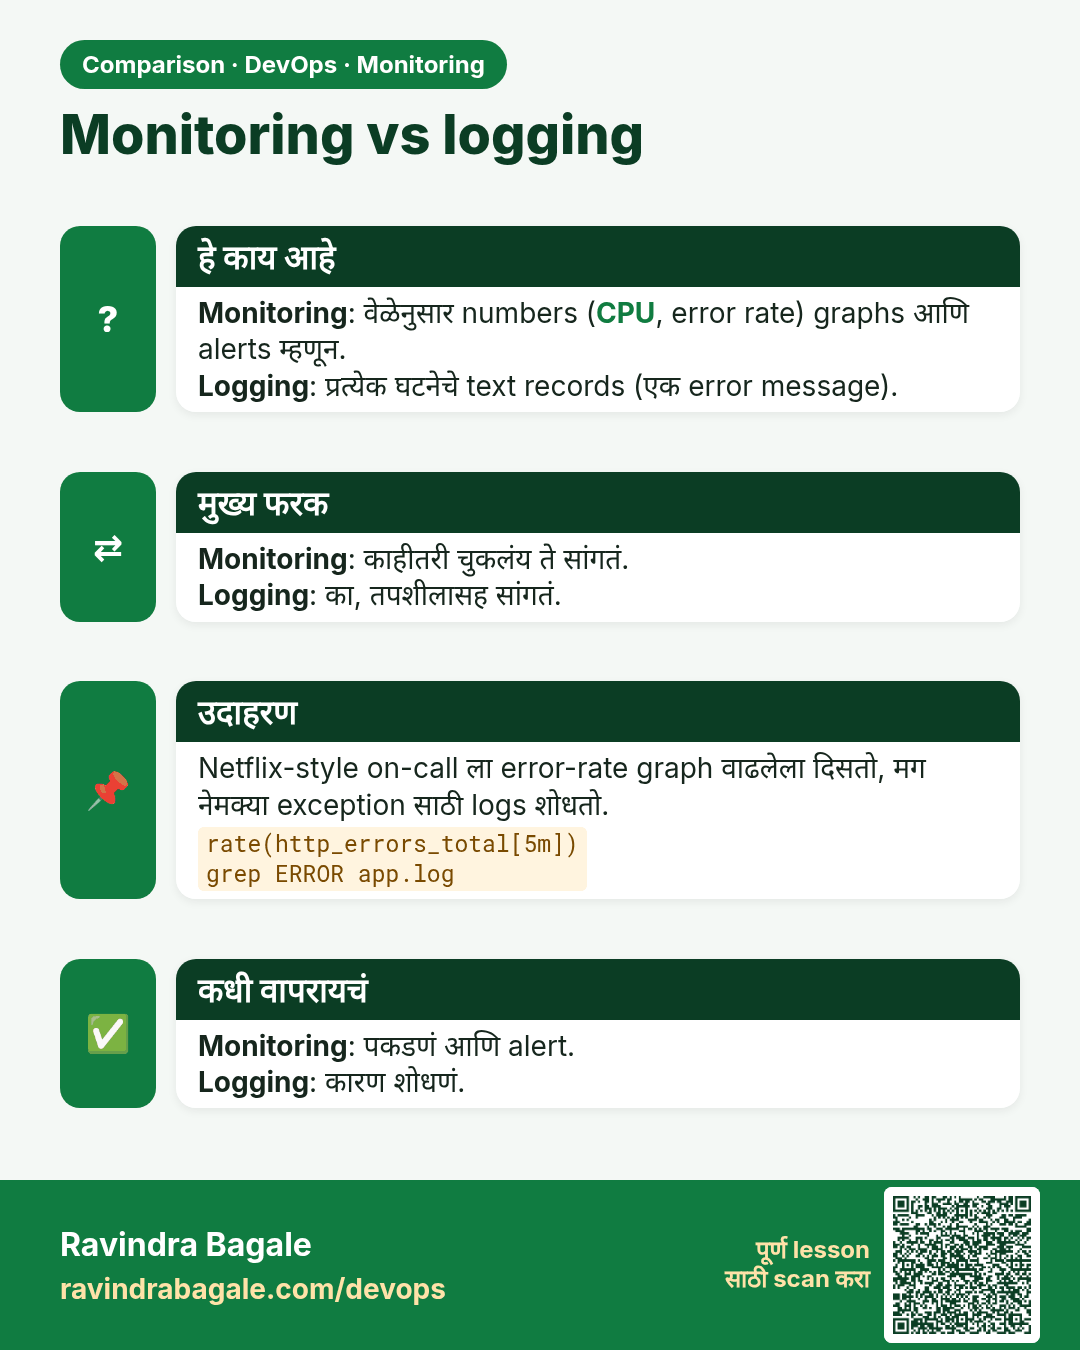
Monitoring vs logging. Monitoring: वेळेनुसार numbers (CPU, error rate) graphs आणि alerts म्हणून.Logging: प्रत्येक घटनेचे text records (एक error message).
तुलना (Comparison) card 3 of 3: Monitoring vs logging · PNG download करा · Card page उघडा

Lesson: 13.1 Why monitor — dashboard before the outage call