65. How to Forecast Sales with Time Series in Python (pandas and sklearn)
65.7 MAE, MAPE and Plot Past vs Forecast
65.7 MAE, MAPE आणि plot
“Chart बरा दिसतो” पुरेसे नाही. MAE आणि MAPE manager-ready numbers देतात.
हे का शिकायचं?
Why. “Looks okay on a chart” is not enough. MAE and MAPE give numbers you can put on WhatsApp to a manager.
हे काय आहे?
What.
- MAE — mean absolute error in the same units (₹). Easy to read.
- MAPE — mean absolute percentage error. Good to compare scales.
कसं करायचं?
How.
Score and plot
- Compute MAE = mean(|actual − pred|).
- Compute MAPE = mean(|actual − pred| / actual) * 100.
- Build one scoreboard for naive, seasonal naive, MA3, lag+LR.
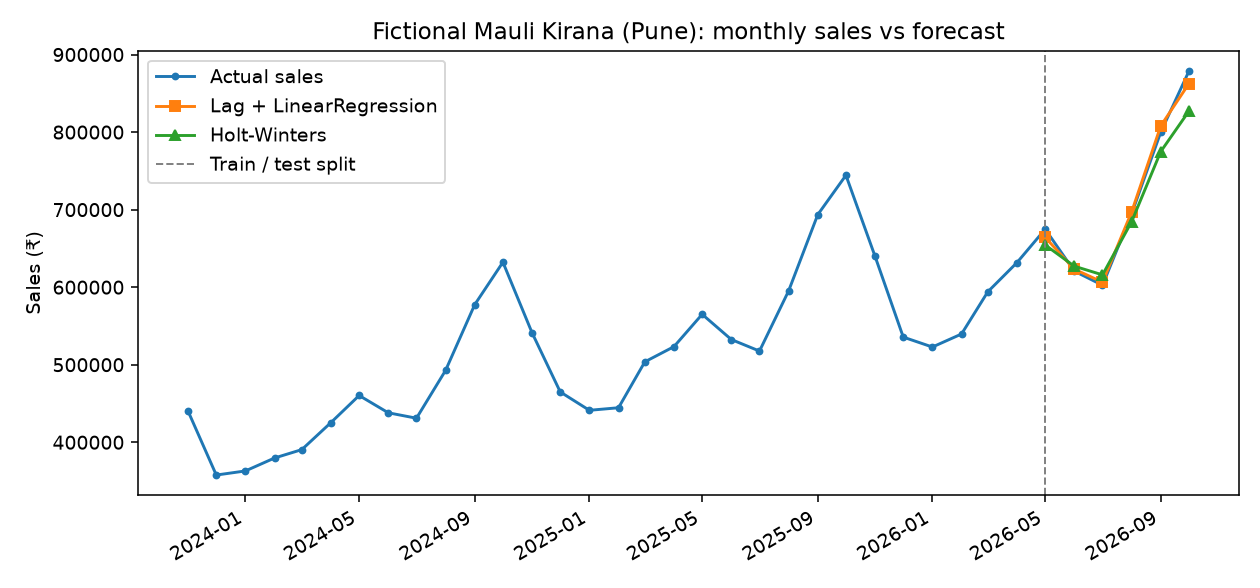
- Plot actual line + forecast line; mark the split.
Worked example A — Scoreboard (Mauli May–Oct 2026).
| Model | MAE (₹) | MAPE (%) |
|---|---|---|
| Naive last-value | 93,583 | 11.87 |
| Seasonal naive | 103,867 | 14.58 |
| MA(3) flat | 123,416 | 15.85 |
| Lag + LinearRegression | 7,258 | 0.97 |
| Holt-Winters (optional) | 21,162 | 2.79 |
याचा अर्थ. On this fictional series, lag + LR wins. Always re-check on your data.
Worked example B — MAPE in code.
import numpy as np

def mape(y, p):
    y = np.asarray(y, float)
    p = np.asarray(p, float)
    return float(np.mean(np.abs((y - p) / y)) * 100)

actual = [674800, 620700, 602500, 694700, 799900, 878700]
lr_pred = [664259, 623235, 606439, 697050, 807966, 862580]
print("MAPE %:", round(mape(actual, lr_pred), 2))
Output you should see.
MAPE %: 0.97
Worked example C — Plot.
import matplotlib.pyplot as plt
import pandas as pd
import numpy as np
from sklearn.linear_model import LinearRegression

df = pd.read_csv("mauli_monthly_sales.csv", parse_dates=["month"]).sort_values("month")
# ... build pred for test months as in 65.5 ...
# plt.plot(df["month"], df["sales_inr"], label="Actual")
# plt.plot(test["month"], pred, label="Lag + LR")
# plt.axvline(pd.Timestamp("2026-05-01"), ls="--", label="Split")
# plt.legend(); plt.show()
The chapter figure ch65-forecast-plot.png shows actual vs lag+LR and Holt-Winters with the train/test line.
Ravindra Bagale's Tip
MAE = error in ₹. MAPE = error in %. Give managers both. The chart builds trust.
Ravindra Bagale's Tip – मराठी
MAE = ₹ चूक. MAPE = % चूक. Manager ला दोन्ही. Chart = विश्वास.
Ravindra Bagale's Tip – हिंदी
MAE = ₹ गलती। MAPE = % गलती। Manager को दोनों दो। Chart = भरोसा।