65. How to Forecast Sales with Time Series in Python (pandas and sklearn)
65.7 MAE, MAPE and Plot Past vs Forecast
Why. “Looks okay on a chart” is not enough. MAE and MAPE give numbers you can put on WhatsApp to a manager.
What.
- MAE — mean absolute error in the same units (₹). Easy to read.
- MAPE — mean absolute percentage error. Good to compare scales.
How.
Score and plot
- Compute MAE = mean(|actual − pred|).
- Compute MAPE = mean(|actual − pred| / actual) * 100.
- Build one scoreboard for naive, seasonal naive, MA3, lag+LR.
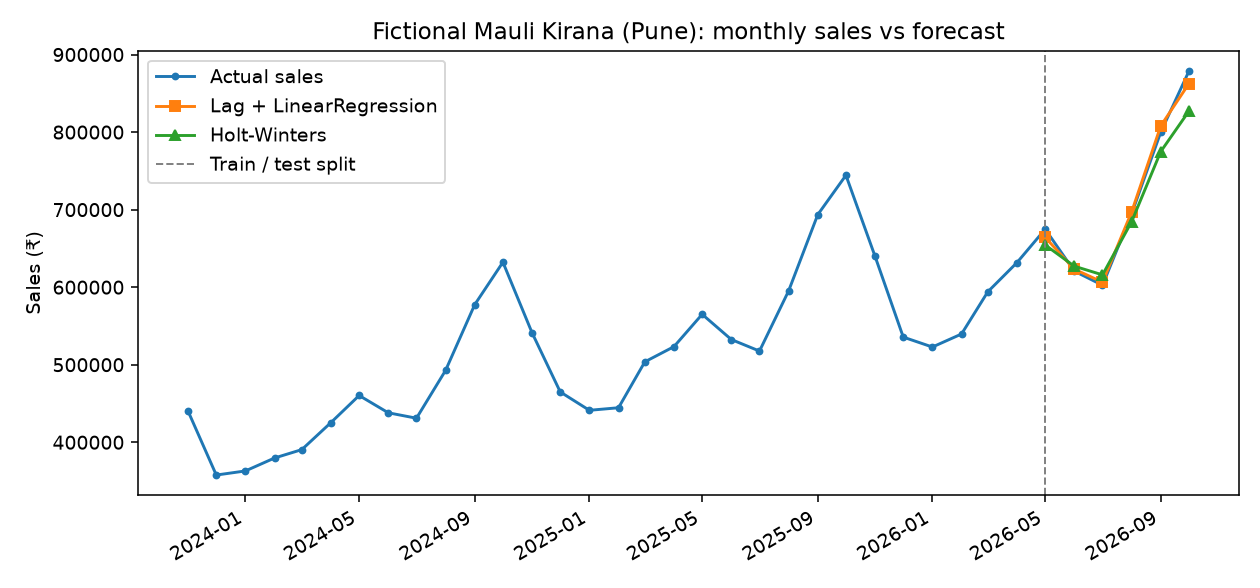
- Plot actual line + forecast line; mark the split.
Worked example A — Scoreboard (Mauli May–Oct 2026).
| Model | MAE (₹) | MAPE (%) |
|---|---|---|
| Naive last-value | 93,583 | 11.87 |
| Seasonal naive | 103,867 | 14.58 |
| MA(3) flat | 123,416 | 15.85 |
| Lag + LinearRegression | 7,258 | 0.97 |
| Holt-Winters (optional) | 21,162 | 2.79 |
What it means. On this fictional series, lag + LR wins. Always re-check on your data.
Worked example B — MAPE in code.
import numpy as np

def mape(y, p):
    y = np.asarray(y, float)
    p = np.asarray(p, float)
    return float(np.mean(np.abs((y - p) / y)) * 100)

actual = [674800, 620700, 602500, 694700, 799900, 878700]
lr_pred = [664259, 623235, 606439, 697050, 807966, 862580]
print("MAPE %:", round(mape(actual, lr_pred), 2))
Output you should see.
MAPE %: 0.97
Worked example C — Plot.
import matplotlib.pyplot as plt
import pandas as pd
import numpy as np
from sklearn.linear_model import LinearRegression

df = pd.read_csv("mauli_monthly_sales.csv", parse_dates=["month"]).sort_values("month")
# ... build pred for test months as in 65.5 ...
# plt.plot(df["month"], df["sales_inr"], label="Actual")
# plt.plot(test["month"], pred, label="Lag + LR")
# plt.axvline(pd.Timestamp("2026-05-01"), ls="--", label="Split")
# plt.legend(); plt.show()
The chapter figure ch65-forecast-plot.png shows actual vs lag+LR and Holt-Winters with the train/test line.
Ravindra Bagale's Tip
MAE = error in ₹. MAPE = error in %. Give managers both. The chart builds trust.
Ravindra Bagale's Tip – मराठी
MAE = ₹ चूक. MAPE = % चूक. Manager ला दोन्ही. Chart = विश्वास.
Ravindra Bagale's Tip – हिंदी
MAE = ₹ गलती। MAPE = % गलती। Manager को दोनों दो। Chart = भरोसा।