Excel → Power BI Bridge
Bridge 5. Power Query in Excel and Power BI
Friends,
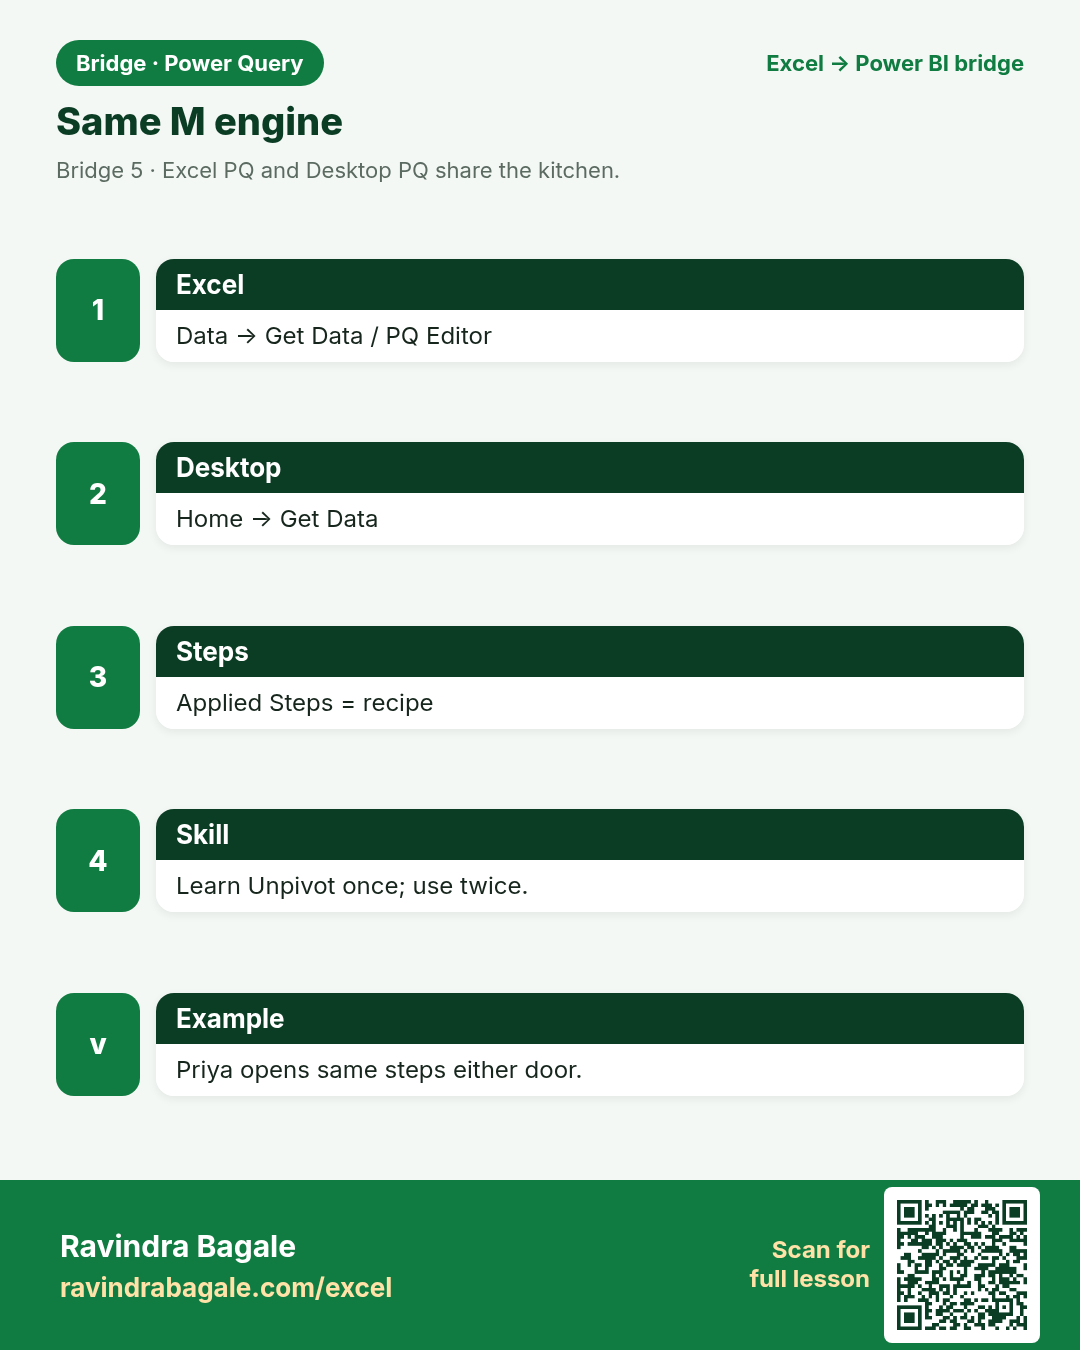
Friends, power Query is the shared kitchen. Excel and Desktop cook with the same M. Learn once; use twice.
चला मित्रांनो
चला मित्रांनो, Power Query ही shared kitchen. Excel आणि Desktop एकच M. एकदा शिका; दोनदा वापरा.
चलो दोस्तों
चलो दोस्तों, Power Query shared kitchen है. Excel और Desktop एक ही M. एक बार सीखो; दो बार इस्तेमाल करो.
At deploy, files go to s3://ravindrabagale-cards/excel/bridge/ .
What you will learn
- See Excel PQ and Desktop PQ as one engine.
- Trim / type / unpivot before load.
- Know Close & Load vs Close & Apply.
- Use append/merge without destroying keys.
A short story
Emma’s Manchester file has wide Jan/Feb/Mar columns. Neha’s names have extra spaces. Same Unpivot and Trim steps work in Excel PQ and in Desktop.
Ravindra Bagale’s Tip
Fix messy columns in Power Query, not with 40 helper columns you forget to refresh.
Ravindra Bagale’s Tip – मराठी
गोंधळाच्या columns Power Query मध्ये दुरुस्त करा — 40 helper columns नको.
Ravindra Bagale’s Tip – हिंदी
गंदे columns Power Query में ठीक करो — 40 helper columns नहीं.
1. Same engine, two doors
Friends,
If you can Unpivot in Excel PQ, you can Unpivot in Desktop.
चला मित्रांनो
Excel PQ मध्ये Unpivot आले की Desktop मध्येही येईल.
चलो दोस्तों
Excel PQ में Unpivot आया तो Desktop में भी आएगा.
Why: Get Data in Excel and Desktop open PQ.
What: Home → Get Data / Launch Power Query Editor.
How:
- Open the workbook in Excel PQ or Desktop.
- View the Applied Steps pane.
- Rename the query to Sales_Clean.
- Know that M is behind the clicks.
| Excel | Power BI / DAX | Result | Meaning |
|---|---|---|---|
ExcelData → Get Data |
Power BIHome → Get Data |
Editor |
Priya opens the same steps in either tool. |
2. Trim and clean text
Friends,
Trim before you merge on Name — better: merge on keys, not names.
चला मित्रांनो
Merge आधी Trim — पण नावांवर merge टाळा; keys वापरा.
चलो दोस्तों
Merge से पहले Trim — पर नाम पर merge से बचो; keys इस्तेमाल करो.
Why: Spaces break joins later.
What: Transform → Format → Trim / Clean.
How:
- Select Name column → Trim.
- Replace double spaces if needed.
- Set types after cleaning.
- Close & Apply / Load.
| Excel | Power BI / DAX | Result | Meaning |
|---|---|---|---|
Excel PQTrim on Name |
Desktop PQTrim on Name |
Clean |
" Priya Sharma" becomes Priya Sharma. |
3. Wide months → tall facts
Friends,
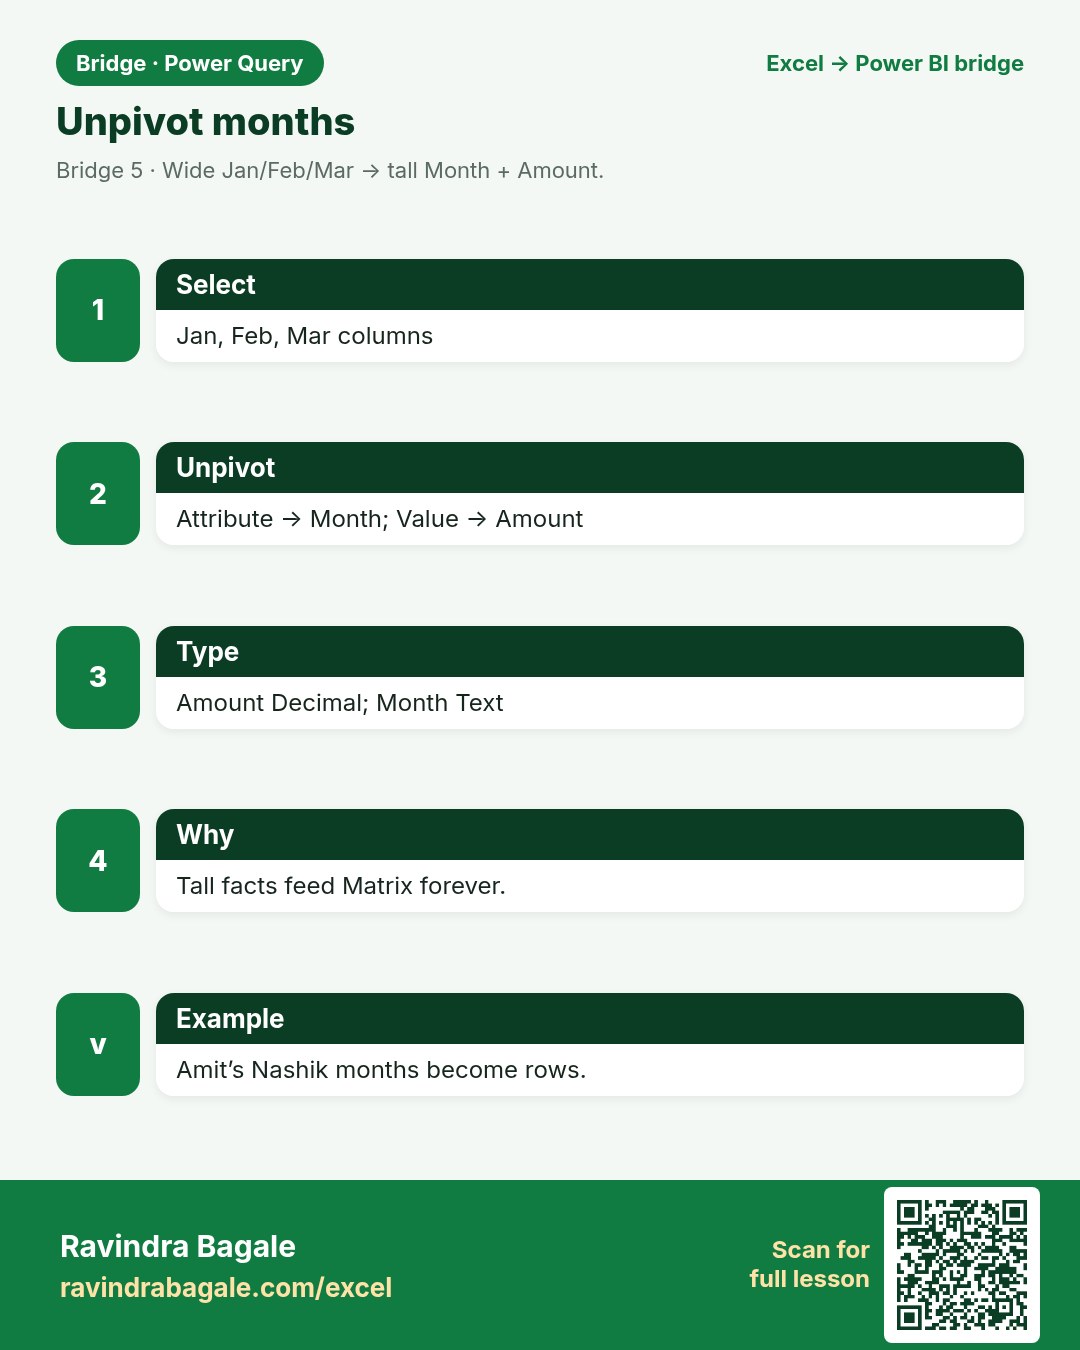
Tall facts + a Month column beat 12 month columns forever.
चला मित्रांनो
Tall facts + Month column = दीर्घकालीन शांतता.
चलो दोस्तों
Tall facts + Month column = लंबी शांति.
Why: Jan/Feb/Mar columns are analysis poison long-term.
What: Select month columns → Unpivot Columns.
How:
- On Wide_Months, select Jan,Feb,Mar.
- Unpivot Columns → Attribute=Month, Value=Amount.
- Rename Attribute to Month.
- Load tall table for Pivot/Matrix.
| Excel | Power BI / DAX | Result | Meaning |
|---|---|---|---|
Excel sheetWide months |
Power QueryUnpivot → tall |
Tall |
Amit’s Nashik months become rows. |
4. Append monthly files
Friends,
Append needs matching columns. Merge needs matching keys.
चला मित्रांनो
Append = समान columns. Merge = keys.
चलो दोस्तों
Append = समान columns. Merge = keys.
Why: Stack same-shaped tables.
What: Append Queries.
How:
- Keep identical column names.
- Append April under March.
- Add a SourceFile column if helpful.
- Avoid appending different schemas blindly.
| Excel | Power BI / DAX | Result | Meaning |
|---|---|---|---|
ExcelCopy-paste under (risky) |
Power QueryAppend Queries |
Stacked |
Omar stacks Dubai fee months. |
5. Merge ≈ controlled VLOOKUP
Friends,
Keys beat fuzzy name matches for class and for production.
चला मित्रांनो
Keys > अस्पष्ट नाव match.
चलो दोस्तों
Keys > अस्पष्ट नाम match.
Why: Bring ProductName onto sales with ProductID.
What: Merge Queries → Left Outer on ProductID.
How:
- Sales Left Outer Dim_Product.
- Expand ProductName only.
- Do not expand everything “just in case”.
- Validate with a few known IDs.
| Excel | Power BI / DAX | Result | Meaning |
|---|---|---|---|
ExcelVLOOKUP/XLOOKUP |
Power QueryMerge on ProductID |
Name on fact |
Chen Wei sees USB cable names. |
6. Types before Apply
Friends,
Type once in PQ; stop re-fighting charts later.
चला मित्रांनो
PQ मध्ये एकदा type — नंतर charts शांत.
चलो दोस्तों
PQ में एक बार type — बाद में charts शांत.
Why: Same lesson as tables chapter — reinforce.
What: Set Decimal / Date / Text in PQ.
How:
- Amount → Decimal.
- Date → Date.
- ID codes → Text.
- Apply and spot-check Data view.
| Excel | Power BI / DAX | Result | Meaning |
|---|---|---|---|
Excel formatCosmetic often |
PQ data typeReal type for model |
Typed |
Sofia’s € amounts sum. |
7. Close & Load vs Close & Apply
Friends,
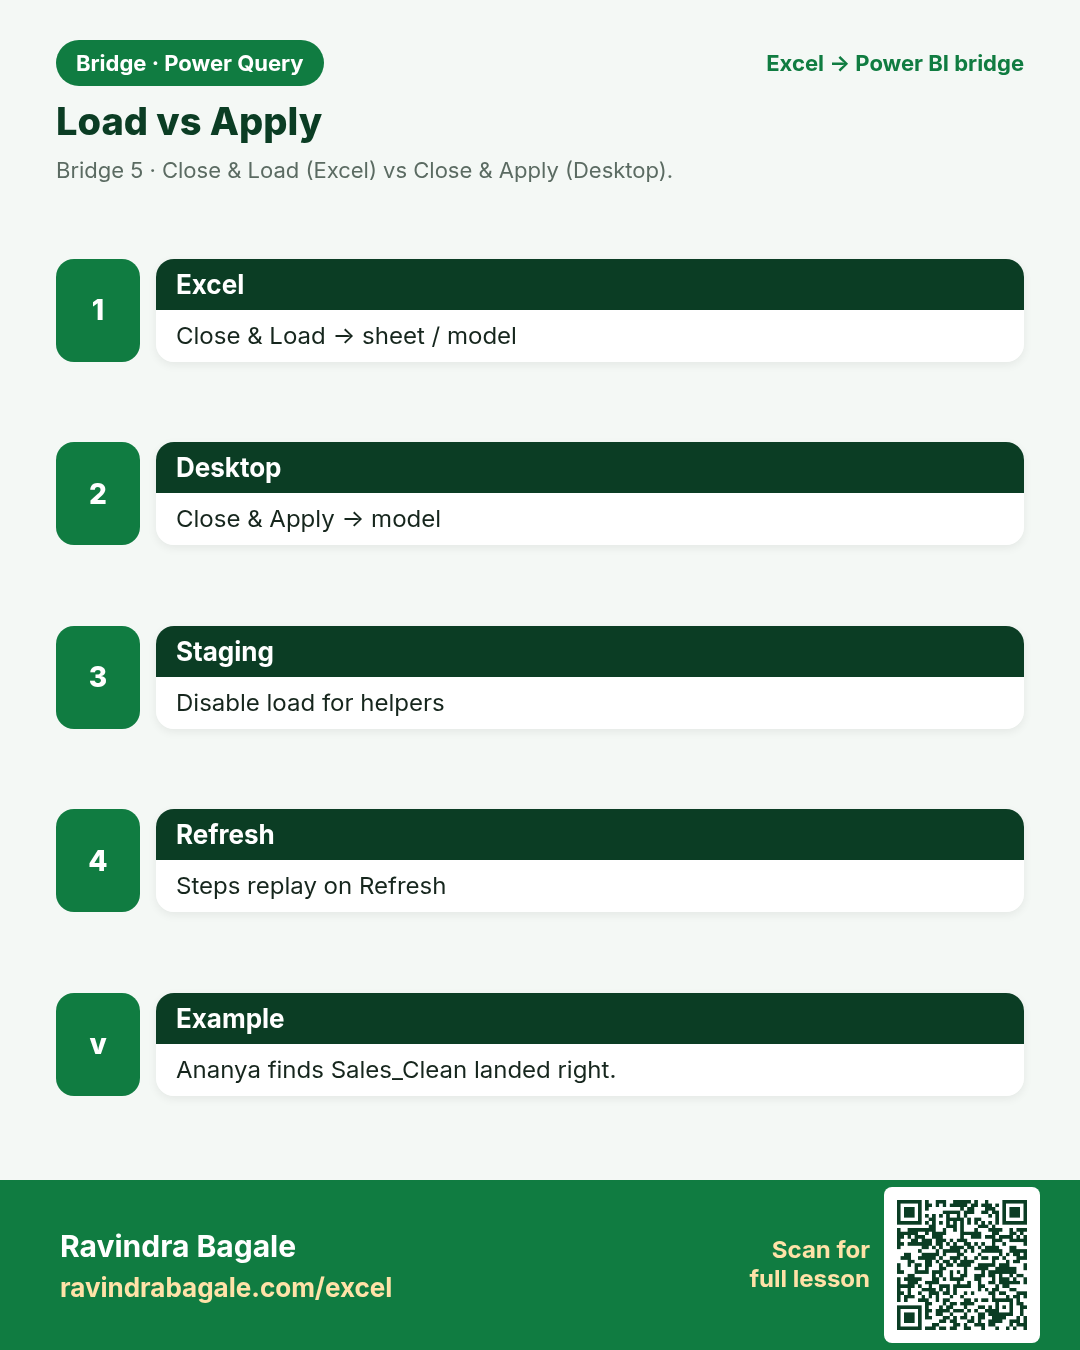
Staging queries clean; only facts/dims load.
चला मित्रांनो
Staging स्वच्छ करते; फक्त facts/dims load.
चलो दोस्तों
Staging साफ़ करता है; सिर्फ facts/dims load.
Why: Excel loads to sheet/model; Desktop to model.
What: Know where the data landed.
How:
- Excel: Close & Load to Table on sheet (or Data Model).
- Desktop: Close & Apply to model.
- Disable load for staging.
- Refresh later from the same query.
| Excel | Power BI / DAX | Result | Meaning |
|---|---|---|---|
ExcelClose & Load |
Power BIClose & Apply |
Landed |
Ananya finds Sales_Clean in the right place. |
8. Refresh the query, not the myth
Friends,
The recipe (steps) matters more than one heroic paste.
चला मित्रांनो
पाककृती (steps) महत्त्वाची — एक paste नाही.
चलो दोस्तों
रेसिपी (steps) ज़रूरी — एक paste नहीं.
Why: Change source rows; refresh steps replay.
What: Data → Refresh / Home → Refresh.
How:
- Add a new sale row in source.
- Refresh the query.
- Confirm new row appears.
- Teach that steps are the recipe.
| Excel | Power BI / DAX | Result | Meaning |
|---|---|---|---|
ExcelRefresh All |
DesktopRefresh |
Updated |
Neha’s new Kolhapur line appears. |
Practice tasks (12)
Use bridge-pq-practice.xlsx. LibreOffice-safe: prefer SUMIF / VLOOKUP / IF — avoid XLOOKUP, TEXTJOIN, TEXTSPLIT.
- Read About. Open Wide_Months.
Hint
See Jan/Feb/Mar.
- In Excel (or describe steps): Unpivot Jan–Mar.
Hint
Attribute→Month.
- On Dirty_Names, write =TRIM(A2) helper (LibreOffice OK).
Hint
Preview clean names.
- List Applied Steps you would keep for Sales_Clean.
Hint
Notes.
- Write Append vs Merge in one line each.
Hint
Stack vs key join.
- SUM of Jan column on Wide_Months with SUM.
Hint
Before unpivot.
- Explain why codes stay Text after PQ.
Hint
Leading zeros.
- Disable-load purpose in one sentence.
Hint
Staging.
- Map Close & Load vs Close & Apply.
Hint
Excel vs Desktop.
- Propose a SourceMonth column after append.
Hint
Which file/month.
- COUNTIF cities on Dirty_Names.
Hint
Quality check.
- Write the refresh click path you will teach.
Hint
Refresh All / Refresh.
Quick quiz
Q1. Excel PQ and Desktop PQ share…
Q2. Unpivot turns wide months into…
Q3. Trim mainly fixes…
Q4. Merge Queries is closest to…
Q5. Append Queries needs…
Q6. Close & Apply in Desktop loads to…
Q7. Staging query tip:
Q8. After source rows change, you…
Loading practice tasks...
- Rows in the fact table (Easy): How many orders are in the Sales table?
- Total amount (Easy): Add up the Amount column of Sales.
- Total quantity (Easy): Add up the Qty column of Sales.
- Products in the dimension (Easy): How many products are in the Products table?
- Products actually sold (Medium): How many of the 5 Product IDs (P01 to P05) appear at least once in Sales?
- Amount for one city (Medium): Add up Amount where City is "London".
- Product name through the relationship (Medium): What is the Product name for Product ID "P03"?
- Sales of one product (Medium): Add up Amount where Product ID is "P03".
- Average order amount (Medium): Find the average Amount, rounded to 0 decimals.
- Category of the first order (Hard): Find the Category of the product in the first order.
- Biggest order in London (Hard): What is the largest Amount where City is "London"?
- Share of P03 (Hard): What share of the total Amount comes from Product ID "P03"? Round to 3 decimals.
Quick revision cards (3)
Approved Excel card style: standalone, no tip/photo section, QR to this lesson.