Excel → Power BI Bridge
Bridge 1. Why move from Excel to Power BI
Friends,
Friends, today we start the Excel → Power BI bridge. You keep Excel. You add Power BI where shared truth, refresh, and models matter. Short sentences. Why → What → How. Easy examples from Pune to Manchester.
चला मित्रांनो
चला मित्रांनो, आज Excel → Power BI bridge सुरू. Excel ठेवा. जिथे shared truth, refresh आणि model गरजेचे आहे तिथे Power BI. लहान वाक्य. Why → What → How.
चलो दोस्तों
चलो दोस्तों, आज Excel → Power BI bridge शुरू. Excel रखो. जहाँ shared truth, refresh और model ज़रूरी हों वहाँ Power BI. छोटे वाक्य. Why → What → How.
Practice workbook and revision cards load from s3://ravindrabagale-cards/excel/bridge/.
What you will learn
- Spot when Excel reporting is past its safe zone.
- Know when staying in Excel is the smart call.
- See the flat-sheet → model idea in one picture.
- Map Excel skills to Power BI homes before writing hard DAX.
A short story
Priya’s Pune kirana sales, Emma’s Manchester shop pack, and Omar’s Dubai desk fees all live in three emailed workbooks. Monday’s “total” never matches. This chapter is the honest talk before formulas: why a bridge to Power BI exists — and when Excel is still enough.
Ravindra Bagale’s Tip
Do not rebuild everything on day one. Pick one report that already has clean tables. Move that first. Success builds trust.
Ravindra Bagale’s Tip – मराठी
पहिल्या दिवशी सगळे rebuild करू नका. स्वच्छ tables असलेला एक report निवडा. आधी तो हलवा. यश विश्वास वाढवते.
Ravindra Bagale’s Tip – हिंदी
पहले दिन सब rebuild मत करो. साफ़ tables वाला एक report चुनो. पहले वही हिलाओ. सफलता भरोसा बढ़ाती है.
1. When Excel starts to hurt
Friends,
Friends, excel is wonderful. But when the file becomes a second job, Power BI is the next tool — not a replacement for thinking.
चला मित्रांनो
मित्रांनो, Excel छान आहे. पण फाइल दुसरी नोकरी झाली की Power BI पुढचे साधन आहे — विचार करण्याची जागा नाही.
चलो दोस्तों
दोस्तों, Excel बढ़िया है. लेकिन जब फाइल दूसरी नौकरी बन जाए, Power BI अगला औज़ार है — सोचने की जगह नहीं।
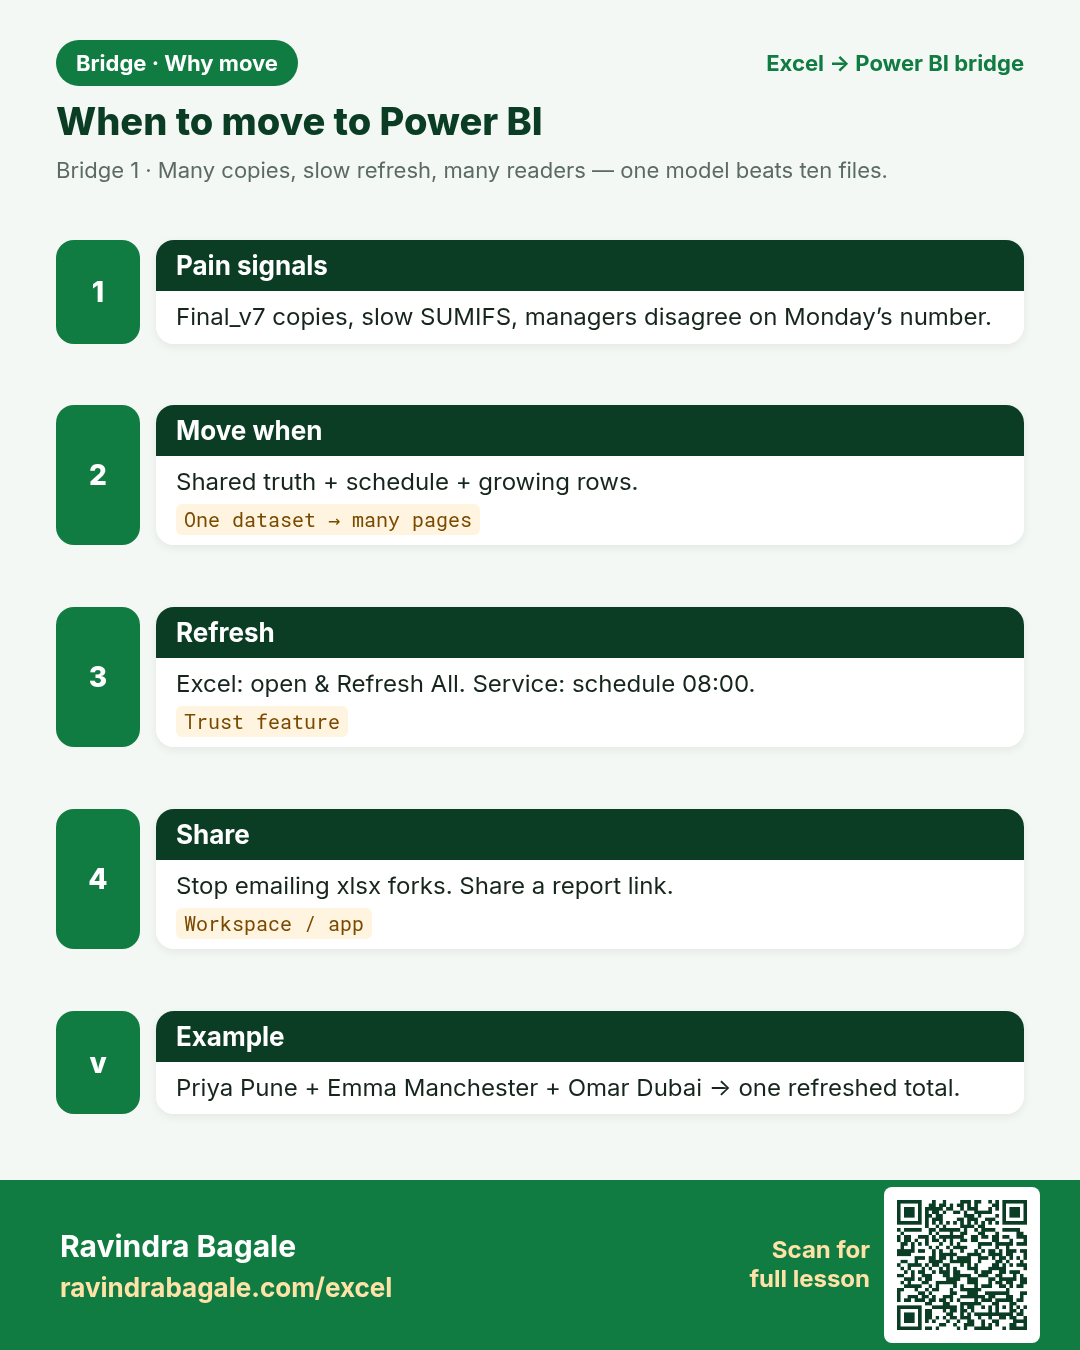
Why: Your file grows. Formulas crawl. Two people edit two copies. The Monday number never matches the Tuesday number.
What: Signs that a workbook is past its safe size for shared reporting.
How:
- Watch for files over ~50–100 MB, or sheets with hundreds of thousands of rows.
- Notice VLOOKUP and SUMIFS that take many seconds after every filter.
- Count how many “Final_v3_REAL.xlsx” copies sit in WhatsApp and email.
- Ask: does every manager trust the same number at 10 am?
- If no — you need one model and one refresh, not ten copies.
| Excel | Power BI / DAX | Result | Meaning |
|---|---|---|---|
Excel symptomFinal_Sales_v7_Ravi.xlsx + Final_Sales_v7_Priya.xlsx |
Power BI goalOne dataset → many report pages |
One truth |
Pune retail + Manchester shop both read the same refreshed sales total. |
2. When you should stay in Excel
Friends,
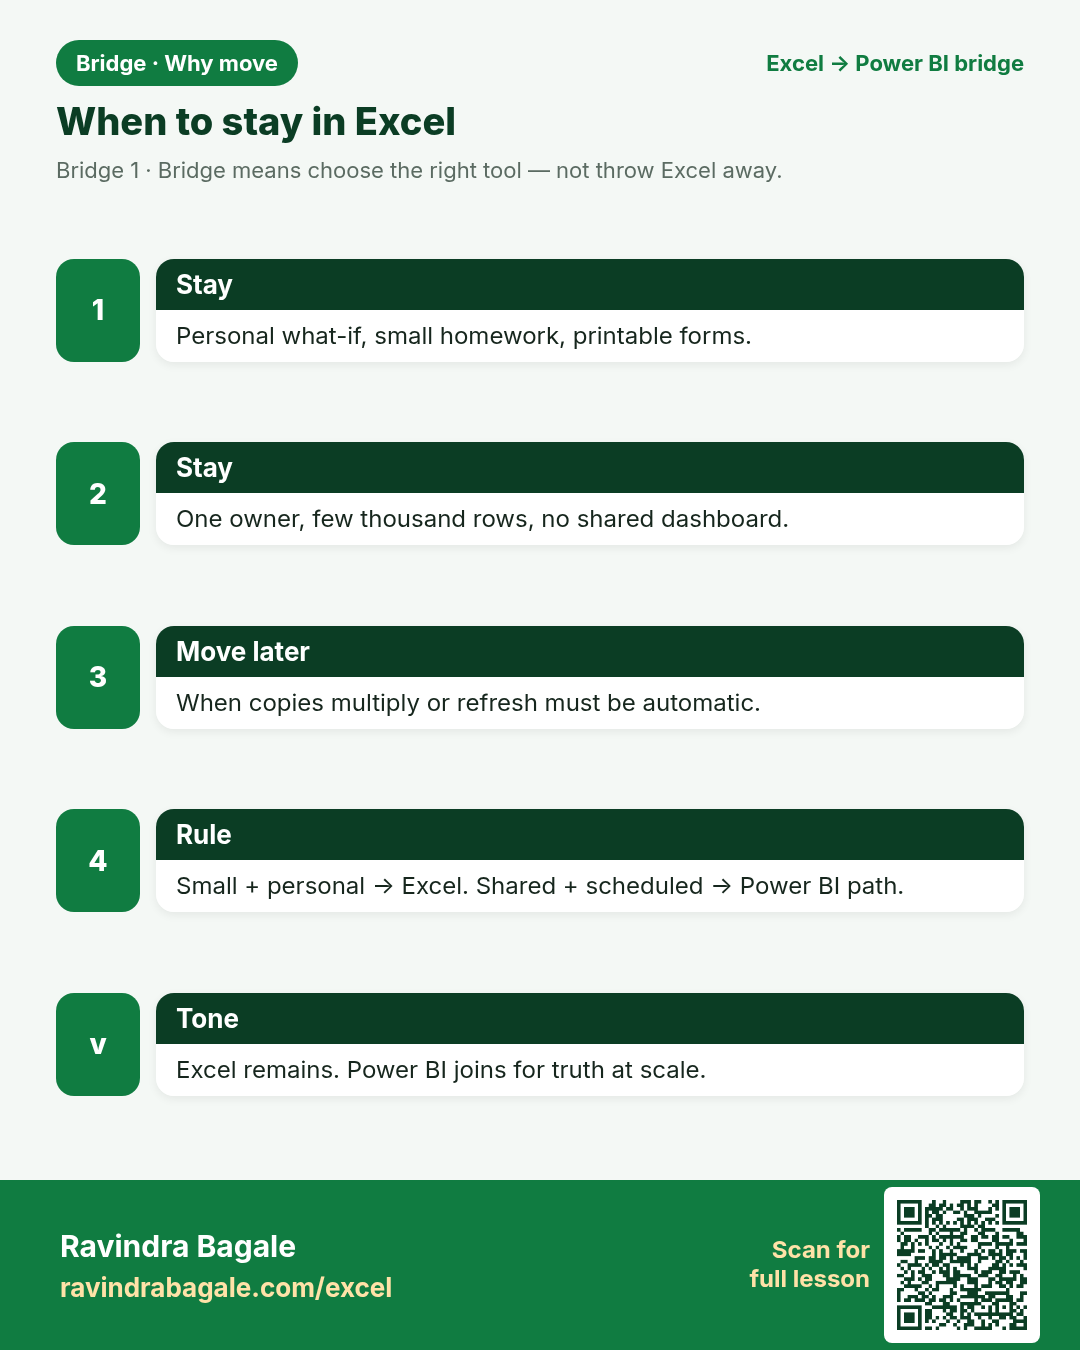
Friends, do not feel forced. Bridge means choose the right tool, not throw Excel away.
चला मित्रांनो
चला मित्रांनो — जबरदस्ती नका. Bridge म्हणजे योग्य साधन निवडा, Excel फेकून देऊ नका.
चलो दोस्तों
चलो दोस्तों — ज़बरदस्ती मत करो. Bridge का मतलब सही औज़ार चुनो, Excel फेंको मत.
Why: Not every sheet needs a .pbix. Jumping too early wastes time.
What: Jobs that stay happier in Excel for now.
How:
- Ad-hoc what-if for one person (loan EMI, small forecast).
- Printable forms, invoices, or one-off client templates.
- Heavy cell-by-cell writing with lots of comments for a short audit.
- Class homework under a few thousand rows.
- Rule: if one person owns it and it is small, Excel is fine.
3. Flat sheet vs model (one idea)
Friends,
Think “key columns”, not “paste names everywhere”. That one habit unlocks DAX later.
चला मित्रांनो
सगळीकडे नावे पेस्ट करू नका — key columns ठेवा. हा एक सवय नंतर DAX सोपा करतो.
चलो दोस्तों
हर जगह नाम पेस्ट मत करो — key columns रखो. यही आदत बाद में DAX आसान करती है.
Why: Excel often keeps everything in one tall sheet. Power BI likes facts + dimensions linked by keys.
What: A simple star: Sales fact table + Product and City dimension tables.
How:
- In Excel you might VLOOKUP product name into every sales row.
- In Power BI you keep Product once, relate ProductID, and use RELATED or a visual field list.
- Less copy-paste. Cleaner filters. Faster refresh.
- You already practised this idea in Excel Ch 24 (Power Pivot). Power BI is that idea as the default home.
| Excel | Power BI / DAX | Result | Meaning |
|---|---|---|---|
Excel flatSales sheet with ProductName repeated 40,000 times |
Power BI modelSales[ProductID] → Product[ProductID] |
RELATED name |
Priya’s Pune kirana line shows “Atta 5kg” from the Product table. |
4. Refresh: button vs schedule
Friends,
Refresh is a trust feature. If the number is stale, the dashboard is decoration.
चला मित्रांनो
Refresh म्हणजे विश्वास. नंबर जुना असेल तर dashboard फक्त सजावट आहे.
चलो दोस्तों
Refresh यानी भरोसा. नंबर पुराना हो तो dashboard सिर्फ़ सजावट है.
Why: In Excel, someone must open the file and click Refresh. In Power BI Service you can schedule refresh.
What: Manual refresh vs cloud schedule after publish.
How:
- Excel: Data → Refresh All (or Power Query refresh).
- Power BI Desktop: Home → Refresh while you build.
- Power BI Service (after publish): Dataset → Scheduled refresh → pick times.
- Managers open the app on phone; they do not hunt for the latest xlsx on email.
| Excel | Power BI / DAX | Result | Meaning |
|---|---|---|---|
ExcelData → Refresh All on your laptop |
Power BI ServiceScheduled refresh 08:00 Asia/Calcutta |
Same ₹ total |
Nashik branch + Dubai desk sales ready before standup. |
6. Skills you already have (map)
Friends,
This bridge series walks each mapping with small examples. Next sample chapter: Formulas → DAX.
चला मित्रांनो
या bridge मालिकेत प्रत्येक मॅपिंग लहान उदाहरणांनी येईल. पुढचा नमुना: Formulas → DAX.
चलो दोस्तों
इस bridge सीरीज़ में हर मैपिंग छोटे उदाहरणों से आएगी. अगला सैंपल: Formulas → DAX.
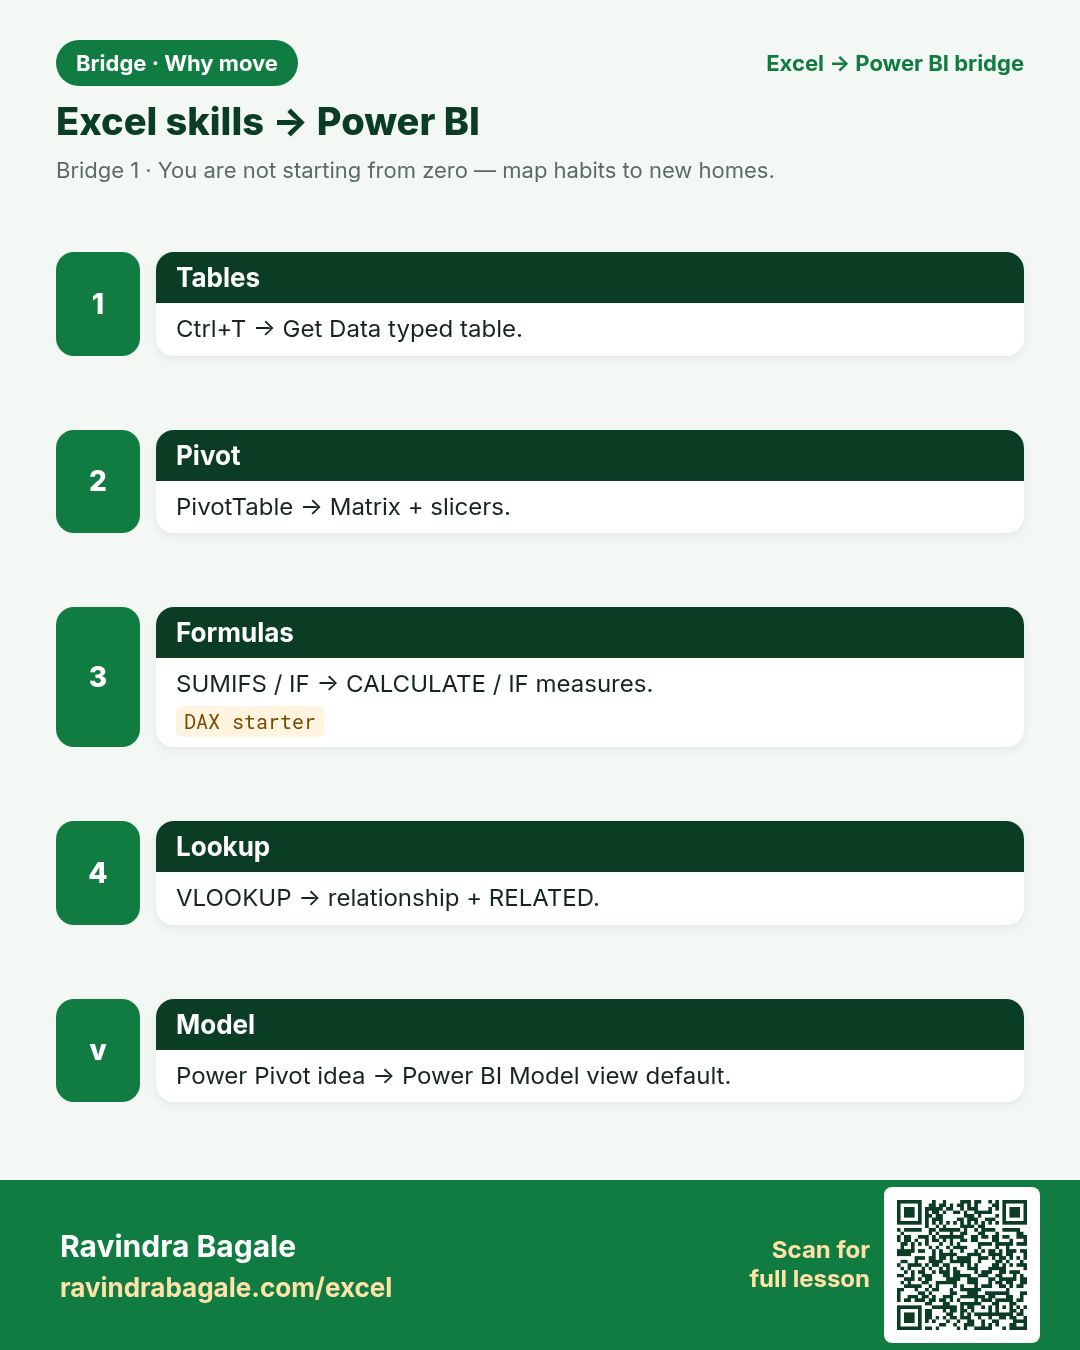
Why: You are not starting from zero. Excel skills map to Power BI parts.
What: A friendly map from Excel habits to Power BI homes.
How:
- Excel Table (Ctrl+T) → Power BI table after Get Data.
- Power Query in Excel → same Power Query in Power BI.
- PivotTable → Matrix visual + slicers.
- SUMIFS / COUNTIFS → CALCULATE measures.
- VLOOKUP to a second sheet → relationship + RELATED.
- Charts → visuals on a report page.
- Power Pivot model → Power BI model view.
You know in Excel
- Tables & structured refs
- PivotTables
- SUMIFS / IF
- Charts
- Power Query / Power Pivot
You will use in Power BI
- Get Data → typed tables
- Matrix + slicers
- DAX measures
- Visuals & cards
- Model view + Service
7. A calm learning path
Friends,
Slow is fast. One honest measure beats twenty copied formulas.
चला मित्रांनो
सावकाश म्हणजे जलद. एक प्रामाणिक measure = वीस कॉपी केलेले formulas.
चलो दोस्तों
धीरे यानी तेज़. एक ईमानदार measure = बीस कॉपी किए formulas.
Why: Trying to learn Desktop + DAX + Service + RLS in one weekend fails.
What: Order that matches this bridge series.
How:
- Keep using Excel for daily work.
- Install Power BI Desktop (free).
- Load one clean Excel table. Make one bar chart. Publish nothing yet.
- Learn relationships before hard DAX.
- Write three measures: Total Sales, Sales this month, Sales for one city.
- Only then schedule refresh and share.
| Excel | Power BI / DAX | Result | Meaning |
|---|---|---|---|
Week 1 habitOpen Desktop, load practice xlsx, one visual |
Week 2 habitTwo tables + one relationship + one CALCULATE |
Progress |
Omar’s Dubai desk demo report without emailing files. |
8. Myths to drop early
Friends,
Drop the myths. Keep curiosity. Bridge chapter by chapter.
चला मित्रांनो
मिथक सोडा. उत्सुकता ठेवा. Chapter chapter bridge करा.
चलो दोस्तों
मिथक छोड़ो. जिज्ञासा रखो. Chapter दर chapter bridge करो.
Why: Fear and marketing slogans block learning.
What: Common myths and short truths.
How:
- Myth: “Power BI deletes Excel.” Truth: Excel stays for analysis and What-If.
- Myth: “I must learn all DAX first.” Truth: load data, relate, then three measures.
- Myth: “Only IT can publish.” Truth: analysts publish to a workspace with rights.
- Myth: “Charts look the same so why move.” Truth: refresh + model + mobile + one truth.
| Excel | Power BI / DAX | Result | Meaning |
|---|---|---|---|
MythPower BI = only for huge companies |
TruthFree Desktop + small team workspace is normal |
Classroom |
Ananya’s Hyderabad IT ticket pack fits a student demo. |
Practice tasks (12)
Use bridge-why-practice.xlsx. LibreOffice-safe: prefer SUMIF / VLOOKUP / IF — avoid XLOOKUP, TEXTJOIN, TEXTSPLIT in checks.
- Open bridge-why-practice.xlsx. Read the About this data sheet. Write in one sentence when this pack should leave pure Excel.
Hint
Look at row counts and the “copies” sheet.
- On Sheet Pain_Signs, mark each row Yes/No: is this a Power BI signal?
Hint
File size, many editors, daily refresh need.
- List three tasks from your job/study that should STAY in Excel.
Hint
Personal what-if, forms, tiny sheets.
- On Flat_vs_Model, circle the key column that should become a relationship.
Hint
ProductID / CityCode — not the repeated name.
- Write the Excel refresh path and the Service schedule idea for Morning_Sales.
Hint
Data → Refresh All vs 08:00 schedule.
- Count how many file copies appear on Copies_Chaos. Propose one report link instead.
Hint
Use COUNTA on the file name column.
- Map five Excel skills to Power BI homes on the Skills_Map sheet (fill column C).
Hint
Pivot→Matrix, SUMIFS→CALCULATE, etc.
- For Priya (Pune) and Emma (Manchester), explain why one model beats two emailed files.
Hint
Currency can differ; truth should not.
- Draft a 4-week learning plan in Plan_Weeks (one goal per week).
Hint
Desktop → relate → 3 measures → share.
- Strike out two myths on Myths sheet and rewrite the truth in column C.
Hint
Use the chapter myth list.
- Using SUMIF on Sales_Tiny, total ₹ sales for Pune only (LibreOffice-safe).
Hint
=SUMIF(City,"Pune",Amount)
- Write one question you will ask before building any .pbix for a bank desk.
Hint
Who owns refresh? Who may see rows?
Quick quiz
Q1. Power BI means you must stop using Excel forever.
Q2. Best early signal to move reporting toward Power BI?
Q3. Flat sheet repeating ProductName 40,000 times should become…
Q4. Scheduled refresh lives mainly in…
Q5. Excel PivotTable maps closest to which Power BI idea?
Q6. SUMIFS habit in Excel becomes which DAX family?
Q7. Analyze in Excel is useful when…
Q8. Calm first week goal?
Loading practice tasks...
- Rows in the fact table (Easy): How many orders are in the Sales table?
- Total amount (Easy): Add up the Amount column of Sales.
- Total quantity (Easy): Add up the Qty column of Sales.
- Products in the dimension (Easy): How many products are in the Products table?
- Products actually sold (Medium): How many of the 5 Product IDs (P01 to P05) appear at least once in Sales?
- Amount for one city (Medium): Add up Amount where City is "London".
- Product name through the relationship (Medium): What is the Product name for Product ID "P03"?
- Sales of one product (Medium): Add up Amount where Product ID is "P03".
- Average order amount (Medium): Find the average Amount, rounded to 0 decimals.
- Category of the first order (Hard): Find the Category of the product in the first order.
- Biggest order in London (Hard): What is the largest Amount where City is "London"?
- Share of P03 (Hard): What share of the total Amount comes from Product ID "P03"? Round to 3 decimals.
Quick revision cards (3)
Approved Excel card style: standalone, no tip/photo section, QR to this lesson.