Excel → Power BI Bridge
Bridge 2. Excel Tables → Power BI tables
Friends,
Friends, today Excel Tables meet Power BI tables. Name them. Type them. Get Data is the door — not a mystery.
चला मित्रांनो
चला मित्रांनो, आज Excel Tables Power BI tables भेटतात. नाव द्या. Type सेट करा. Get Data ही दार आहे.
चलो दोस्तों
चलो दोस्तों, आज Excel Tables Power BI tables से मिलते हैं. नाम दो. Type सेट करो. Get Data दरवाज़ा है.
At deploy, files go to s3://ravindrabagale-cards/excel/bridge/ .
What you will learn
- Turn a range into a named Excel Table.
- Load with Get Data and set types.
- Keep codes as Text and amounts as Decimal.
- Avoid loading totals rows into the model.
A short story
Priya’s Pune sales still live in a plain range. Desktop needs a named table, typed Amount, and no total row hiding in the data.
Ravindra Bagale’s Tip
Name tables and columns before Desktop. Pretty titles can wait for the visual.
Ravindra Bagale’s Tip – मराठी
Desktop आधी tables व columns ला नाव द्या. सुंदर titles नंतर visuals वर.
Ravindra Bagale’s Tip – हिंदी
Desktop से पहले tables और columns का नाम दो. सुंदर titles बाद में visuals पर.
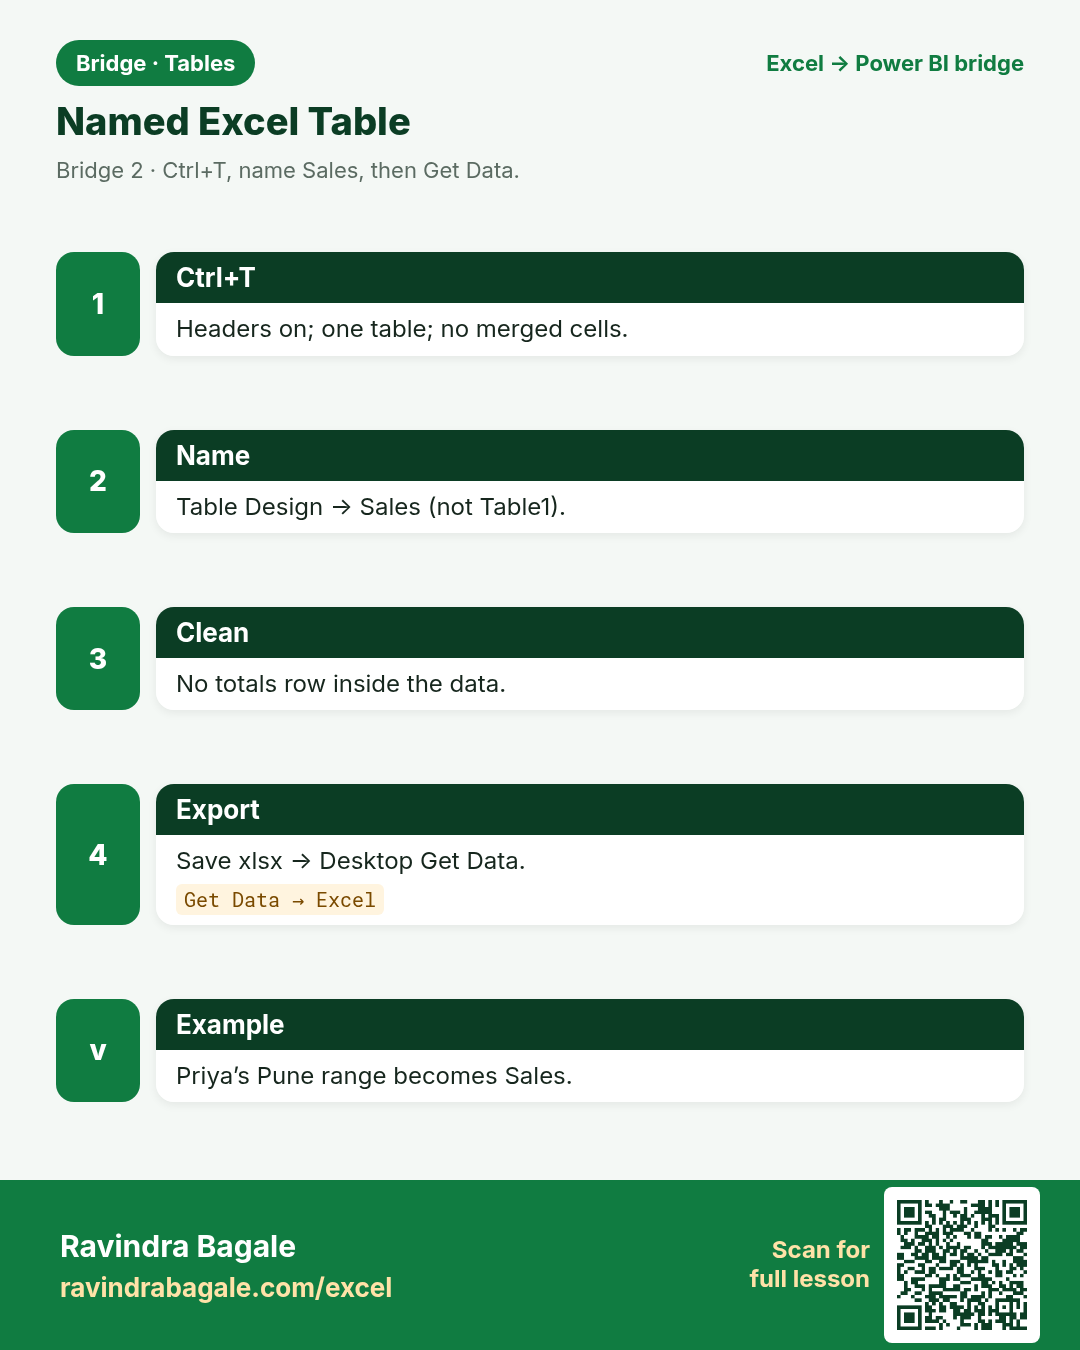
1. Excel Table (Ctrl+T) habit
Friends,
Friends, name the table before you export. Orphans named Table1 confuse the model.
चला मित्रांनो
मित्रांनो, export आधी table ला नाव द्या. Table1 मुळे model गोंधळतो.
चलो दोस्तों
दोस्तों, export से पहले table का नाम दो. Table1 से model उलझता है.
Why: Structured refs and auto-expand keep Excel clean.
What: An Excel Table with a name like Sales.
How:
- Select data → Ctrl+T → my table has headers.
- Name it on Table Design (e.g. Sales).
- Use SUM on the Amount column (structured ref in Excel).
- Keep one header row; no merged cells.
| Excel | Power BI / DAX | Result | Meaning |
|---|---|---|---|
ExcelCtrl+T → name Sales |
Power BIGet Data → pick Sales table |
Sales |
Priya’s Pune pack loads as a typed table. |
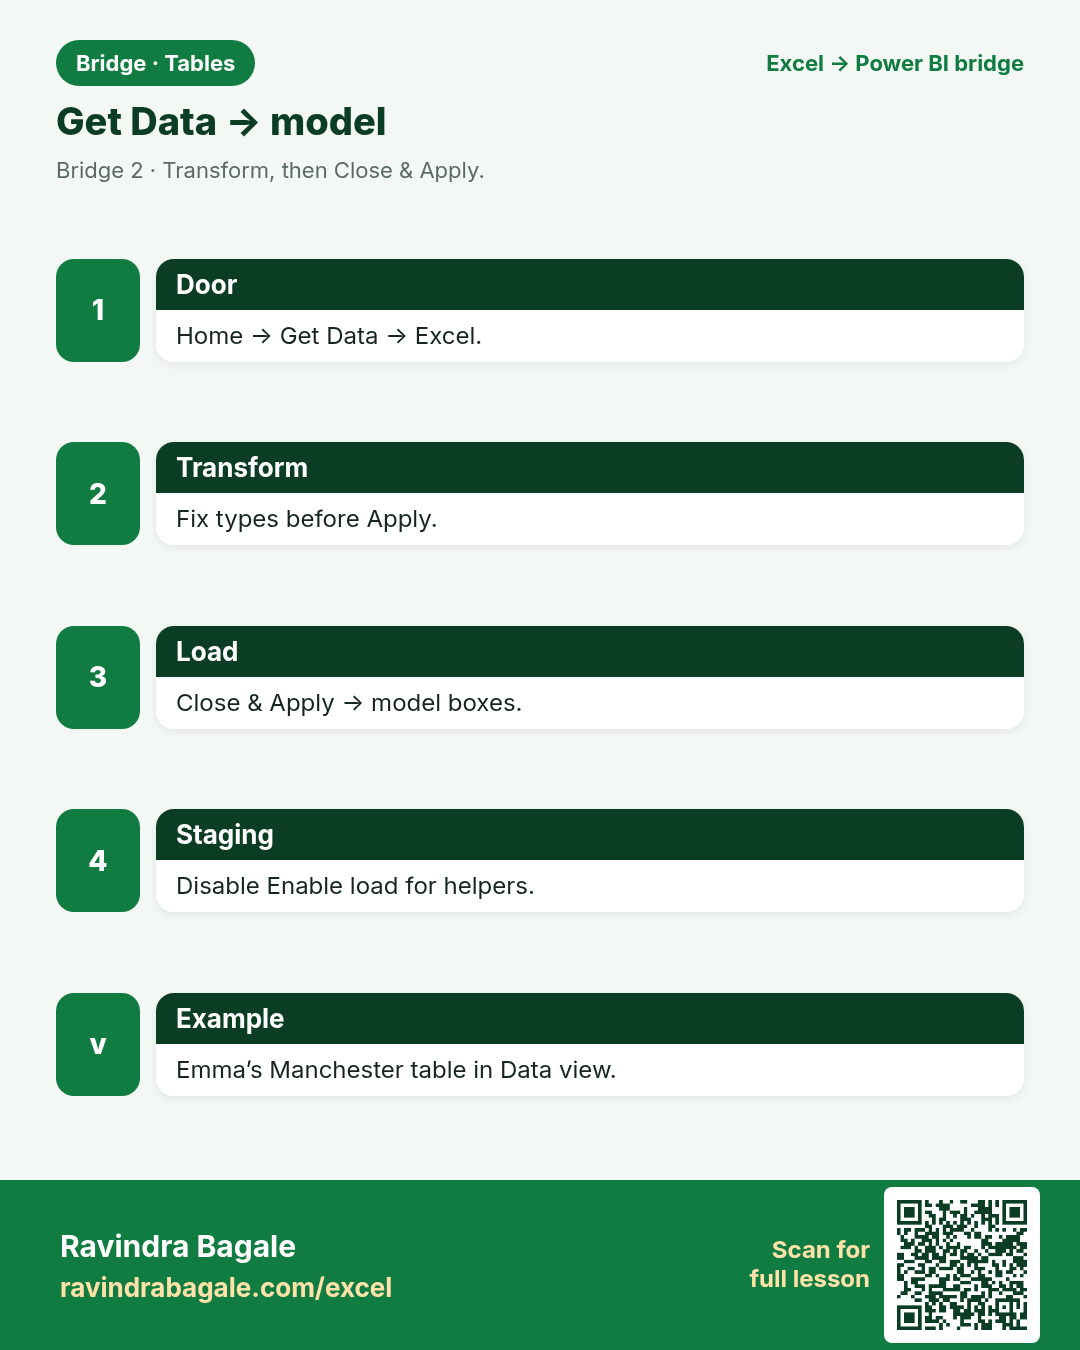
2. Get Data into Power BI
Friends,
Transform before Apply when dates or amounts look like text.
चला मित्रांनो
Apply आधी Transform — dates/amounts text वाटत असतील तर.
चलो दोस्तों
Apply से पहले Transform — dates/amounts text लगें तो.
Why: Desktop does not live inside your xlsx — you load from it.
What: Home → Get Data → Excel workbook.
How:
- Home → Get Data → Excel.
- Pick the file. Tick the table or sheet.
- Transform Data if types look wrong.
- Close & Apply to load into the model.
| Excel | Power BI / DAX | Result | Meaning |
|---|---|---|---|
ExcelOpen the .xlsx and work inside |
Power BIGet Data → Transform → Close & Apply |
Loaded |
Emma’s Manchester shop table appears in Data view. |
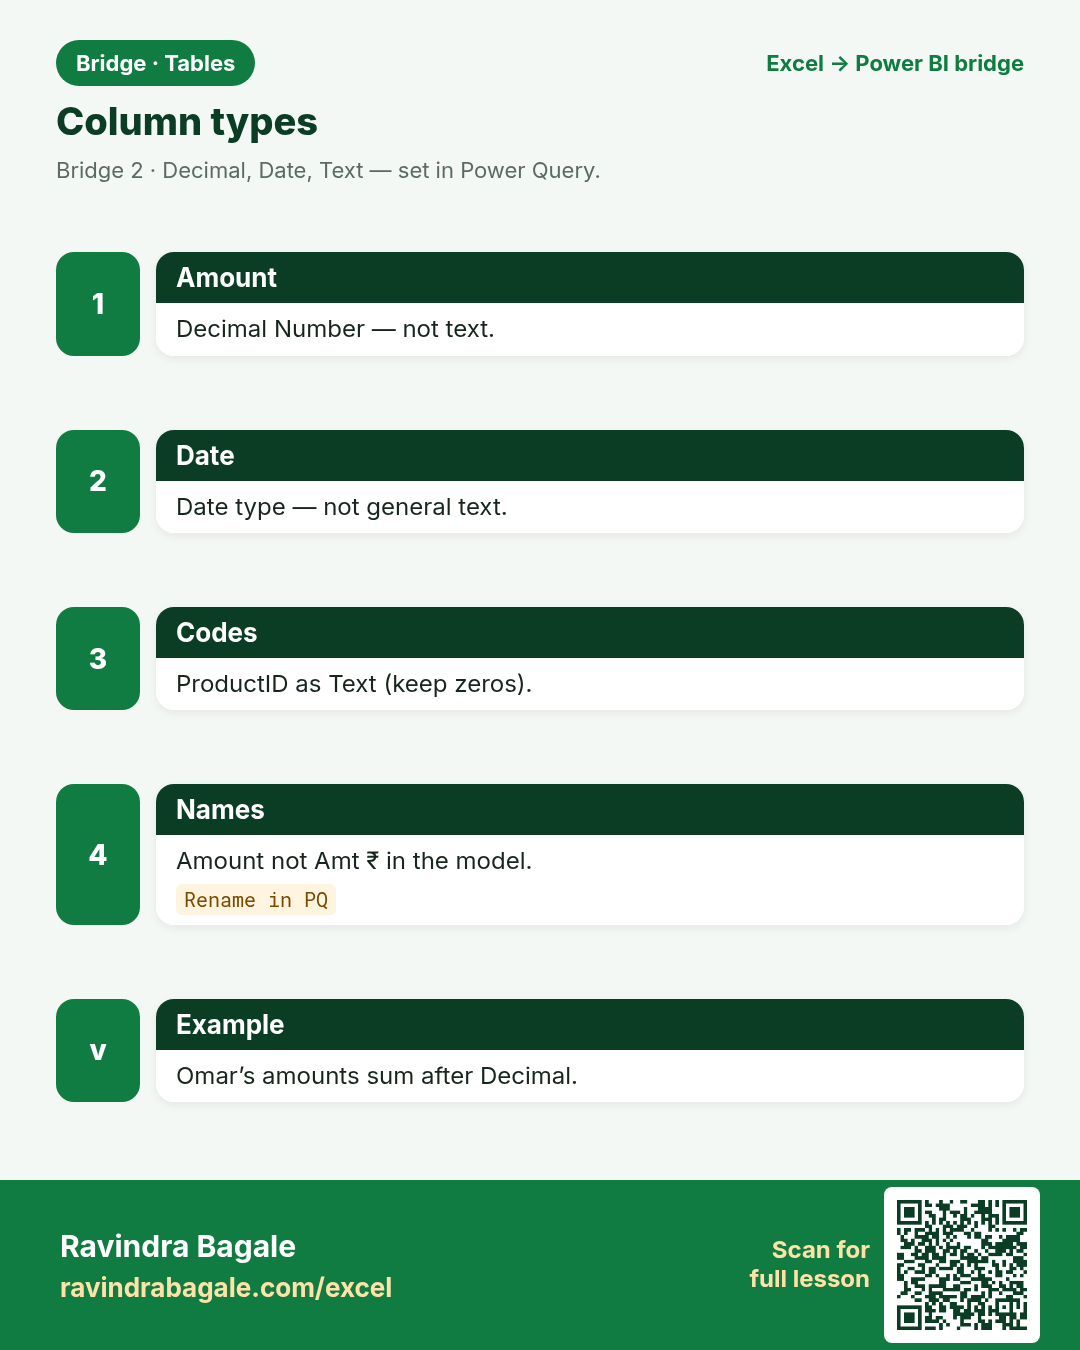
3. Column types matter more
Friends,
ProductID as Whole Number can drop leading zeros. Prefer Text for codes.
चला मित्रांनो
ProductID साठी Text ठेवा — leading zeros टिकतील.
चलो दोस्तों
ProductID के लिए Text रखो — leading zeros बचेंगे.
Why: Wrong types break relationships and visuals.
What: Decimal, Date, Text — set them once.
How:
- In Power Query, check each column type icon.
- Amount → Decimal Number; OrderDate → Date.
- City → Text; ProductID → Text (even if digits).
- Apply — Model view now trusts the types.
| Excel | Power BI / DAX | Result | Meaning |
|---|---|---|---|
ExcelFormat Cells (often cosmetic) |
Power BI / PQData Type on the column |
Typed |
Omar’s amounts sum correctly as Decimal. |
4. Table and column names
Friends,
Pretty labels on visuals. Clean names in the model.
चला मित्रांनो
सुंदर labels visuals वर. स्वच्छ नावे model मध्ये.
चलो दोस्तों
सुंदर labels visuals पर. साफ़ नाम model में.
Why: Spaces and weird names hurt DAX later.
What: Clean names: Sales[Amount] not Sales[Amt ₹].
How:
- Rename columns in Power Query.
- Avoid currency symbols in column names.
- Keep one language for column names in the model.
- Pretty labels belong on visuals.
| Excel | Power BI / DAX | Result | Meaning |
|---|---|---|---|
ExcelHeader Amt ₹ works on sheets |
Power BIRename to Amount |
Amount |
Chen Wei’s pack stays easy to write in DAX. |
5. Load to model vs sheet only
Friends,
Staging queries: uncheck Enable load so they clean but do not clutter the model.
चला मित्रांनो
Staging: Enable load बंद — model स्वच्छ राहील.
चलो दोस्तों
Staging: Enable load बंद — model साफ़ रहेगा.
Why: Excel often dumps to a sheet. Power BI loads to the model by default.
What: Close & Apply puts tables in Model view.
How:
- Prefer load to model for reporting.
- Disable load only for staging queries.
- Check Model view: tables appear as boxes.
- Relate keys in a later chapter.
| Excel | Power BI / DAX | Result | Meaning |
|---|---|---|---|
ExcelClose & Load to sheet |
Power BIClose & Apply → model |
In model |
Ananya’s ticket table ready for relationships. |
6. Same file, weekly refresh
Friends,
Stable paths beat heroic broken-source hunts every Monday.
चला मित्रांनो
स्थिर path = सोमवारी कमी गोंधळ.
चलो दोस्तों
स्थिर path = सोमवार कम गड़बड़.
Why: Point once; refresh later.
What: Keep the workbook path stable for class demos.
How:
- Save practice files in a fixed folder.
- Data source settings if the path moves.
- Home → Refresh after the CSV updates.
- Service schedule comes later.
| Excel | Power BI / DAX | Result | Meaning |
|---|---|---|---|
ExcelData → Refresh All |
Power BI DesktopHome → Refresh |
Fresh rows |
Sofia’s Berlin lane file updates the same table name. |
7. One flat mega-table trap
Friends,
Clean tables first. Relationships second. Fancy DAX third.
चला मित्रांनो
आधी स्वच्छ tables. मग relationships. नंतर DAX.
चलो दोस्तों
पहले साफ़ tables. फिर relationships. फिर DAX.
Why: Loading one huge flat sheet works until it hurts.
What: Prefer fact + dimension when keys exist.
How:
- If ProductName repeats on every sales row, plan a Product table.
- Keep ProductID on the fact.
- Load both; relate later.
- This chapter stops at clean tables.
| Excel | Power BI / DAX | Result | Meaning |
|---|---|---|---|
ExcelOne sheet AllData |
Power BISales + Product tables |
Ready to relate |
Neha’s clinic lines share ProductID with a master. |
8. Classroom checklist before Desktop
Friends,
If Transform looks scary, fix the Excel Table first — often faster.
चला मित्रांनो
Transform भीती वाटली तर आधी Excel Table दुरुस्त करा.
चलो दोस्तों
Transform डर लगे तो पहले Excel Table ठीक करो.
Why: A two-minute pass saves an hour.
What: Headers, types, names, one sheet per table.
How:
- Headers in row 1 only.
- No totals row mixed into data.
- No blank table name.
- Currency note on About sheet.
- Save .xlsx; then Get Data.
| Excel | Power BI / DAX | Result | Meaning |
|---|---|---|---|
Excel prepAbout + clean Table |
Power BIGet Data succeeds first try |
Green |
Amit’s Nashik desk file opens without Transform panic. |
Practice tasks (12)
Use bridge-tables-practice.xlsx. LibreOffice-safe: prefer SUMIF / VLOOKUP / IF — avoid XLOOKUP, TEXTJOIN, TEXTSPLIT.
- Open the practice xlsx. Read About this data.
Hint
First sheet.
- On Raw_Range, create an Excel Table named Sales (Ctrl+T).
Hint
Include headers; exclude TOTAL row.
- Rename Amt_INR header to Amount.
Hint
Clean name.
- Write =SUM(D2:D7) for Amount (LibreOffice-safe).
Hint
Or structured ref in Excel.
- Flag blank OrderID with =IF(A2="","MISSING","ok").
Hint
Helper column.
- List three column types you would set in Power Query.
Hint
Date / Decimal / Text.
- Explain why ProductID should be Text even if digits.
Hint
Leading zeros / codes.
- On Types_Guess, fill Your guess for each row.
Hint
Match Intended where you agree.
- Write the Get Data click path in Notes.
Hint
Home → Get Data → Excel.
- Separate Currency from Amount on one sample (two columns).
Hint
INR vs 1250.
- Count rows with COUNTA on OrderID (ignore TOTAL).
Hint
No TEXTJOIN.
- Write one risk of loading a sheet that still has a Total row.
Hint
Totals inflate SUM.
Quick quiz
Q1. Ctrl+T creates…
Q2. Best place to set Decimal/Date types before the model?
Q3. ProductID with leading zeros should usually be…
Q4. Close & Apply in Desktop mainly loads into…
Q5. Currency symbols in column names are…
Q6. A totals row inside the data table will…
Q7. Staging query tip:
Q8. Before Get Data, Excel prep should include…
Loading practice tasks...
- Rows in the fact table (Easy): How many orders are in the Sales table?
- Total amount (Easy): Add up the Amount column of Sales.
- Total quantity (Easy): Add up the Qty column of Sales.
- Products in the dimension (Easy): How many products are in the Products table?
- Products actually sold (Medium): How many of the 5 Product IDs (P01 to P05) appear at least once in Sales?
- Amount for one city (Medium): Add up Amount where City is "London".
- Product name through the relationship (Medium): What is the Product name for Product ID "P03"?
- Sales of one product (Medium): Add up Amount where Product ID is "P03".
- Average order amount (Medium): Find the average Amount, rounded to 0 decimals.
- Category of the first order (Hard): Find the Category of the product in the first order.
- Biggest order in London (Hard): What is the largest Amount where City is "London"?
- Share of P03 (Hard): What share of the total Amount comes from Product ID "P03"? Round to 3 decimals.
Quick revision cards (3)
Approved Excel card style: standalone, no tip/photo section, QR to this lesson.