Excel → Power BI Bridge
Bridge 10. Full migration mini-project
Friends,
Friends, final bridge lab: two packs, one model, five measures, one page. Calm steps. Currency rules on About. Ship a checklist, not chaos.
चला मित्रांनो
चला मित्रांनो, शेवटची bridge lab: दोन packs, एक model, पाच measures, एक page. शांत पावले. Currency नियम About वर.
चलो दोस्तों
चलो दोस्तों, आख़िरी bridge lab: दो packs, एक model, पाँच measures, एक page. शांत क़दम. Currency नियम About पर.
At deploy, files go to s3://ravindrabagale-cards/excel/bridge/ .
What you will learn
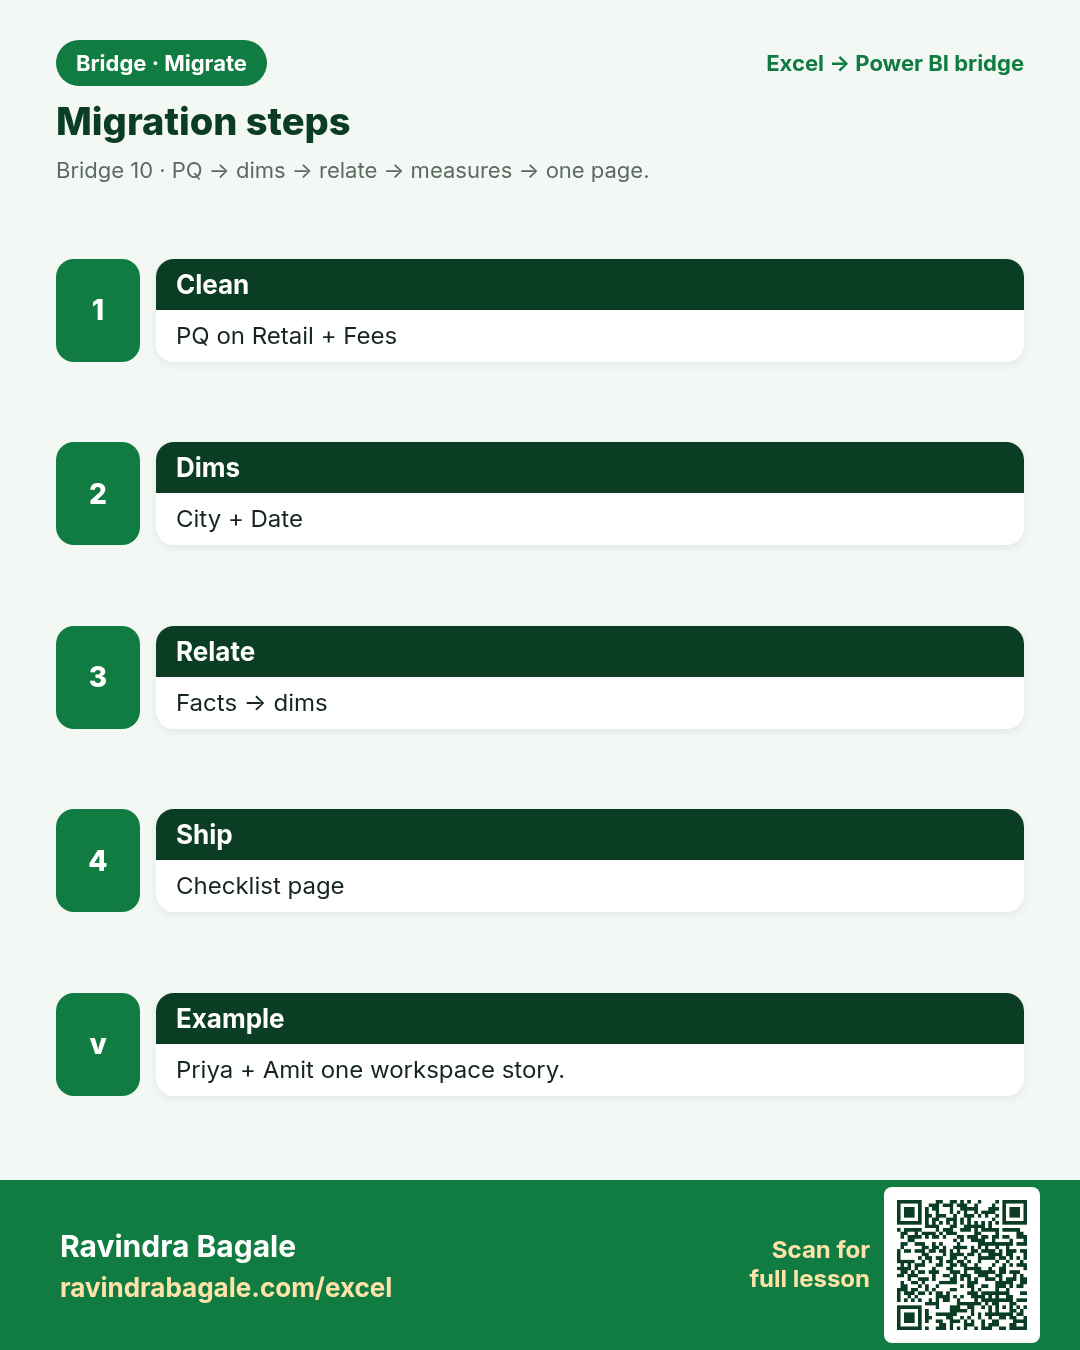
- Clean two facts in Power Query.
- Build City + Date dimensions and relationships.
- Author five starter measures.
- Ship one report page against a checklist.
A short story
Retail orders (Priya/Emma/…) and bank fees (Amit/Omar) must share City and Date dimensions. Clean in PQ, relate, measure, then one page: title, slicers, matrix, card, line.
Ravindra Bagale’s Tip
Finish the checklist before decorating. Working refresh + honest currency beats neon themes.
Ravindra Bagale’s Tip – मराठी
सजावट आधी checklist संपवा. Refresh + प्रामाणिक currency > neon.
Ravindra Bagale’s Tip – हिंदी
सजावट से पहले checklist खत्म करो. Refresh + ईमानदार currency > neon.
1. Two packs, one truth
Friends,
Same City name spelling across packs — fix in PQ.
चला मित्रांनो
समान City spelling — PQ मध्ये दुरुस्त.
चलो दोस्तों
समान City spelling — PQ में ठीक.
Why: Retail + Bank_Fees share cities and dates.
What: Do not keep two emailed Mondays.
How:
- Open Retail and Bank_Fees sheets.
- Note currencies.
- Plan City and Date dims.
- Write the currency rule on About.
| Excel | Power BI / DAX | Result | Meaning |
|---|---|---|---|
ExcelTwo workbooks emailed |
Bridge projectOne model |
Unified |
Priya retail + Amit fees in one workspace story. |
2. Clean in Power Query
Friends,
Two facts can share dimensions — that is normal.
चला मित्रांनो
दोन facts dimensions शेअर करू शकतात.
चलो दोस्तों
दो facts dimensions शेयर कर सकते हैं.
Why: Trim, types, maybe append if shapes match — here keep two facts.
What: Two facts OK in a star.
How:
- Trim City.
- Type Amount Decimal, Date Date.
- Keep Currency as Text.
- Load both facts + dims.
| Excel | Power BI / DAX | Result | Meaning |
|---|---|---|---|
Messy sheetsAd hoc fixes |
PQApplied Steps |
Clean |
Emma’s Manchester city spelling normalised. |
3. Build dimensions
Friends,
Shared dimensions are how packs become one story.
चला मित्रांनो
Shared dims = एक गोष्ट.
चलो दोस्तों
Shared dims = एक कहानी.
Why: City from distinct cities; Date calendar.
What: Dim_City, Dim_Date.
How:
- Build Dim_City (City, Region).
- Build or load Dim_Date.
- Relate both facts to both dims (as keys allow).
- Hide keys.
| Excel | Power BI / DAX | Result | Meaning |
|---|---|---|---|
VLOOKUP sprawlRepeated cities |
ModelShared dims |
Star |
Omar and Priya both filter Pune/Dubai via Dim_City. |
4. Five measures
Friends,
Separate measures per fact beat one confused mega-SUM across currencies.
चला मित्रांनो
Fact-नुसार measures — मिश्र currency mega-SUM नको.
चलो दोस्तों
Fact-नुसार measures — मिश्र currency mega-SUM नहीं.
Why: Starter kit for the page.
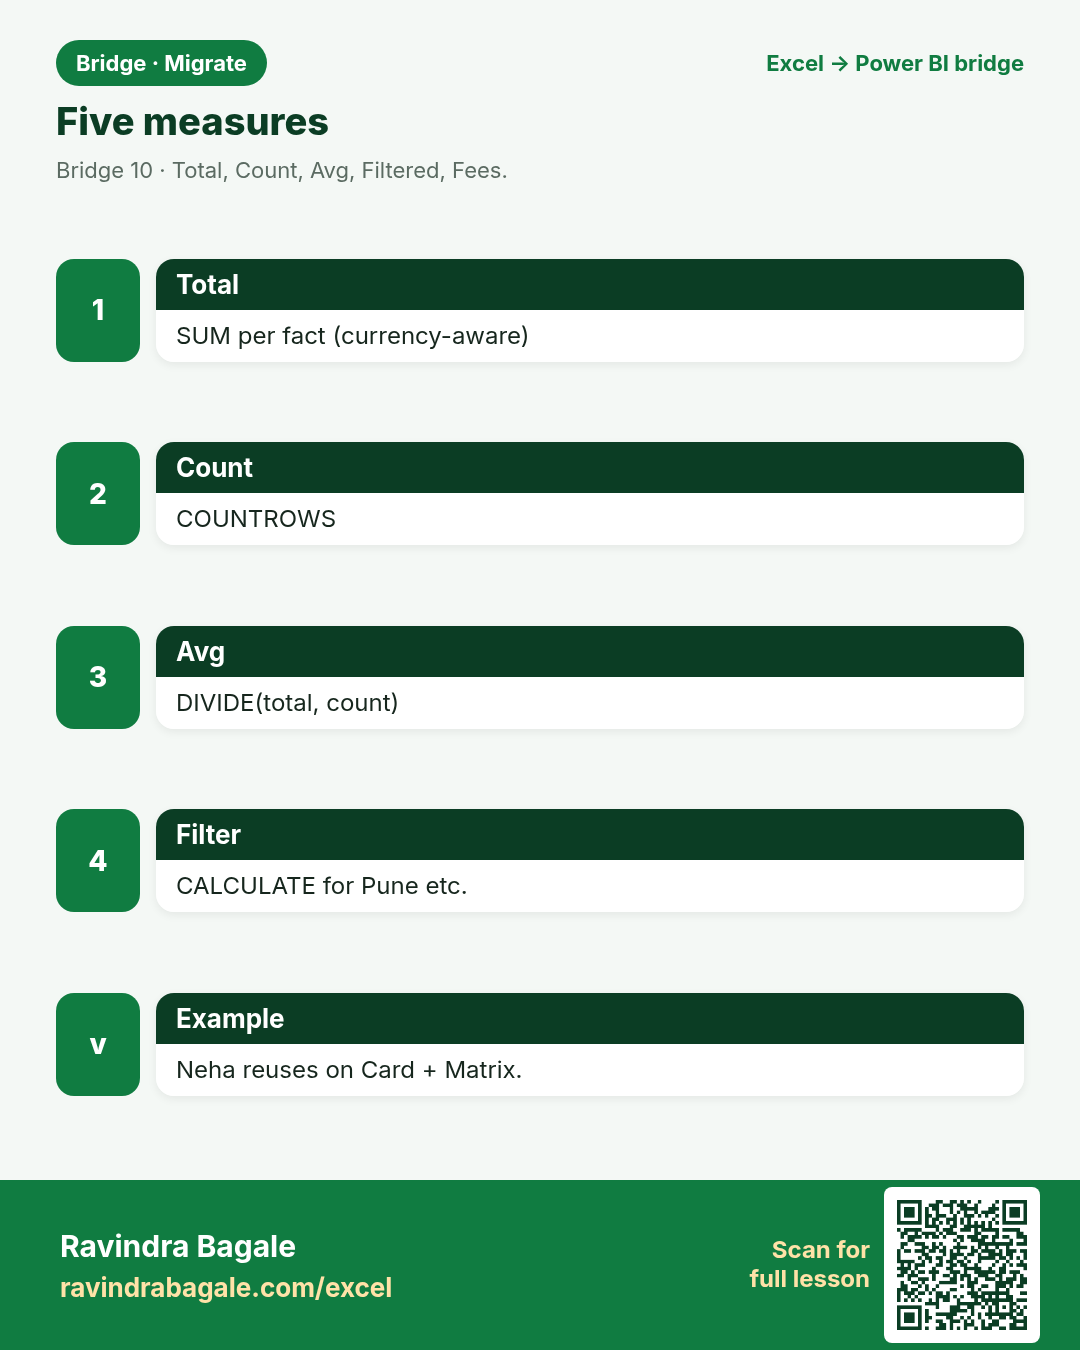
What: Total, Count, Average, Filtered, DIVIDE.
How:
- Total Amount := SUM(... ) — careful per fact or separate measures.
- Retail Orders := COUNTROWS(Retail).
- Avg Retail := DIVIDE([Total Retail],[Retail Orders]).
- Pune Retail := CALCULATE(... City="Pune").
- Fee Total := SUM(Bank_Fees[FeeAmount]) with currency filter discipline.
| Excel | Power BI / DAX | Result | Meaning |
|---|---|---|---|
ExcelMany SUMIFs |
DAXFive measures |
Kit |
Neha reuses measures on Card + Matrix. |
5. One report page
Friends,
If the page needs a novel of footnotes, simplify measures first.
चला मित्रांनो
फूटनोट्सची कादंबरी लागली तर आधी measures सोपे करा.
चलो दोस्तों
फ़ुटनोट्स का उपन्यास लगे तो पहले measures सरल करो.
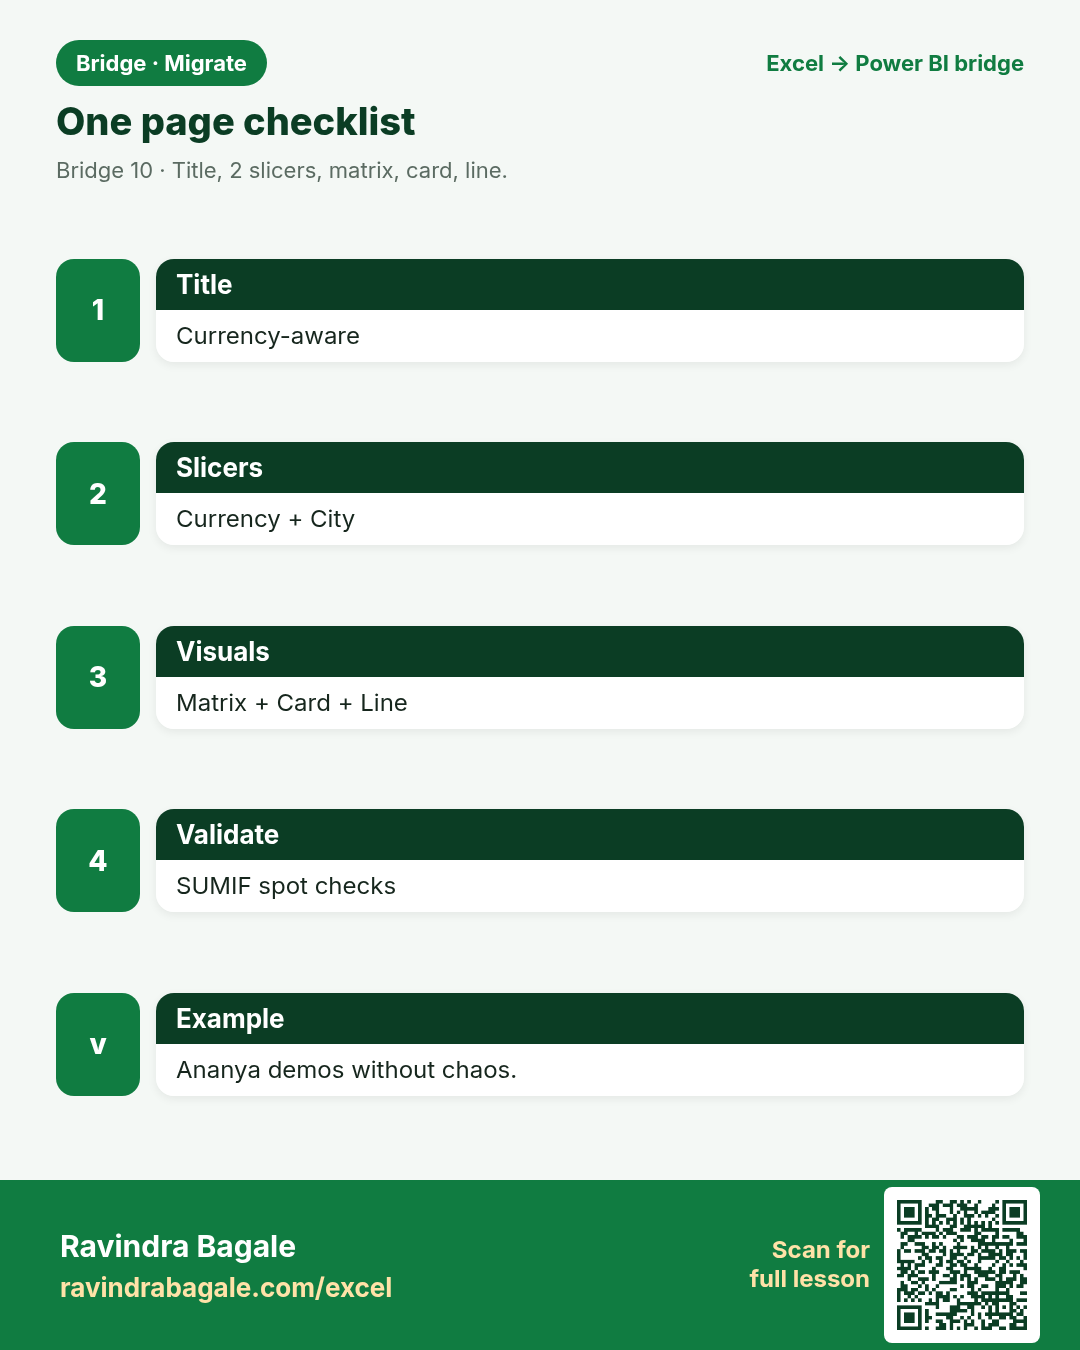
Why: Title, 2 slicers, matrix, card, line.
What: Checklist driven.
How:
- Title: Retail & Fees — currency aware.
- Slicers: Currency, City.
- Matrix: City × (Retail total / Fees) carefully.
- Card: Total Retail (filtered).
- Line: Retail by Date.
| Excel | Power BI / DAX | Result | Meaning |
|---|---|---|---|
Excel dashboardMany sheets |
Power BIOne page |
Shipped |
Ananya demos without scrolling chaos. |
6. Currency rule on the wall
Friends,
A subtitle that names the currency saves reputations.
चला मित्रांनो
Currency सांगणारे subtitle = प्रतिष्ठा वाचते.
चलो दोस्तों
Currency बताने वाला subtitle = इज़्ज़त बचाता है.
Why: Write it where students see it.
What: About + page subtitle.
How:
- Never sum INR+GBP+AED in one Card.
- Default slicer to one currency in demos.
- Optional FX table later — out of scope here.
- Fail the review if mixed sum appears.
| Excel | Power BI / DAX | Result | Meaning |
|---|---|---|---|
Silent mixLie chart |
BridgeExplicit rule |
Honest |
Chen Wei’s subtitle states “INR selected”. |
7. Validate against Excel
Friends,
If Excel and Card disagree, believe neither until you find the filter.
चला मित्रांनो
मतभेद = आधी filter शोधा.
चलो दोस्तों
मतभेद = पहले filter ढूँढो.
Why: Spot-check three numbers.
What: SUMIF in Excel vs Card.
How:
- SUMIF Retail Pune INR vs Card.
- Count Manchester retail rows.
- Fee total Dubai AED.
- Document match in Project_Plan.
| Excel | Power BI / DAX | Result | Meaning |
|---|---|---|---|
Excel checkSUMIF/COUNTIF |
PBI CardSame filter |
Match |
Sofia ticks validation rows. |
8. Handoff notes
Friends,
A finished checklist is the real deliverable.
चला मित्रांनो
पूर्ण checklist = खरे deliverable.
चलो दोस्तों
पूरी checklist = असली deliverable.
Why: Owner, refresh, audience.
What: Project_Plan last rows.
How:
- Name refresh owner.
- Cadence.
- Who may edit vs view.
- Link to workspace (at deploy).
- Celebrate a calm ship.
| Excel | Power BI / DAX | Result | Meaning |
|---|---|---|---|
Hero pasteUndocumented |
BridgeHandoff notes |
Sustainable |
Amit can go on leave without panic. |
Practice tasks (12)
Use bridge-migrate-practice.xlsx. LibreOffice-safe: prefer SUMIF / VLOOKUP / IF — avoid XLOOKUP, TEXTJOIN, TEXTSPLIT.
- Read About + Project_Plan.
Hint
Scope.
- SUM Retail Amount with SUM.
Hint
Baseline.
- SUMIF Retail City Pune.
Hint
Validate later.
- COUNTIF Bank_Fees City Dubai.
Hint
Fees count.
- List PQ steps for both facts.
Hint
Notes.
- Draft Dim_City rows you need.
Hint
Distinct cities.
- Write five measure formulas in Notes.
Hint
Starter kit.
- Sketch the one page layout.
Hint
Title/slicers/matrix/card/line.
- Write the currency rule in one sentence.
Hint
About.
- Mark Project_Plan Done? as you pretend to finish.
Hint
Checklist.
- VLOOKUP a Region onto a city list (LibreOffice).
Hint
Dim idea.
- Handoff: owner + cadence + audience.
Hint
Notes.
Quick quiz
Q1. This mini-project ends with…
Q2. Retail and fees should share…
Q3. Cleaning belongs mainly in…
Q4. Five measures beat…
Q5. Mixed currency Card is…
Q6. Validate PBI numbers with…
Q7. Handoff must name…
Q8. Two facts in one star model are…
Loading practice tasks...
- Rows in the fact table (Easy): How many orders are in the Sales table?
- Total amount (Easy): Add up the Amount column of Sales.
- Total quantity (Easy): Add up the Qty column of Sales.
- Products in the dimension (Easy): How many products are in the Products table?
- Products actually sold (Medium): How many of the 5 Product IDs (P01 to P05) appear at least once in Sales?
- Amount for one city (Medium): Add up Amount where City is "London".
- Product name through the relationship (Medium): What is the Product name for Product ID "P03"?
- Sales of one product (Medium): Add up Amount where Product ID is "P03".
- Average order amount (Medium): Find the average Amount, rounded to 0 decimals.
- Category of the first order (Hard): Find the Category of the product in the first order.
- Biggest order in London (Hard): What is the largest Amount where City is "London"?
- Share of P03 (Hard): What share of the total Amount comes from Product ID "P03"? Round to 3 decimals.
Quick revision cards (3)
Approved Excel card style: standalone, no tip/photo section, QR to this lesson.