Excel → Power BI Bridge
Bridge 6. Excel charts → Power BI visuals
Friends,
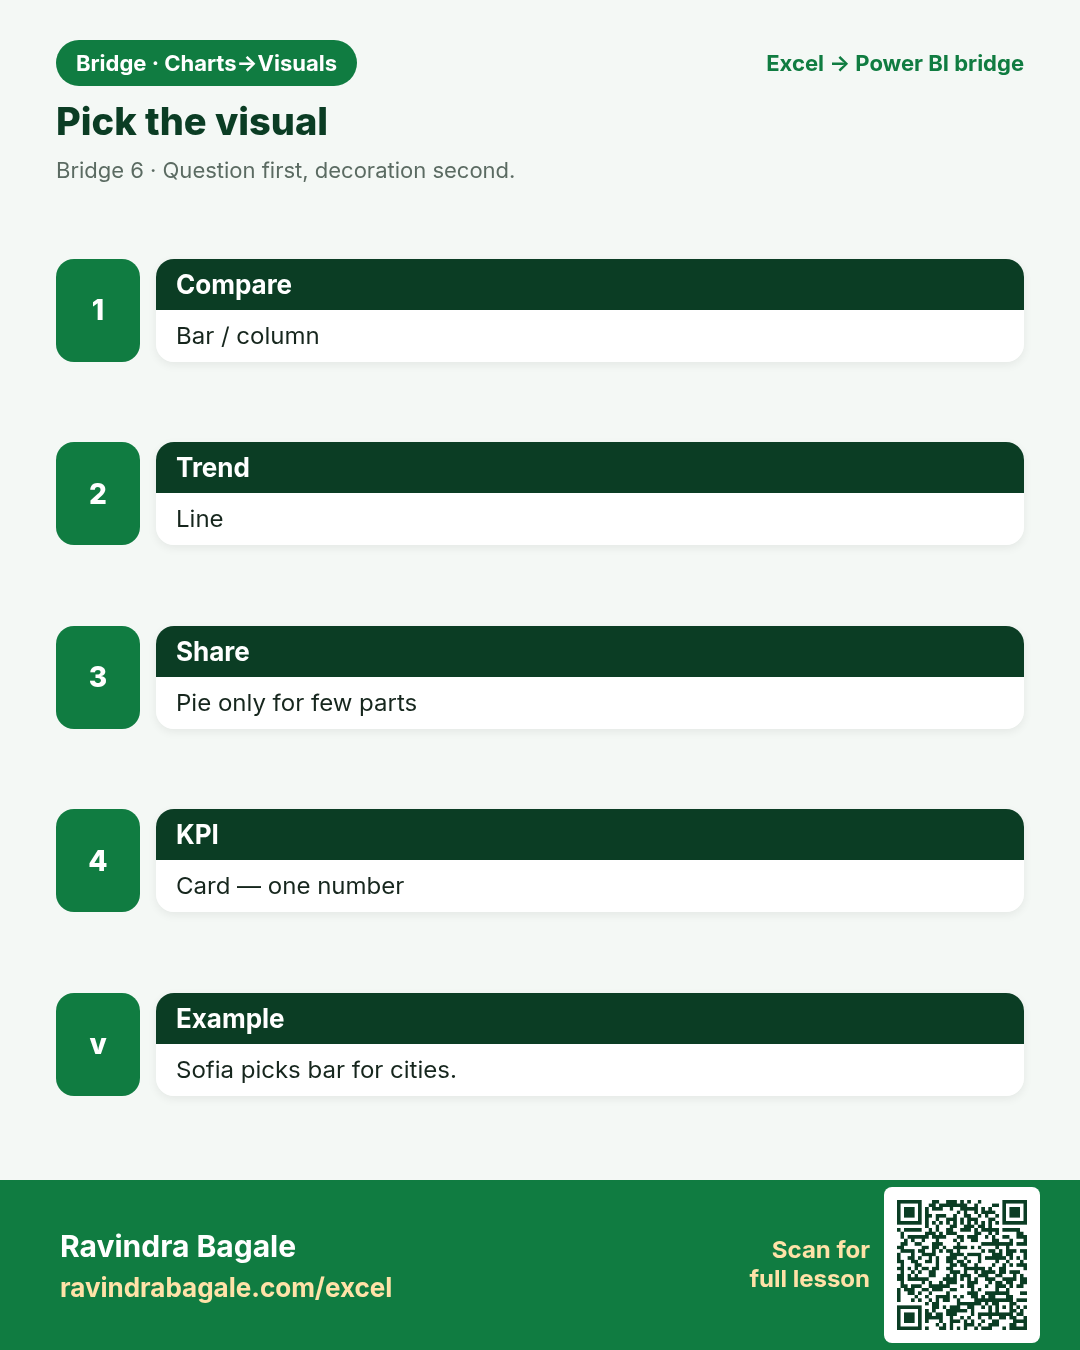
Friends, charts become visuals. Same questions: compare, trend, share, KPI. Pick the visual that answers — not the prettiest clip art.
चला मित्रांनो
चला मित्रांनो, charts visuals होतात. तुलना, trend, share, KPI. प्रश्नाला उत्तर देणारा visual निवडा.
चलो दोस्तों
चलो दोस्तों, charts visuals बनते हैं. तुलना, trend, share, KPI. सवाल का जवाब देने वाला visual चुनो.
At deploy, files go to s3://ravindrabagale-cards/excel/bridge/ .
What you will learn
- Map Excel chart types to Power BI visuals.
- Choose Card/KPI when one number matters.
- Keep mixed currencies off one axis.
- Title visuals with the question they answer.
A short story
Priya wants this month’s total in a big number; Emma wants six months of Manchester trend; Amit wants cities side by side. Three questions — Card, Line, Column — not three pies.
Ravindra Bagale’s Tip
One KPI → Card. Trend → Line. Compare categories → Bar/Column. Pie only for few parts.
Ravindra Bagale’s Tip – मराठी
एक KPI → Card. Trend → Line. तुलना → Bar/Column. Pie फक्त थोड्या भागांसाठी.
Ravindra Bagale’s Tip – हिंदी
एक KPI → Card. Trend → Line. तुलना → Bar/Column. Pie सिर्फ कम हिस्सों के लिए.
1. Chart type → visual type
Friends,
If you need a legend of 20 slices, you need a bar — not a pie.
चला मित्रांनो
20 slices = bar. Pie नाही.
चलो दोस्तों
20 slices = bar. Pie नहीं.
Why: Muscle memory transfers.
What: Column/bar, line, pie → visuals pane.
How:
- Insert a Clustered column for City vs Amount (one currency).
- Insert a Line for Month trend.
- Avoid pie for many cities.
- Name the visual with a question title.
| Excel | Power BI / DAX | Result | Meaning |
|---|---|---|---|
ExcelInsert Column/Line/Pie |
Power BIVisuals pane |
Mapped |
Sofia compares Berlin logistics bars. |
2. When a Card beats a chart
Friends,
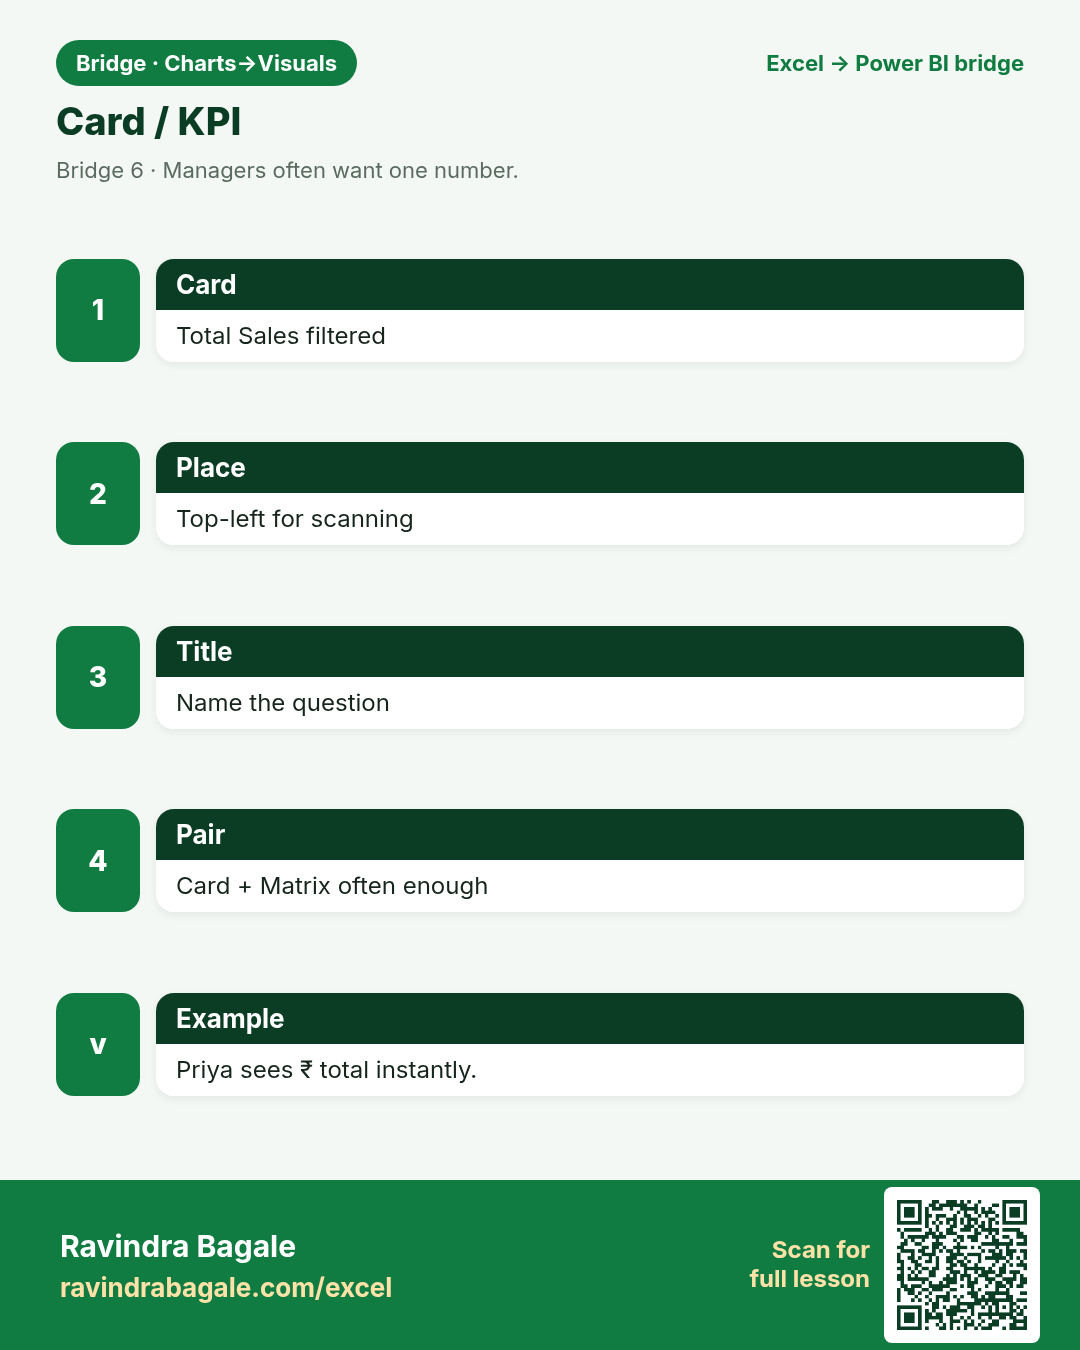
Cards answer “what is the number?” Charts answer “compared to what?”
चला मित्रांनो
Card = संख्या. Chart = तुलना.
चलो दोस्तों
Card = संख्या. Chart = तुलना.
Why: Managers often want one number.
What: Card / KPI visual.
How:
- Add a Card with Total Sales (filtered).
- Optional KPI with target if you have one.
- Place Card top-left for scanning.
- Do not bury the KPI inside a busy chart.
| Excel | Power BI / DAX | Result | Meaning |
|---|---|---|---|
ExcelBig number in a cell / camera |
Power BICard / KPI |
1250 |
Priya sees today’s ₹ total instantly. |
3. Combo habits
Friends,
Two clean visuals beat one overloaded combo for beginners.
चला मित्रांनो
नवशिक्यांसाठी दोन स्वच्छ visuals चांगले.
चलो दोस्तों
नौसिखियों के लिए दो साफ़ visuals बेहतर.
Why: Line + column in Excel → line + column visuals or combo carefully.
What: Two measures, clear axes.
How:
- Use column for Amount, line for Order Count on a shared axis page.
- Or two visuals synced by slicer — often clearer in class.
- Label both axes.
- Do not mix ₹ and £ on one axis.
| Excel | Power BI / DAX | Result | Meaning |
|---|---|---|---|
ExcelCombo chart |
Power BITwo visuals or combo |
Clear |
Omar shows fees + count together carefully. |
4. Format for reading
Friends,
Title the question: “INR sales by city” — not “Chart1”.
चला मित्रांनो
शीर्षक प्रश्न असावा — Chart1 नको.
चलो दोस्तों
शीर्षक सवाल हो — Chart1 नहीं.
Why: Titles, data labels, declutter.
What: Format pane in Desktop.
How:
- Turn on a meaningful title.
- Use data labels sparingly.
- Sort bars by value when ranking.
- Keep colour-blind safe contrast.
| Excel | Power BI / DAX | Result | Meaning |
|---|---|---|---|
ExcelChart Format |
Power BIFormat visual |
Readable |
Ananya’s Hyderabad class can read labels. |
5. Currency on axes
Friends,
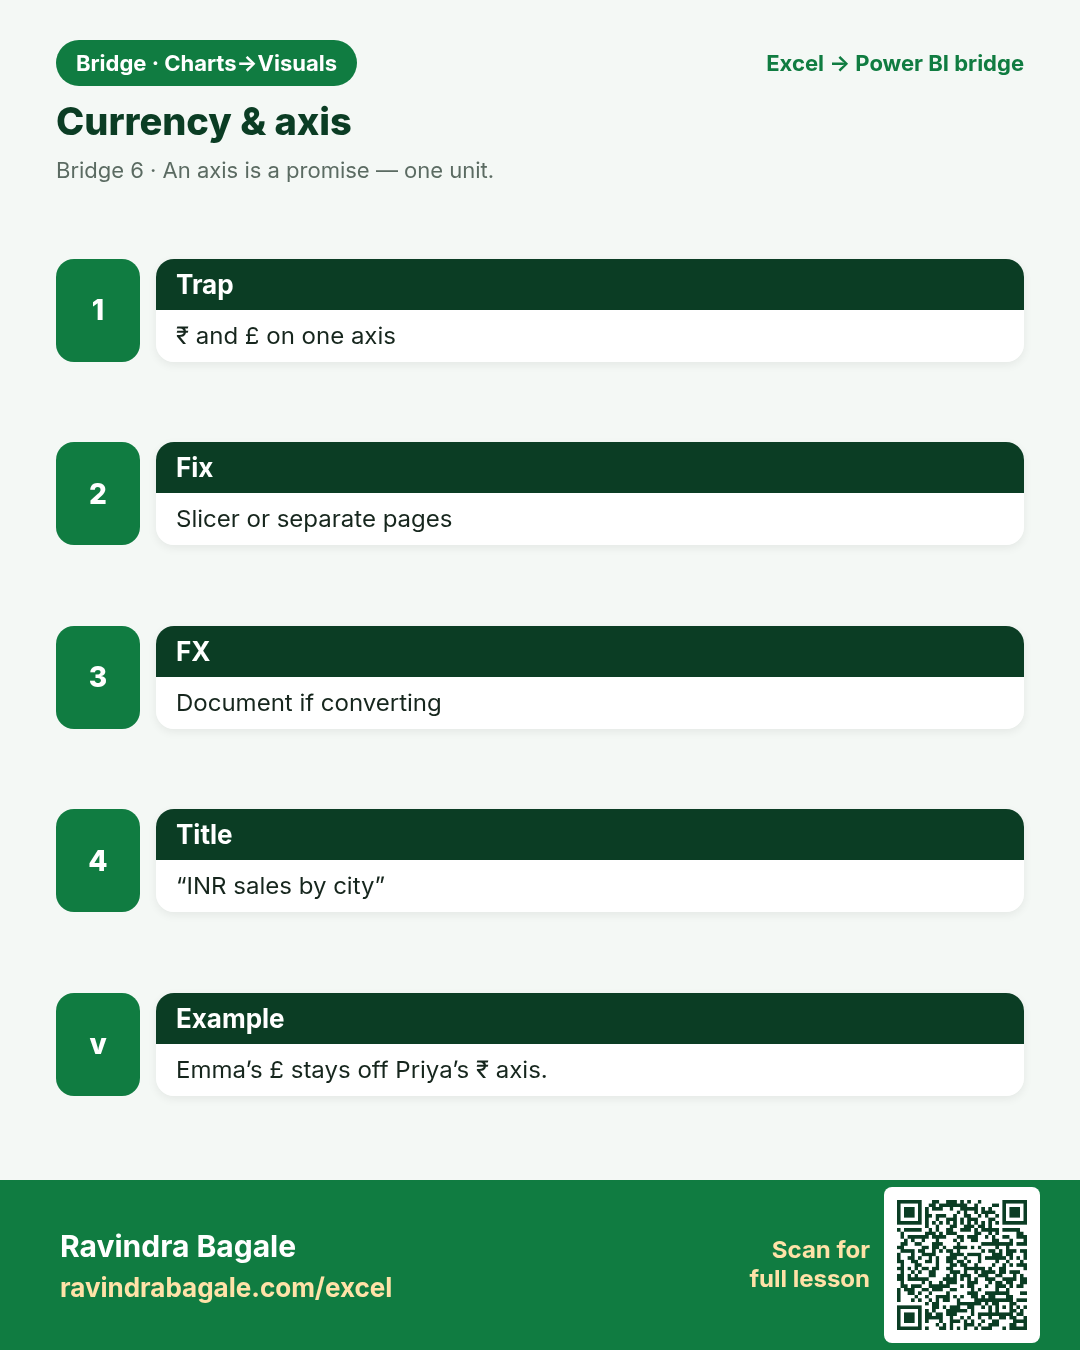
An axis is a promise. Do not break it with mixed units.
चला मित्रांनो
Axis एक वचन आहे — मिश्र units नको.
चलो दोस्तों
Axis एक वादा है — मिश्र units नहीं.
Why: Two currencies on one axis lie.
What: Filter or convert; dual axis rarely helps class.
How:
- Slicer on Currency before the column chart.
- Or separate pages per currency.
- Document FX rule if converting.
- Never “just plot both” silently.
| Excel | Power BI / DAX | Result | Meaning |
|---|---|---|---|
ExcelTwo series trap |
Power BISlicer + one currency measure |
Honest |
Emma’s £ and Priya’s ₹ stay apart. |
6. Pie discipline
Friends,
If you apologise for the pie, delete the pie.
चला मित्रांनो
Pie साठी माफी मागत असाल तर pie काढून टाका.
चलो दोस्तों
Pie के लिए माफी मांग रहे हो तो pie हटा दो.
Why: Few parts, whole = 100%, one currency.
What: Donut OK; 12-slice pie not OK.
How:
- Use pie/donut only for ≤5–6 parts.
- Sort slices; show %.
- Prefer bar for long category lists.
- Ask if a Card + table is clearer.
| Excel | Power BI / DAX | Result | Meaning |
|---|---|---|---|
ExcelPie chart |
Power BIPie/donut visual |
Few parts |
Neha shows 4 clinic categories. |
7. Cross-filter interaction
Friends,
Interaction is a feature — and a footgun if every visual shouts.
चला मित्रांनो
Interaction feature आहे — पण गोंधळही करू शकते.
चलो दोस्तों
Interaction feature है — पर उलझा भी सकती है.
Why: Excel charts are mostly static.
What: Visuals filter each other.
How:
- Click a city bar; watch the Card update.
- Edit interactions if a visual should not filter another.
- Teach one click demo in class.
- Reset filters to clear.
| Excel | Power BI / DAX | Result | Meaning |
|---|---|---|---|
ExcelMostly static |
Power BICross-filter |
Interactive |
Chen Wei clicks Singapore → Card updates. |
8. Still need Excel charts?
Friends,
Images in email age badly. Live visuals age better.
चला मित्रांनो
Email images जुनी होतात. Live visuals टिकतात.
चलो दोस्तों
Email images पुरानी पड़ती हैं. Live visuals टिकते हैं.
Why: Export / Analyze in Excel for power users.
What: Bridge, do not ban.
How:
- Publish the model.
- Analyze in Excel for Pivot charts if needed.
- Keep the truth in the dataset.
- Avoid emailed chart image forks as the system of record.
| Excel | Power BI / DAX | Result | Meaning |
|---|---|---|---|
ExcelLocal chart |
Power BIPublish + optional Analyze |
Hybrid |
Amit pivots in Excel on the same model. |
Practice tasks (12)
Use bridge-charts-practice.xlsx. LibreOffice-safe: prefer SUMIF / VLOOKUP / IF — avoid XLOOKUP, TEXTJOIN, TEXTSPLIT.
- Read About and Choose_Visual sheet.
Hint
Match questions.
- On Trend, make an Excel line chart for Pune_INR.
Hint
One currency.
- Explain why Pune_INR + Manchester_GBP on one axis is wrong.
Hint
Notes.
- Pick visual types for KPI / compare / trend on Choose_Visual.
Hint
Fill Prefer if blank.
- SUM Pune_INR with SUM.
Hint
LibreOffice OK.
- Draft a Card title for this month’s INR total.
Hint
Question style.
- List three Format pane checks before class demo.
Hint
Title, sort, labels.
- Write a pie rule in one sentence.
Hint
≤5–6 parts.
- Describe one cross-filter demo click.
Hint
Bar → Card.
- Propose separate pages vs slicer for currency.
Hint
Your pick + why.
- COUNT months on Trend with COUNTA.
Hint
Quality.
- When keep a local Excel chart?
Hint
Personal scratch.
Quick quiz
Q1. One big KPI number fits…
Q2. Many categories compare best with…
Q3. Mixed ₹ and £ on one axis is…
Q4. Trend over months →
Q5. Visual title should state…
Q6. Pie/donut works when…
Q7. Clicking a bar to filter a Card uses…
Q8. System of record for shared charts should be…
Loading practice tasks...
- Rows in the fact table (Easy): How many orders are in the Sales table?
- Total amount (Easy): Add up the Amount column of Sales.
- Total quantity (Easy): Add up the Qty column of Sales.
- Products in the dimension (Easy): How many products are in the Products table?
- Products actually sold (Medium): How many of the 5 Product IDs (P01 to P05) appear at least once in Sales?
- Amount for one city (Medium): Add up Amount where City is "London".
- Product name through the relationship (Medium): What is the Product name for Product ID "P03"?
- Sales of one product (Medium): Add up Amount where Product ID is "P03".
- Average order amount (Medium): Find the average Amount, rounded to 0 decimals.
- Category of the first order (Hard): Find the Category of the product in the first order.
- Biggest order in London (Hard): What is the largest Amount where City is "London"?
- Share of P03 (Hard): What share of the total Amount comes from Product ID "P03"? Round to 3 decimals.
Quick revision cards (3)
Approved Excel card style: standalone, no tip/photo section, QR to this lesson.