Excel → Power BI Bridge
Bridge 7. Power Pivot / Data Model → Power BI model
Friends,
Friends, if you touched Power Pivot, you already met the model. Desktop makes relationships and measures the main stage.
चला मित्रांनो
चला मित्रांनो, Power Pivot लापलं असेल तर model भेटला आहे. Desktop मध्ये relationships आणि measures मुख्य.
चलो दोस्तों
चलो दोस्तों, Power Pivot छुआ हो तो model मिल चुका. Desktop में relationships और measures मुख्य.
At deploy, files go to s3://ravindrabagale-cards/excel/bridge/ .
What you will learn
- Load fact + dimensions and create relationships.
- Prefer star schema habits.
- Add a Date table idea.
- Keep measures in the model, not only on sheets.
A short story
Sales rows carry ProductID and CityKey. Product and City sit in small tables. Relate once — RELATED and Matrix work without VLOOKUP columns everywhere.
Ravindra Bagale’s Tip
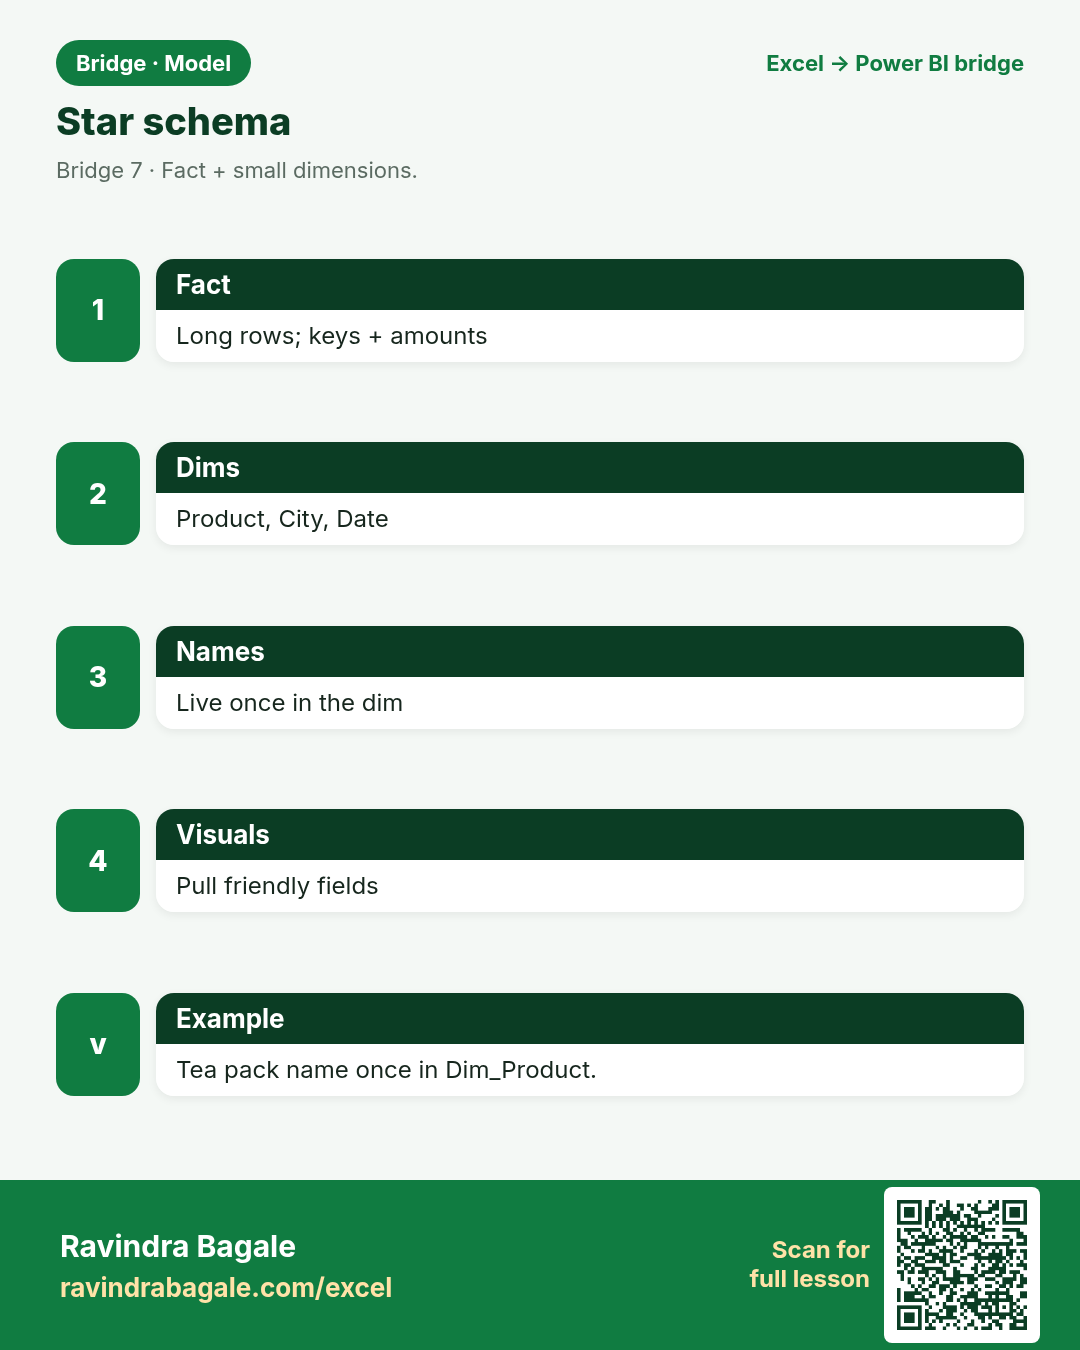
Star schema: one fact, small dimensions, single-direction filters for class clarity.
Ravindra Bagale’s Tip – मराठी
Star schema: एक fact, छोटी dimensions, class साठी simple filter direction.
Ravindra Bagale’s Tip – हिंदी
Star schema: एक fact, छोटी dimensions, class के लिए simple filter direction.
1. Flat sheet → star
Friends,
Facts are long and skinny on keys. Dimensions are short and descriptive.
चला मित्रांनो
Facts लांब + keys. Dimensions छोटी + वर्णने.
चलो दोस्तों
Facts लंबी + keys. Dimensions छोटी + वर्णन.
Why: Repeating ProductName on every sale wastes and risks typos.
What: Fact_Sales + Dim_Product + Dim_City.
How:
- Load Fact_Sales, Dim_Product, Dim_City.
- Check key columns are Text/proper types.
- Open Model view.
- See three boxes ready to relate.
| Excel | Power BI / DAX | Result | Meaning |
|---|---|---|---|
Excel flatAllData sheet |
Power BIFact + dims |
Star |
Priya’s tea pack name lives once in Dim_Product. |
2. Create relationships
Friends,
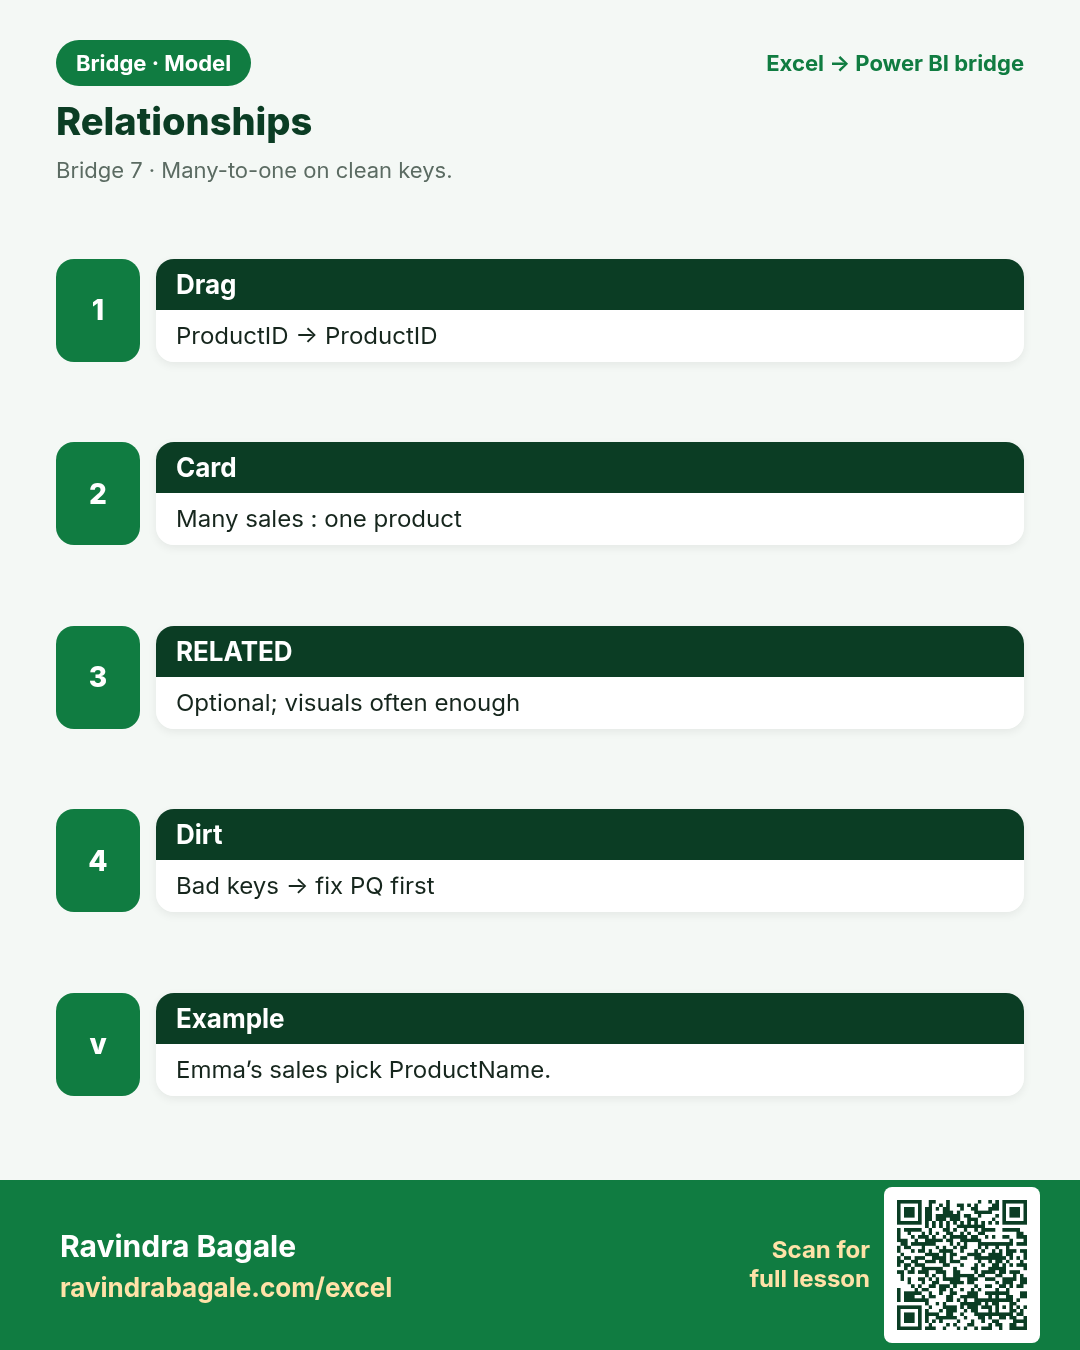
If the cardinality looks wrong, your keys are dirty — fix PQ first.
चला मित्रांनो
Cardinality चुकली तर keys घाणेरडे — आधी PQ.
चलो दोस्तों
Cardinality गलत हो तो keys गंदे — पहले PQ.
Why: ProductID to ProductID; CityKey to CityKey.
What: Drag in Model view (1:*).
How:
- Drag Dim_Product[ProductID] to Fact_Sales[ProductID].
- Expect many sales to one product (many-to-one).
- Repeat for City.
- Avoid bidirectional filters until you know why.
| Excel | Power BI / DAX | Result | Meaning |
|---|---|---|---|
Power PivotDiagram view relate |
Power BIModel view relate |
Linked |
Emma’s sales pick ProductName via relationship. |
4. Date table habit
Friends,
Do not use the fact’s auto date hierarchy as your long-term plan.
चला मित्रांनो
Fact ची auto date long-term plan नको.
चलो दोस्तों
Fact की auto date long-term plan नहीं.
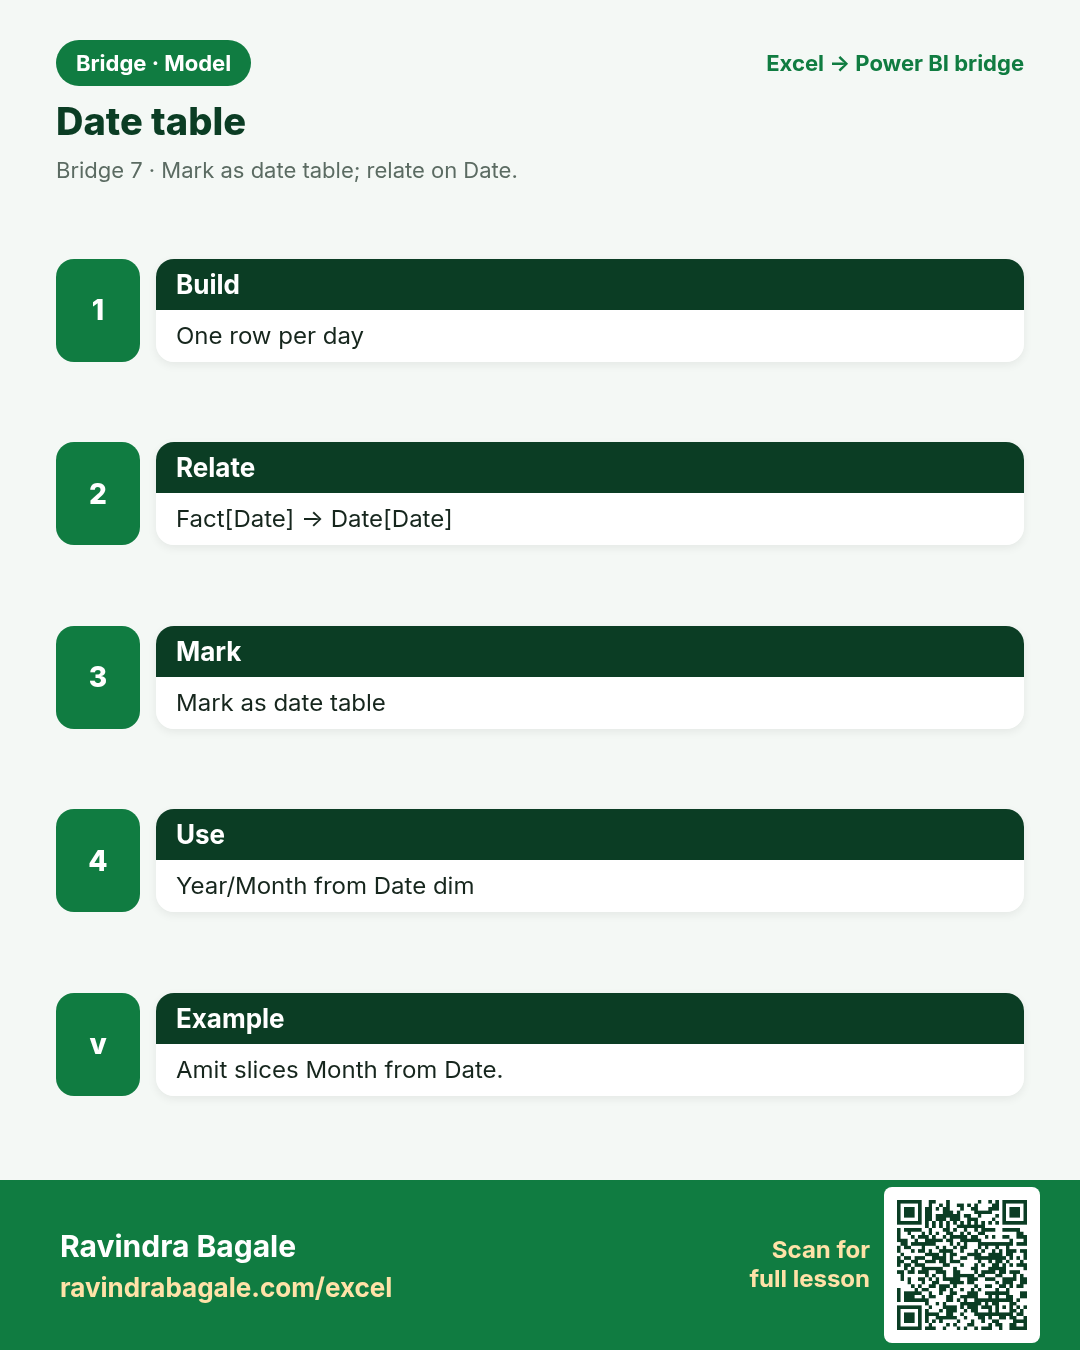
Why: Time intelligence needs a real Date table.
What: Mark as date table; relate on Date.
How:
- Build or load a Date table (one row per day).
- Relate Fact_Sales[Date] to Date[Date].
- Mark as date table in Desktop.
- Use Year/Month from Date, not from the fact.
| Excel | Power BI / DAX | Result | Meaning |
|---|---|---|---|
Excel cubeOften missing |
Power BIDate table marked |
Calendar |
Amit slices by Month from Date. |
5. Measures live in the model
Friends,
One measure, many visuals — that is the point.
चला मित्रांनो
एक measure, अनेक visuals — हेच मुद्दा.
चलो दोस्तों
एक measure, कई visuals — यही बात.
Why: Power Pivot measures move to Desktop measures.
What: New measure on the fact table home.
How:
- Create Total Sales = SUM(Fact_Sales[Amount]).
- Home it on Fact_Sales.
- Use in Matrix Values.
- Stop burying logic only in Excel cells.
| Excel | Power BI / DAX | Result | Meaning |
|---|---|---|---|
Power PivotMeasures grid |
Power BINew measure |
Total Sales |
Neha’s Matrix uses one measure everywhere. |
6. Filter direction for class
Friends,
If you need both directions, write why in Notes.
चला मित्रांनो
Both directions हवे असल्यास Notes मध्ये why लिहा.
चलो दोस्तों
Both directions चाहिए तो Notes में why लिखो.
Why: Single direction dim → fact is the calm default.
What: Bidirectional only with a reason.
How:
- Keep dim filters flowing to the fact.
- Explain why Product filters Sales.
- Avoid both-directions “to make a visual work” without diagnosis.
- Fix model, do not paper over.
| Excel | Power BI / DAX | Result | Meaning |
|---|---|---|---|
DefaultSingle direction |
AdvancedBoth (careful) |
Calm |
Chen Wei’s class model stays predictable. |
7. Hide keys from report view
Friends,
Hide keys; teach names.
चला मित्रांनो
Keys लपवा; नावे शिकवा.
चलो दोस्तों
Keys छिपाओ; नाम सिखाओ.
Why: Keys help the model; clutter the field list.
What: Hide ProductID in report view.
How:
- Hide foreign keys that users should not drop on visuals.
- Keep friendly names visible.
- Document hidden fields for teachers.
- Students use ProductName, not P01.
| Excel | Power BI / DAX | Result | Meaning |
|---|---|---|---|
Power PivotHide from client |
Power BIHide in report view |
Clean UI |
Sofia’s field list shows City, not CityKey. |
8. Excel Data Model still useful
Friends,
Skills transfer. Files do not have to.
चला मित्रांनो
कौशल्य जाते. फाइल जाण्याची गरज नाही.
चलो दोस्तों
कौशल्य जाता है. फ़ाइल जाना ज़रूरी नहीं.
Why: Power Pivot in Excel remains a training gym.
What: Same ideas; Desktop is the publishing stage.
How:
- Practice relationships in Excel Data Model if licenses allow.
- Publish serious shared models via Power BI.
- Analyze in Excel can consume the Service dataset.
- Pick gym vs stadium wisely.
| Excel | Power BI / DAX | Result | Meaning |
|---|---|---|---|
ExcelData Model gym |
Power BIStadium for sharing |
Path |
Ananya trains in Excel, ships in PBI. |
Practice tasks (12)
Use bridge-model-practice.xlsx. LibreOffice-safe: prefer SUMIF / VLOOKUP / IF — avoid XLOOKUP, TEXTJOIN, TEXTSPLIT.
- Read About. Open Fact_Sales, Dim_Product, Dim_City.
Hint
Keys.
- VLOOKUP ProductName onto a copy of Fact (LibreOffice VLOOKUP).
Hint
Feel the old way.
- List the two relationships you will create.
Hint
ProductID, CityKey.
- COUNTIF ProductID P01 on Fact.
Hint
Many sales → one product.
- Write star schema in one sentence.
Hint
Notes.
- Draft Total Sales measure text.
Hint
SUM(Fact_Sales[Amount]).
- Explain why Date table beats fact auto-date.
Hint
Time intel.
- Propose which fields to hide in report view.
Hint
Keys.
- Flag blank ProductID with IF.
Hint
Quality.
- SUM Amount for PUN CityKey with SUMIF.
Hint
Before RELATED.
- Why single-direction filters for class?
Hint
Predictable.
- Gym vs stadium: when Excel model vs PBI publish?
Hint
Audience/refresh.
Quick quiz
Q1. Star schema centres on…
Q2. Many sales to one product is…
Q3. RELATED needs…
Q4. Date table should be…
Q5. Measures belong…
Q6. Class-default filter direction…
Q7. Hide in report view mainly for…
Q8. Power Pivot in Excel is…
Loading practice tasks...
- Rows in the fact table (Easy): How many orders are in the Sales table?
- Total amount (Easy): Add up the Amount column of Sales.
- Total quantity (Easy): Add up the Qty column of Sales.
- Products in the dimension (Easy): How many products are in the Products table?
- Products actually sold (Medium): How many of the 5 Product IDs (P01 to P05) appear at least once in Sales?
- Amount for one city (Medium): Add up Amount where City is "London".
- Product name through the relationship (Medium): What is the Product name for Product ID "P03"?
- Sales of one product (Medium): Add up Amount where Product ID is "P03".
- Average order amount (Medium): Find the average Amount, rounded to 0 decimals.
- Category of the first order (Hard): Find the Category of the product in the first order.
- Biggest order in London (Hard): What is the largest Amount where City is "London"?
- Share of P03 (Hard): What share of the total Amount comes from Product ID "P03"? Round to 3 decimals.
Quick revision cards (3)
Approved Excel card style: standalone, no tip/photo section, QR to this lesson.