Excel → Power BI Bridge
Bridge 9. Measures vs calculated columns
Friends,
Friends, excel loves helper columns. Power BI loves measures. Same maths — different home. Choose by context, not by habit.
चला मित्रांनो
चला मित्रांनो, Excel ला helper columns आवडतात. Power BI ला measures. तोच गणित — वेगळे घर. सवय नाही, context पाहा.
चलो दोस्तों
चलो दोस्तों, Excel को helper columns पसंद. Power BI को measures. वही गणित — अलग घर. आदत नहीं, context देखो.
At deploy, files go to s3://ravindrabagale-cards/excel/bridge/ .
What you will learn
- Spot helper-column habits.
- Prefer measures for aggregations under filters.
- Know when calculated columns are still right.
- Write SUM / DIVIDE measure sketches safely.
A short story
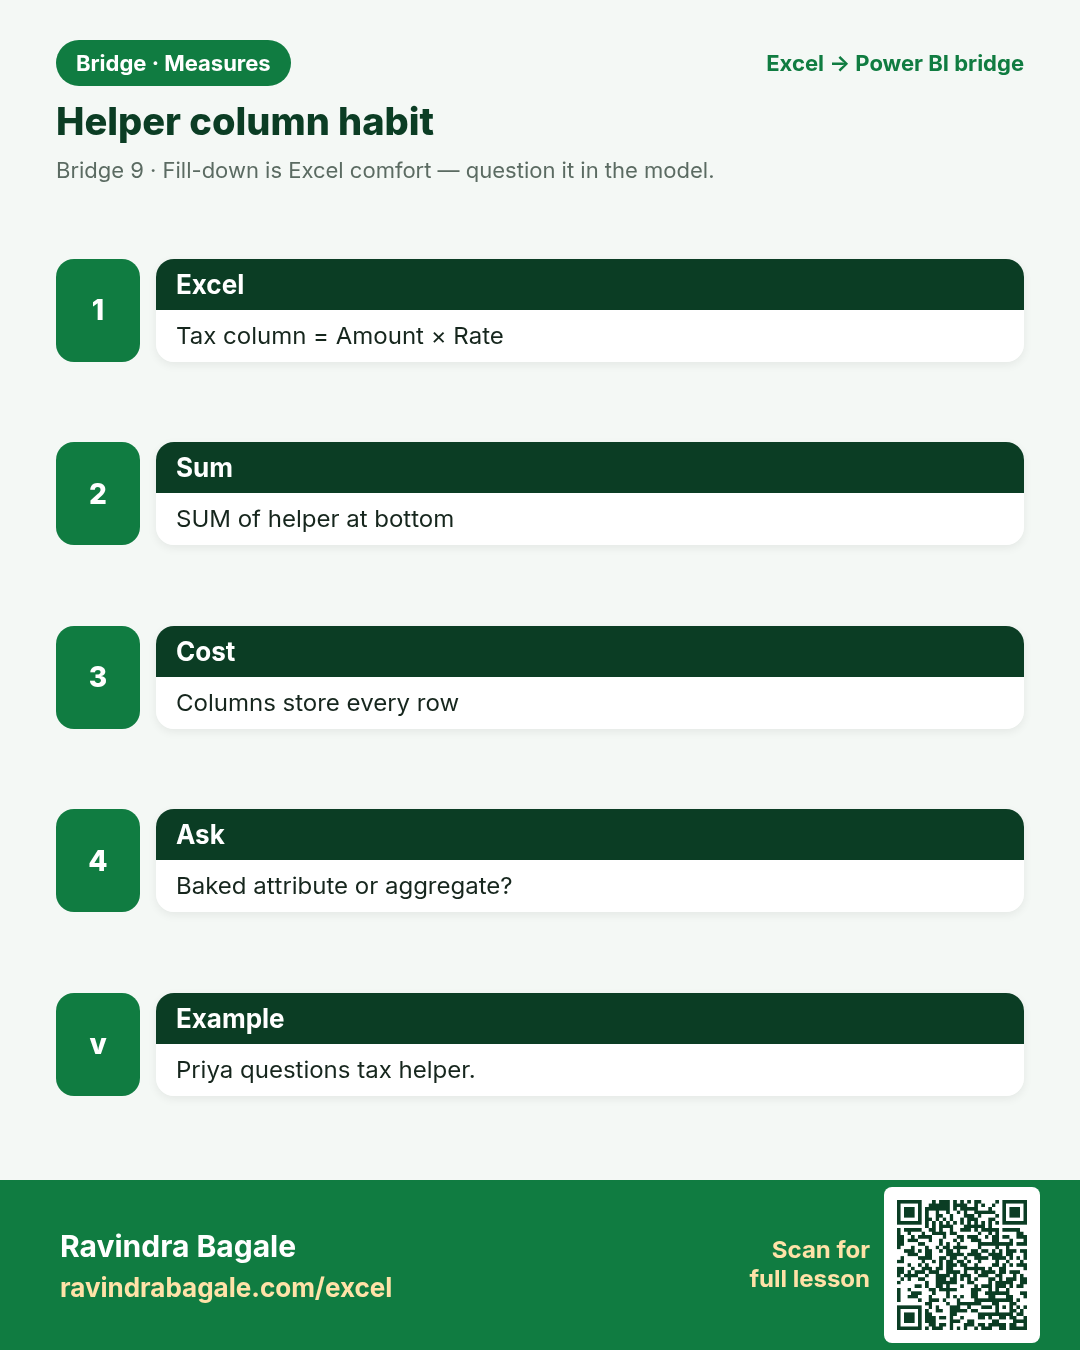
Tax = Amount × Rate looks like a helper column in Excel. As a total under slicers, Total Tax is usually a measure. Year extracted for a Date relationship may still be a column — or better, a Date table.
Ravindra Bagale’s Tip
If it must respond to slicers as an aggregation, start with a measure. If it is a row attribute or a relationship key, consider a column.
Ravindra Bagale’s Tip – मराठी
Slicers वर aggregation हवी असेल तर measure. Row attribute/key असेल तर column विचार.
Ravindra Bagale’s Tip – हिंदी
Slicers पर aggregation चाहिए तो measure. Row attribute/key हो तो column सोचो.
1. Excel helper column habit
Friends,
Baked columns use memory. Measures calculate in filter context.
चला मित्रांनो
Columns memory खातात. Measures filter context मध्ये मोजतात.
चलो दोस्तों
Columns memory खाती हैं. Measures filter context में गिनती हैं.
Why: Add a column, fill down, sum it.
What: Works on sheets; costly as a default in models.
How:
- On Helper_Tax, write =B2*C2 style tax (LibreOffice).
- Sum the helper.
- Notice it is baked per row.
- Ask: do I need this baked, or calculated on demand?
| Excel | Power BI / DAX | Result | Meaning |
|---|---|---|---|
ExcelHelper column + SUM |
Power BIOften a measure instead |
Choice |
Priya totals tax without storing every row forever. |
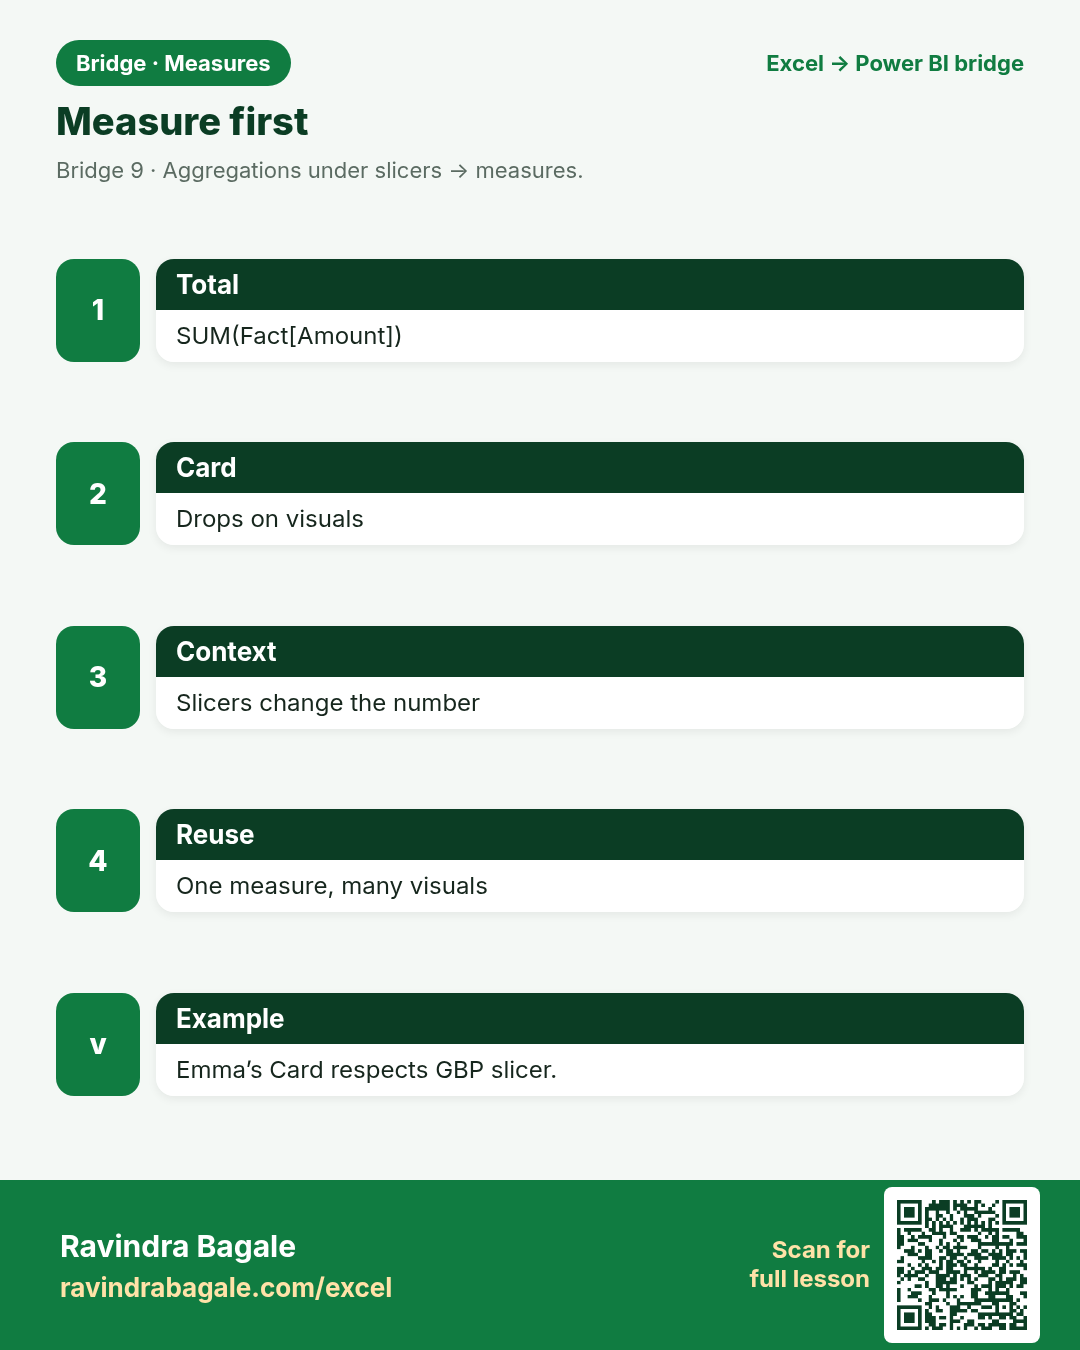
2. Measure first for totals
Friends,
Measures shine when filters change the answer.
चला मित्रांनो
Filters उत्तर बदलतात तेव्हा measures चमकतात.
चलो दोस्तों
Filters जवाब बदलते हैं तब measures चमकते हैं.
Why: Total Sales = SUM(Amount).
What: New measure.
How:
- Create Total Sales := SUM(Fact[Amount]).
- Drop on a Card.
- Slice by City — number changes.
- No extra physical column required.
| Excel | Power BI / DAX | Result | Meaning |
|---|---|---|---|
ExcelSUM at bottom |
DAX measureSUM in model |
Dynamic |
Emma’s Card respects the GBP slicer. |
3. Filter context in one breath
Friends,
You did not rewrite the measure — the context changed.
चला मित्रांनो
Measure पुन्हा लिहिली नाही — context बदलला.
चलो दोस्तों
Measure फिर नहीं लिखी — context बदला.
Why: Slicers/filters change what a measure sees.
What: Same measure, different number.
How:
- Total Sales with City=Pune.
- Total Sales with City=Manchester.
- Same formula code.
- Teach with a Card + slicer demo.
| Excel | Power BI / DAX | Result | Meaning |
|---|---|---|---|
ExcelSUMIF variants |
DAXFilter context |
Two answers |
Amit sees Nashik vs all. |
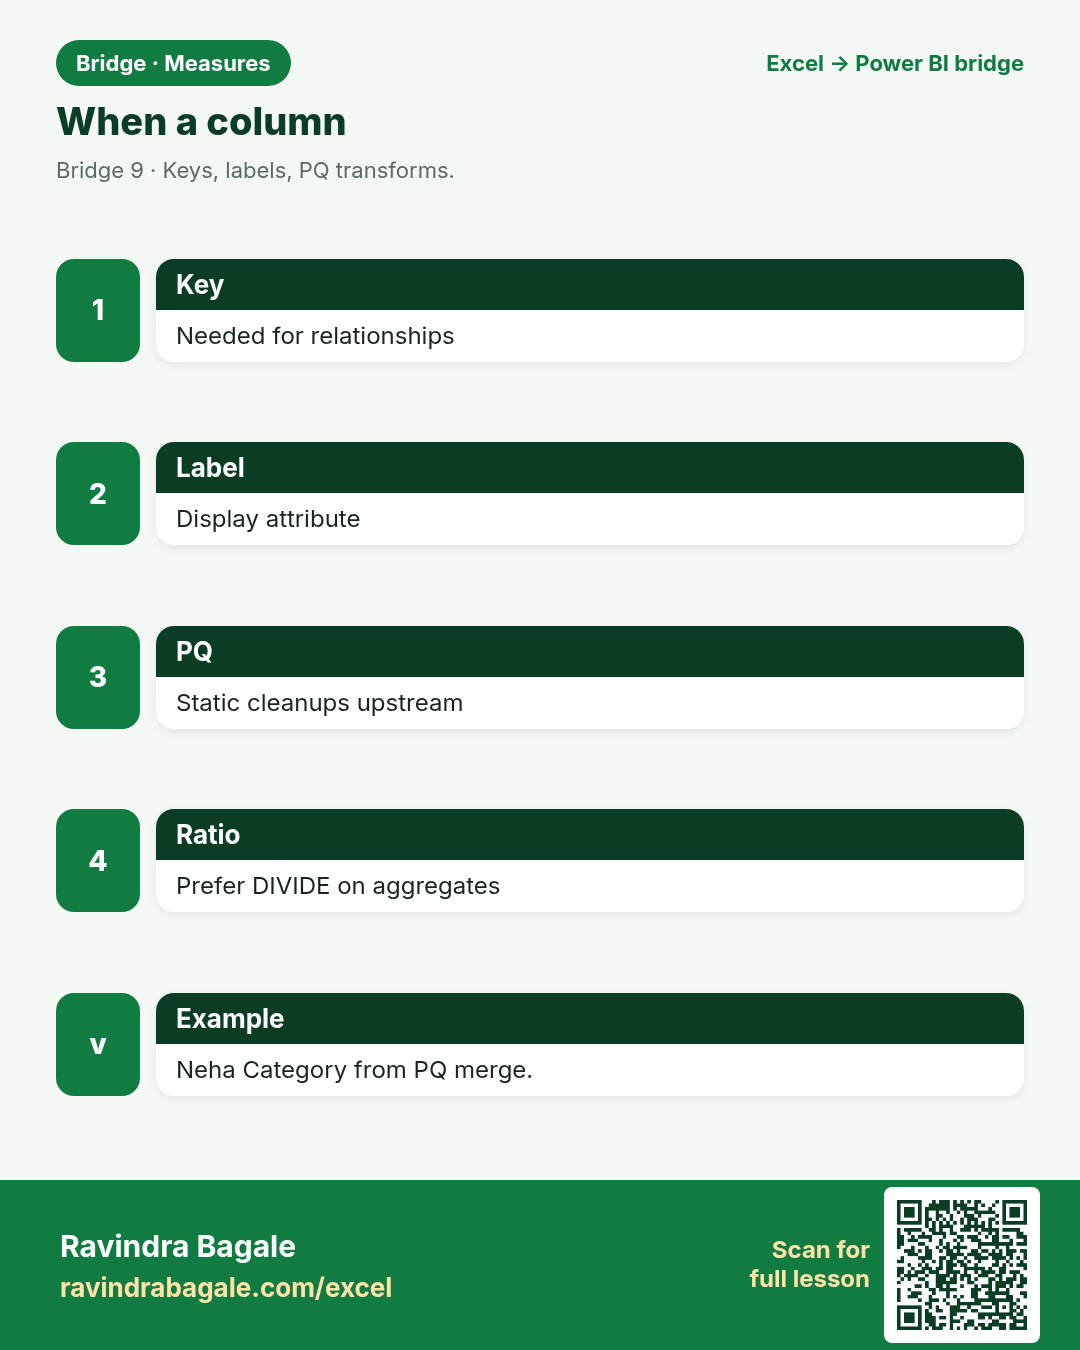
4. When a column is still right
Friends,
If it describes the row, column/PQ. If it aggregates rows, measure.
चला मित्रांनो
Row वर्णन = column/PQ. Aggregate = measure.
चलो दोस्तों
Row वर्णन = column/PQ. Aggregate = measure.
Why: Keys, static labels, relationship fields.
What: Calculated column or PQ column.
How:
- FullName for display may be a column.
- Year helper only if you refuse a Date table (prefer Date table).
- Tax as a key to another table → column.
- Heavy row-by-row text logic → prefer PQ.
| Excel | Power BI / DAX | Result | Meaning |
|---|---|---|---|
Need attributeColumn / PQ |
Need aggregateMeasure |
Split |
Neha stores Category from a merge in PQ. |
5. Safe ratios
Friends,
Average of ratios ≠ ratio of averages. Teach it once; save a year.
चला मित्रांनो
Ratio ची सरासरी ≠ सरासरींचे ratio.
चलो दोस्तों
Ratio का औसत ≠ औसतों का ratio.
Why: Do not use plain / for totals blindly.
What: DIVIDE(num, den).
How:
- Avg Ticket := DIVIDE([Total Sales],[Order Count]).
- Avoid column of ratios then average (math trap).
- Prefer measure ratios on aggregates.
- Label units.
| Excel | Power BI / DAX | Result | Meaning |
|---|---|---|---|
ExcelAverage of row ratios trap |
DAXDIVIDE on totals |
Honest avg |
Omar’s fee average is total/count. |
6. Calculated column cost
Friends,
Free-feeling columns are not free in a million-row fact.
चला मित्रांनो
लाखो rows वर columns मोफत नाहीत.
चलो दोस्तों
लाखों rows पर columns मुफ़्त नहीं.
Why: Each column stores values for every row.
What: Memory + refresh cost.
How:
- Huge fact + many calculated columns = heavy model.
- Prefer PQ for static transforms.
- Prefer measures for aggregates.
- Profile before adding “just one more” column.
| Excel | Power BI / DAX | Result | Meaning |
|---|---|---|---|
ExcelColumns feel free |
ModelColumns cost RAM |
Diet |
Chen Wei keeps the model lean. |
7. Migrating a helper
Friends,
Decision beats nostalgia for fill-down.
चला मित्रांनो
निर्णय > fill-down ची नostalgia.
चलो दोस्तों
फ़ैसला > fill-down की nostalgia.
Why: Ask three questions.
What: Attribute, key, or aggregate?
How:
- Is it used as a key? → column/PQ.
- Is it a display label? → column/PQ or visual.
- Is it summed/averaged under filters? → measure.
- Rewrite on Decide sheet.
| Excel | Power BI / DAX | Result | Meaning |
|---|---|---|---|
HabitAlways column |
BridgeDecide sheet |
Clear |
Sofia migrates tax total to a measure. |
8. Tiny measure kit
Friends,
Four solid measures beat forty random calculated columns.
चला मित्रांनो
चार solid measures > चाळीस random columns.
चलो दोस्तों
चार solid measures > चालीस random columns.
Why: SUM, COUNTROWS, DIVIDE, CALCULATE peek.
What: Write in Notes; build in Desktop later.
How:
- Total Sales := SUM(...).
- Orders := COUNTROWS(Fact).
- Avg := DIVIDE([Total Sales],[Orders]).
- Pune Sales := CALCULATE([Total Sales], Dim_City[City]="Pune") — after relationships.
| Excel | Power BI / DAX | Result | Meaning |
|---|---|---|---|
ExcelSUMIF / COUNTIF |
DAXSUM / COUNTROWS / CALCULATE |
Kit |
Ananya’s five-measure starter kit. |
Practice tasks (12)
Use bridge-measures-practice.xlsx. LibreOffice-safe: prefer SUMIF / VLOOKUP / IF — avoid XLOOKUP, TEXTJOIN, TEXTSPLIT.
- Read About and Decide sheet.
Hint
Column vs measure.
- On Helper_Tax, fill Tax_helper_col with =B2*C2.
Hint
Excel habit.
- SUM the helper column.
Hint
Baked total.
- Write Total Tax as a measure sketch in Notes.
Hint
SUMX or Amount*Rate patterns — keep simple SUM of tax column if baked.
- Mark each Decide row with Column or Measure.
Hint
Your answers.
- Explain filter context with City slicer in 2 lines.
Hint
Notes.
- Draft DIVIDE average ticket measure text.
Hint
DIVIDE.
- Why not average a column of percentages?
Hint
Math trap.
- List two cases for calculated columns.
Hint
Key / label.
- COUNT rows on Helper_Tax with COUNTA.
Hint
Orders.
- Rewrite one Excel SUMIF as CALCULATE sketch.
Hint
After model.
- Memory reason to prefer measures on large facts?
Hint
RAM.
Quick quiz
Q1. Aggregations under slicers usually belong in…
Q2. A relationship key field should be…
Q3. Filter context means…
Q4. DIVIDE is safer than / because…
Q5. Average of row ratios vs ratio of totals…
Q6. Many calculated columns on a huge fact…
Q7. Excel helper fill-down in a model…
Q8. COUNTROWS on a fact is closest to…
Loading practice tasks...
- Rows in the fact table (Easy): How many orders are in the Sales table?
- Total amount (Easy): Add up the Amount column of Sales.
- Total quantity (Easy): Add up the Qty column of Sales.
- Products in the dimension (Easy): How many products are in the Products table?
- Products actually sold (Medium): How many of the 5 Product IDs (P01 to P05) appear at least once in Sales?
- Amount for one city (Medium): Add up Amount where City is "London".
- Product name through the relationship (Medium): What is the Product name for Product ID "P03"?
- Sales of one product (Medium): Add up Amount where Product ID is "P03".
- Average order amount (Medium): Find the average Amount, rounded to 0 decimals.
- Category of the first order (Hard): Find the Category of the product in the first order.
- Biggest order in London (Hard): What is the largest Amount where City is "London"?
- Share of P03 (Hard): What share of the total Amount comes from Product ID "P03"? Round to 3 decimals.
Quick revision cards (3)
Approved Excel card style: standalone, no tip/photo section, QR to this lesson.