Ravi Sir's Cards › Chapter 13: Monitoring Basics
Grafana panel shows ‘No data’. How do you debug?
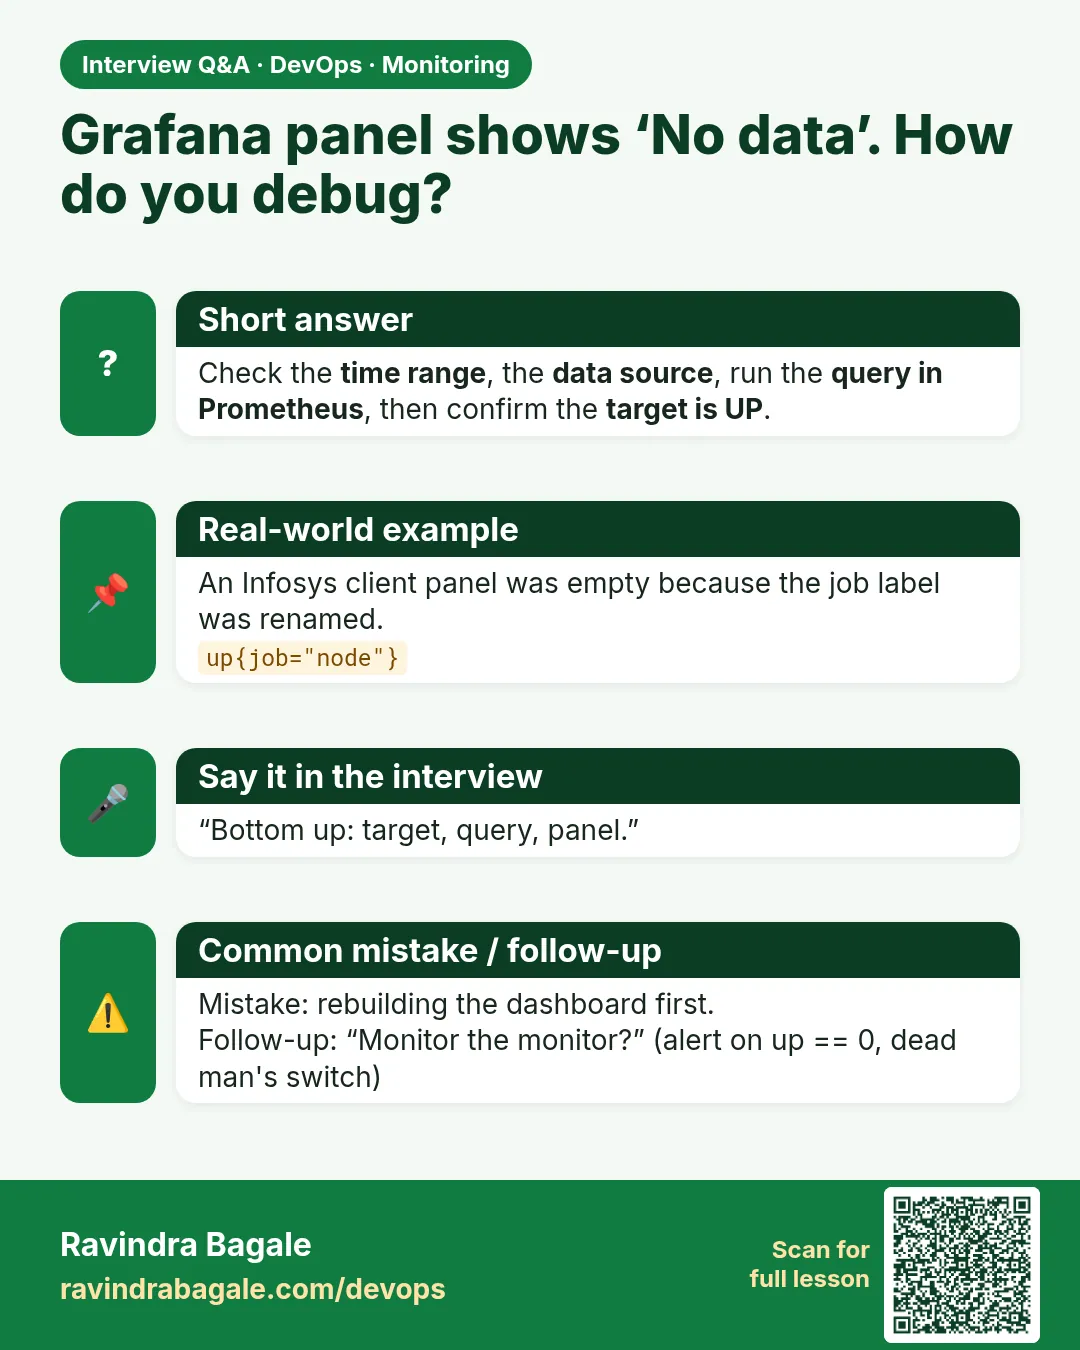
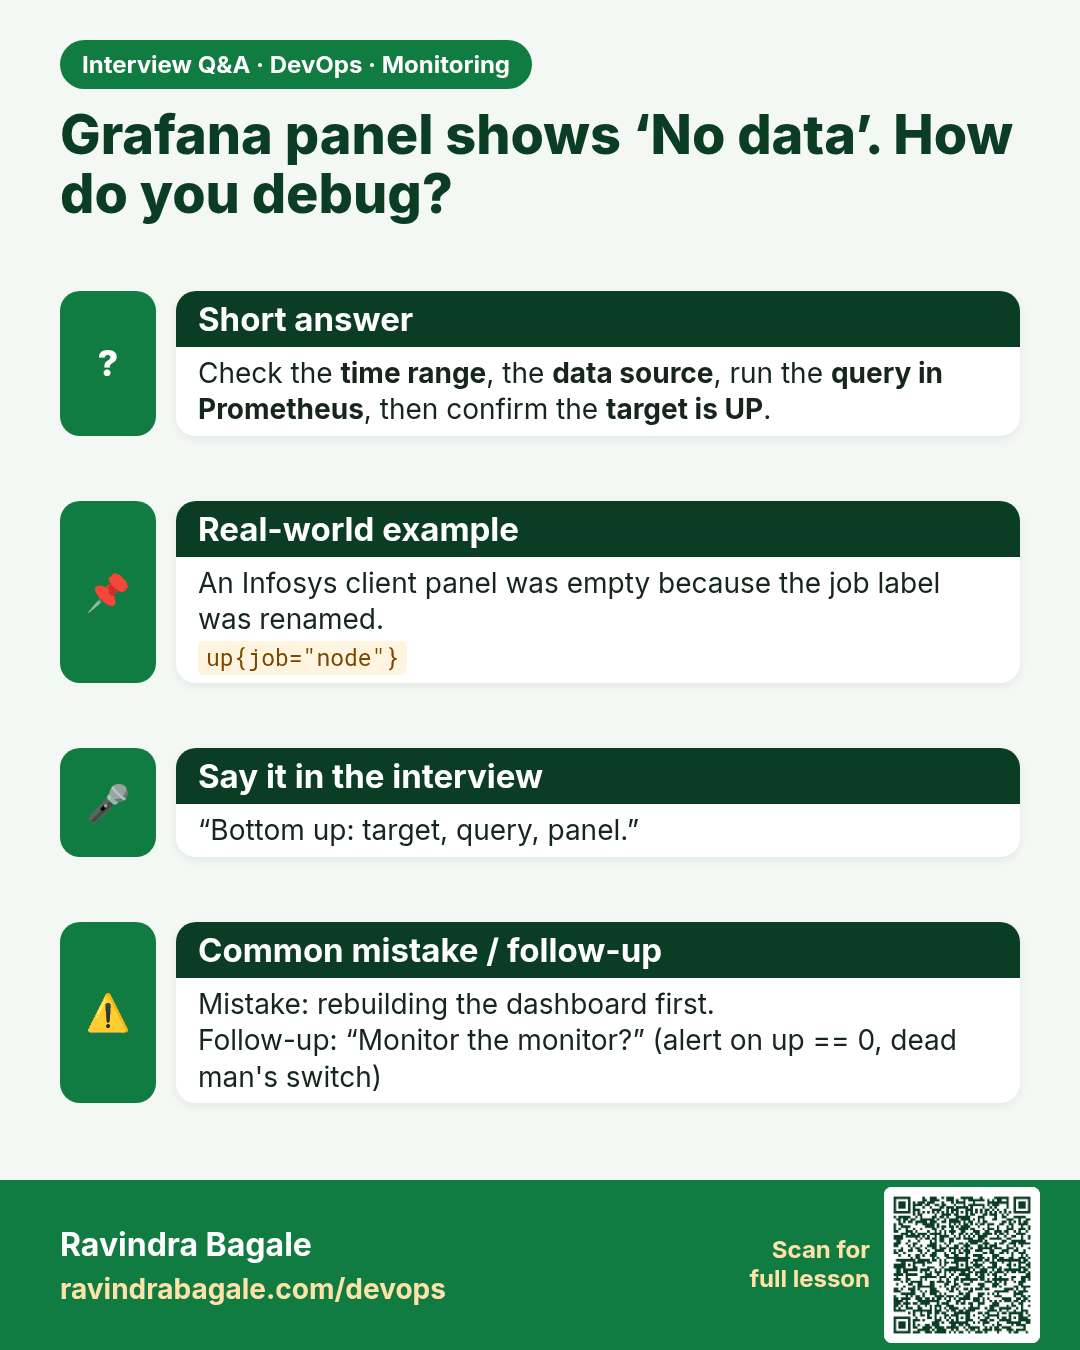
Grafana panel shows ‘No data’. How do you debug? Check the time range, the data source, run the query in Prometheus, then confirm the target is UP.
Lesson: 13.12 Troubleshooting table · मराठी card